Prevalence and Associated Characteristics of Metabolically Healthy Obese Phenotypes in a Community Dwelling Population
Sohee Shin
1, Jeong-Min Kim
2, Soonchang Sung
3, Hyun-Soo Kim
3,*
1
School of Exercise and Sport Science, University of Ulsan, Ulsan;
2Nowon Health Care Center, Seoul;
3Department of Sports Science, Seoul National University of Science and Technology, Seoul, Korea
Background: Recent research has focused on overweight and obese individuals with healthy metabolic pro- files. Metabolically healthy and obese (MHO) individuals may have unique characteristics, compared to meta- bolically unhealthy obese (MUO) individuals. The purpose of this study was to evaluate the prevalence and clini- cal characteristics of both MHO and metabolically unhealthy normal-weight (MUNW) phenotypes in a commu- nity dwelling population.
Methods: Data from women (n=1,916) and men (n=867) aged 20 to 73 years who participated in the Health Examination of Nowon Health Care Center were analyzed. Subjects were categorized according to the presence, absence, or combination of metabolic syndrome and Asian-specific body mass index (BMI) criteria for over- weight and obesity.
Results: The proportions of metabolic healthy individuals in the overweight and obese categories were 67%
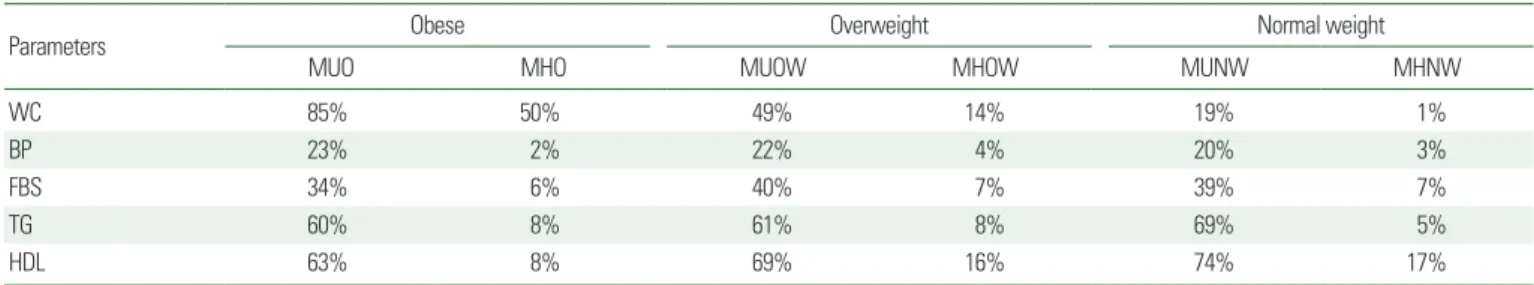
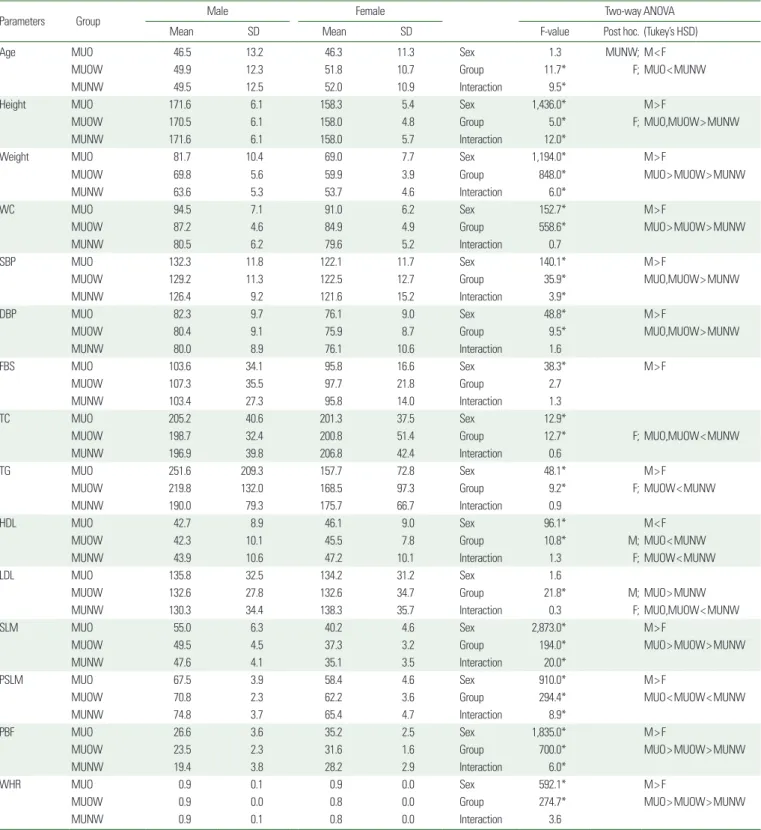
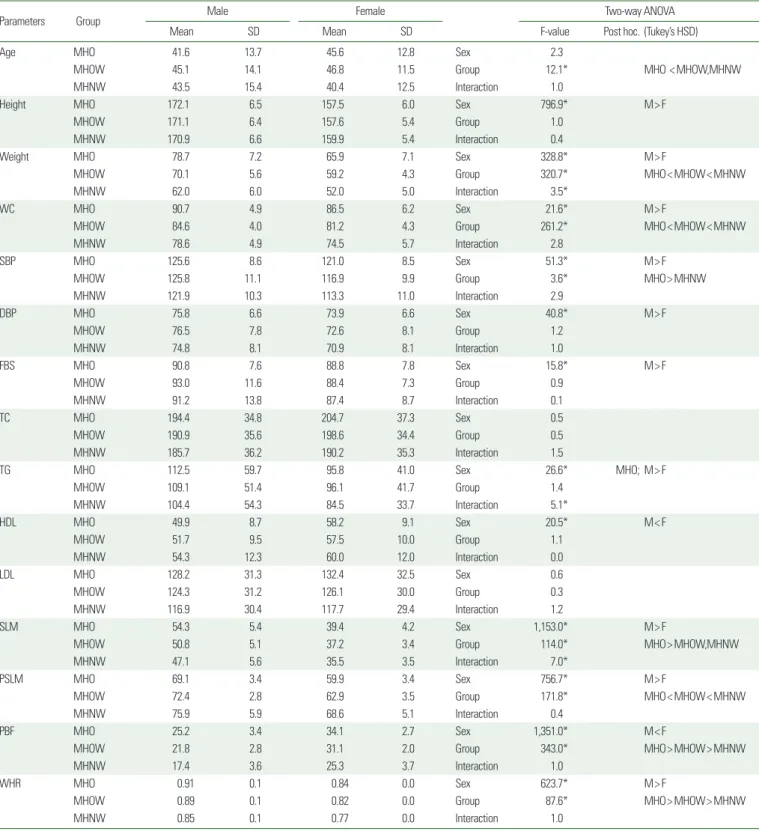
(overweight) and 39% (obese), respectively. The prevalence rate of the MUNW was 12% of normal weight indi- viduals. Within the overweight and obese categories, MHO individuals tended to be younger compared with their MUO counterparts. High waist circumference (WC) and low high-density lipoprotein cholesterol (HDL-C) levels were two of the most common metabolic risk factors observed in the metabolically unhealthy group.
Conclusion: The prevalence of both MHO and MUNW phenotypes is relatively high in this community-dwell- ing population. There is an urgent need for the implementation of lifestyle intervention, consisting of regular ex- ercise and healthy eating in the Nowon Health Care Center.
Key words: MHO, MUNW, Metabolic syndrome risk factor
Received September 2, 2016 Reviewed October 2, 2016 Accepted December 8, 2016
* Corresponding author Hyun-Soo Kim
http://orcid.org/0000-0003-1960-4376 Department of Sports Science, Seoul National University of Science and Technology, 138 Gongneung-gil, Nowon-gu, Seoul 01811, Korea Tel: +82-2-970-6299 Fax: +82-2-972-9763 E-mail: [email protected]
INTRODUCTION
Persons assessed as overweight or obese based on their body mass index (BMI) have a higher prevalence of metabolic complica- tions, such as dyslipidemia, hypertension, and diabetes.
1,2However, not all overweight or obese persons show metabolic risk. There are many persons with metabolically healthy obesity (MHO).
3,4It has been reported that 18-44% of overweight or obese persons are metabolically healthy, with high insulin sensitivity and no diabetes,
dyslipidemia, or hypertension.
3Metabolically unhealthy normal weight (MUNW) persons char- acteristically have a high risk of circulatory disease due to the exac- erbation of arteriosclerosis from insulinemia, insulin resistance, hy- pertriglyceridemia, and hypertension.
5However, no obesity is de- tected during evaluation based on body weight or BMI and there- fore, individuals tend to neglect proper prevention programs or regular treatment, resulting in an increased prevalence of chronic diseases due to increased body fat mass, particularly abdominal vis-
Copyright © 2017 Korean Society for the Study of Obesity
This is an Open Access article distributed under the terms of the Creative Commons Attribution Non-Commercial License (http://creativecommons.org/licenses/by-nc/4.0/) which per-
mits unrestricted non-commercial use, distribution, and reproduction in any medium, provided the original work is properly cited.
Prevalence and Associated Characteristics of Metabolically Healthy Obese Phenotypes in a Community Dwelling Population
Sohee Shin
1, Jeong-Min Kim
2, Soonchang Sung
3, Hyun-Soo Kim
3,*
1