Journal of Magnetics 25(4), 567-576 (2020) https://doi.org/10.4283/JMAG.2020.25.4.567
© 2020 Journal of Magnetics
T2-Weighted and Ultra-short TE Molecular Magnetic Resonance Imaging for
Gastric Cancer Diagnosis using Polymer-based Magnetic Nanoparticles
Hwunjae Lee1,2,3*†, Hyun-Ouk Kim4†, and Yong-Min Huh1,2*
1Department of Radiology, College of Medicine, Yonsei University, Seoul 03722, Republic of Korea
2YUHS-KRIBB Medical Convergence Research Institute, College of Medicine, Yonsei University, Seoul 03722, Republic of Korea 3Graduate Program of Nanoscience and Technology, College of Medicine, Yonsei University, Seoul 03722, Republic of Korea 4Department of Biotechnology and Bioengineering, Kangwon National University, Chuncheon, Gangwon-do 24341, Republic of Korea
(Received 19 September 2020, Received in final form 10 December 2020, Accepted 10 December 2020) Several recently developed technologies for molecular imaging have been applied to magnetic resonance (MR) imaging for cancer. In particular, various MR sequences with biocompatible polymer-based magnetic nanopar-ticles (pMNPs) have been applied for the MR imaging of cancer. However, there are several limitations to this approach, and passive contrast agents are not yet sufficiently targeted. This is a particular challenge for gastric cancer owing to the interference from stomach contents. Therefore, in this study we developed targeting con-trast agent and assessed its feasibility for early gastric cancer diagnosis using a mouse model. Specifically, we synthesized pMNPs, which enable both T2-weighted (T2) and ultra-short TE (UTE) MR imaging using hyal-uronic acid as the polymer, which binds to the receptor CD44, a recently identified biomarker of gastric cancer. Both MR sequences (T2, UTE) were analyzed with respect to imaging effects and targeting to the pMNPs. In vitro assessments showed no significant cytotoxicity of the pMNPs to MKN-45 and MKN-28 cells and con-firmed the cellular uptake of the pMNPs. MR signal enhancement was identified after pMNPs injection to the mice, and the pMNPs gradually accumulated in the tumors. Based on the results, we suggest that pMNPs serve as useful probes for imaging stem-like cancer cells, and can further provide new possibilities by simultaneously confirming T1 and T2 MR imaging effects.
Keywords : molecular imaging, T2 MRI, UTE MRI, magnetic nanoparticles, gastric cancer, CD44, magnetic reso-nance imaging
1. Introduction
Molecular imaging is an invaluable tool to diagnose cancer at the cellular and molecular levels [1].Molecular imaging not only allows for early and accurate tumor localization in diagnostic cancer imaging but also has potential to allow visualization of the biological processes of tumor growth, metastasis, and response to treatment in real-time clinical monitoring [2-6]. Molecular magnetic resonance (MR) imaging has emerged as a key modality for the diagnosis of cancer, owing to its advantages of non-invasiveness, good anatomical imaging given the high resolution and high contrast, and ability to provide
three-dimensional information in real time that is not possible with other imaging modalities such as positron emission tomography, single-photon emission computed tomography, and optical imaging [7].Furthermore, mole-cular MR imaging can simultaneously detect the meta-bolism of cells and tissues along with physiological and structural information in a non-invasive manner, provid-ing quantitative information on the biological processes occurring in the deep tissues [8].
Multimodal imaging strategies integrating manifold images have improved our ability to diagnose, to guide therapy, and to predict outcomes. Magnetic resonance imaging (MRI) is among the most widely used imaging technique in the clinic and can enable multi-parameter anatomical demonstration of diagnosis. Due to the inherent black-and-white production of MR images, however, MRI detection is largely hampered by the occurrence of false-positive diagnoses. In this Perspective, many research groups introduce the paradigm of manipulating the multi-©The Korean Magnetics Society. All rights reserved.
*Co-corresponding author: Tel: +82-2-2228-0819 Fax: +82-2-2227-8018, e-mail: [email protected] Tel: +82-2228-0874, Fax: +82-2227-7847 e-mail: [email protected]
parameter MRI, T1–T2 dual-modal MRI, along with
enhancement by specific contrast agents. Although mole-cular MR imaging is widely applied to visualizing lesions in multi-modalities for the diagnosis of gastric cancer, it also has important limitations [9]. In particular, it is difficult to diagnose gastric cancer based on MR images due to the interference by food and other digestive-system secretions in the stomach [10]. Extensive research effort has focused on development of updated MR technologies for gastric cancer diagnosis, demonstrating that these limitations can be overcome through the use of various MR sequences. A single MR image is obtained through the acquisition of various images via a sequence of operations that serves as significantly favorable factors [11]. There-fore, from a diagnostic point of view, simultaneously observing the T1-T2 effect using conventional T2 and ultra-short TE (UTE) is of great significance [12]. In particular, the ultra-short TE sequence allows for detec-tion of all components except for water associated with collagen, which has ultra short transverse relaxation (T2* less than 20 μs). Compared with conventional sequences, detection of these additional components may be useful in determining early stages of disease [13]. Nevertheless, there are still limitations to this approach. There are many MR contrast agents available for good-quality imaging [14]; however, passive contrast agents are not sufficient to reach their targets due to charge effects [15]. Because passive targeting facilitates deposition of nanovectors within the tumor microenvironment, owing to distinctive characteristics inherent to the tumor milieu, not normally present in healthy tissues. The delivery of nanoparticles is determined by factors associated with the tumor micro-vasculature, in addition to factors inherent to the nano-particle itself, such as size, shape and surface charge. Targeting strategies have taken a step further to enhance the selective uptake of nanoparticles into the tumor cells. Biorecognition molecules have been attached to the surface of the nanovectors to target specific markers that are overexpressed by the neoplastic cells. These strategies have been awarded the appellation ‘active targeting’, which exhibits a higher specificity and efficacy in achiev-ing the desired goal [16]. Thus, we are aimachiev-ing to develop the targeting contrast agent.
In this study, we designed biocompatible polymer (HA)-conjugated magnetic nanoparticles (pMNPs) for use in molecular MR imaging in a heterotopic xenograft gastric cancer model to elucidate the detailed biological processes occurring in gastric cancer. T2 sequence and UTE sequences were simultaneously used to confirm the better diagnostic potential and targeting effect of the pMNPs, and various in vitro and in vivo experiments were conducted to evaluate
the specific binding affinity and diagnostic effectiveness.
2. Materials and Methods
2.1. Synthesis of magnetic nanoparticles
To synthesize monodispersed MNPs, 2 mmol of iron (III) acetylacetonate, 1 mmol of manganese(II) acetyl-acetonate, 10 mmol of 1,2-hexadecanediol, 6 mmol of dodecanoic acid, and 6 mmol of dodecylamine were dissolved in 20 mL of benzyl ether under an ambient nitrogen atmosphere. The mixture was then pre-heated to 200 °C for 2 h and refluxed at 300 °C for 30 min. After the reactants were cooled at room temperature, the pro-ducts were purified with an excess of pure ethanol. Approximately 12 nm of MNPs were synthesized using the seed-mediated growth method.
2.2. Synthesis of aminated polysorbate 80
Aminated polysorbate 80 was synthesized using 1,1’-carbonyldiimidazole (CDI). In brief, 5 mmol of poly-sorbate 80 and 15 mmol of CDI (both from Sigma-Aldrich Chemical Co., St. Louis, MO, USA) were dis-solved in a flask containing 100 mL 1,4-dioxane (99.8 %; Sigma-Aldrich) and the reactant solution was stirred for 1 h. Subsequently, 15 mmol of ethylenediamine (Sigma-Aldrich) was added to the reactor at room temperature. After further reaction for 24 h, the solvent was rapidly eliminated using a rotary evaporator. The obtained trans-parent gel-type product was dissolved in 10 mL of deionized water and dialyzed against the excess aqueous phase for over seven days with a dialysis membrane (molecular weight cut-off: 1,000 Da; Spectrum Laboratory). The puri-fied product was freeze-dried and stored under vacuum for later use. The characteristic bands of synthesized poly-sorbate 80 were confirmed by Fourier-transform infrared spectroscopy (FT-IR; Varian, Excalibur® series). Ultrapure
deionized water was used for all synthesis reactions. 2.3. Phase transfer of nanoparticles with aminated polysorbate 80
pMNPs were prepared by the nanoemulsion method. MNPs (30 mg) were dissolved in 4 mL hexane (as the organic phase), and the organic phase was mixed with 20 mL of deionized water (as the aqueous phase) containing 100 mg aminated polysorbate 80. After mutual saturation of the organic and aqueous phases, the emulsion was ultra-sonicated in an ice-cooled bath for 20 min at 190 W. The organic solvent was evaporated overnight at room temperature, and the products were purified by centrifugal filtration (Centriprep YM-3, 3,000 Da, Amicon) with two cycles at 3,000 rpm for 1 h. The size distribution and
zeta-potential were analyzed by laser scattering (ELS-Z, Otsuka Electronics). The morphologies of the phase-transferred MNPs were confirmed using transmission electron microscopy (JEM-2100, JEOL Ltd.).
2.4. Bioconjugation of nanoparticles with the polymer (HA)
For the fabrication of taretable nanoprobes, HA, as a biocompatible polymer, was used as a targeting moiety by conjugation to the surface functional group of the pMNPs via N-(3-dimethylaminopropyl)-N-ethylcarbodiimide hydro-chloride (EDC) and N-hydroxysulfosuccinimide (sulfo-NHS), both obtained from Pierce. Thirty milligrams of HA (1,000,000 Da; Yuhan Pharmaceutical Corporation, Seoul, Korea) was dissolved in 10 mL phosphate-buffered saline (PBS, 10 mM, pH 7.4; Yuhan Pharmaceutical) and mixed with the MNPs. Sulfo-NHS (1.7 mg) and EDC (1.5 mg) were then added to the mixed polymer (HA) and MNP solution (pMNPs). The products were purified by a syringe filter, followed by centrifugal filtration (Centriprep YM-3, 3,000 Da, Amicon) with two cycles at 3,000 rpm for 20 min each.
2.5. Cytotoxicity assay
The cytotoxic effect of the pMNPs against MKN-45 and MKN-28 gastric cancer cells (American Type Culture Collection) was evaluated by measuring the inhibition of cell growth using the 3-(4,5-dimethylthiazol-2-yl)-2,5-diphenyltetrazolium bromide (MTT) assay. MKN-45 and MKN-28 cells were maintained in Roswell Park Memorial Institute-1640 (RPMI-1640) medium, containing fetal bovine serum and antibiotic-antimycotic solution (all from Gibco) at 37 °C in a humidified atmosphere with 5 % CO2. MKN-45 and MKN-28 cells (1.0 × 10⁴ cells/well)
were plated in a 96-well plate and incubated at 37 °C overnight, and then treated with various concentrations of the pMNPs for 24 h. The MTT assay was then performed, in which yellow tetrazolium salt was reduced to purple formazan crystals in metabolically active cells. The relative percentage of cell viability was determined as the ratio of formazan intensity in viable cells treated with pMNPs to the intensity in non-treated (control) cells. Cell viability was normalized to the value of non-treated cells (considered as demonstrating 100 % cell viability).
2.6. Darkfield microscopy
Darkfield microscopy is commonly applied to exclude the unscattered beams from the image so that the field around the specimen is generally dark. However, nano-particles under the same brightness scatter more than the cellular matrix, and thus shine brightly so that they are
visible as white spots. Thus, darkfield microscopy is a very simple, effective, and low-cost technique for confirm-ing interactions between nanoparticles and cells. MKN-45 cells (2.0 × 10⁵ cells/well) were seeded onto cover glasses
in 4-well plates and incubated for 4 h at 37 °C. Prepared MNPs and pMNPs (10 μg/mL) were added to Dulbecco’s modified Eagle’s medium (Roswell Park Memorial Institute, USA). After incubation for 48 h at 37 °C, the cells were washed with PBS and fixed with 4 % paraformaldehyde. To observe the optical absorption of the MNPs and pMNPs in the cells, light-scattering images were obtained using an inverted microscope (Olympus BX51, Japan) with a highly numerical darkfield condenser (U-DCW, Olympus), which delivers a very narrow beam of white light from a tungsten lamp to the surface of the sample. Immersion oil (nd: 1.516, Olympus) was used to narrow the gap between the condenser and the glass slide and to balance the refractive index. The darkfield pictures were captured using an Olympus CCD camera (Lee et al., 2012, 465101).
2.7. Prussian blue staining
Prussian blue staining is a commonly used histopatho-logy method to detect the presence of iron in specimens. Any ferric ion present in the specimens combines with the ferrocyanide and results in the formation of a bright blue color. As a result, the presence of a small amount of iron contained in the nanoparticles in cells or tissues can be confirmed. MKN-45 and MKN-28 cells (1.0 × 10⁶ cells/
well) were seeded onto 6-well plates with RPMI medium, and incubated for various times at 37 °C. Various con-centrations of prepared MNPs and pMNPs were added to the wells. After incubation for 4 h at 37 °C, the cells were washed with PBS and fixed with 4 % paraformaldehyde. The cells were then treated with a 1:1 mixture of 10 % potassium ferrocyanide and 20 % HCl, followed by incubation at 30 min at room temperature. The mixed solution was washed and the cells were stained with Nuclear Fast Red solution (Sigma-Aldrich) for 30 min at room temperature. The cells were observed using an optical microscope system (Olympus BX51, Japan).
2.8. Animal model and experimental procedures All animal experiments were conducted with the approval of the Association for Assessment and Accreditation of Laboratory Animal Care (AAALAC) International. Male BALB/C-Slc nude mice at 7–8 weeks of age were anesthetized by intraperitoneal injection of a Zoletil/ Rompun mixture and injected with 200 mL of 1.0 × 10⁷
MKN-45 cells suspended in saline into the femoral region. MR imaging was performed between 2 and 3 weeks after
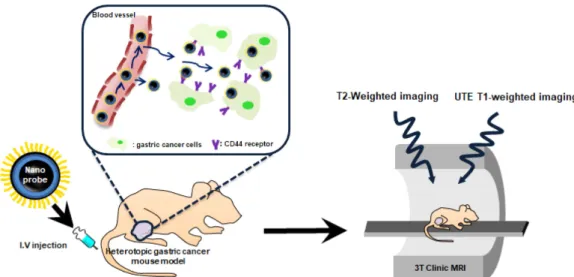
cancer cell implantation, followed by organ MR imaging. In addition, the extracted tumor tissues from tumor-bearing mice treated with pMNPs were frozen, sectioned, and stained using Prussian blue as described above. All stained tissue sections were analyzed using a virtual microscope (Olympus BX51, Japan) and Olyvia software. The overall experimental design is schematically illustrated in Scheme 1.
2.9. MR imaging
Animal, organ, and solution MR imaging experiments were performed on a 3 Tesla clinical MRI instrument using a wrist coil supplied by the same manufacturer (Magnetom Vida, Siemens Healthcare, Erlangen, Germany)”. Sequence details (commercial clinical product sequences): Ultra short TE (TR: 6.72 ms; TE: 0.07 ms, slice thick-ness: 0.6 mm, FOV read: 110 mm, flip angle: 4°, in-plane resolution: 0.28 mm, scan time: 10.24 min) and T2 Turbo spin echo (TR: 4000 ms, TE: 114 ms, slice thickness: 1.0 mm, FOV read: 180 mm, flip angle: 60-180°, in-plane resolution: 0.469 mm, scan time: 11 min)
3. Results
3.1. Preparation of MNPs and pMNPs
As shown in Fig. 1, the characteristic band of pMNP conjugates was verified by FT-IR spectra, which exhibited O-H stretching at 3200–3400 cm1, C=O stretching at
1100–1300 cm1, CO-NH (amide) bonds at 1630–1680
cm1,and CH
2 bending in the polymer (HA) at 1430–1470
cm1. As MR agents, uniform MNPs (12.38 ± 1.0 nm)
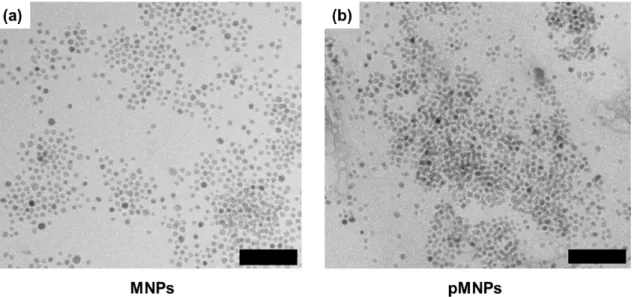
were synthesized at a high temperature via a thermal decomposition process. The size distribution and morpho-logy of the MNPs were confirmed by transmission electron
microscopy (Fig. 2), which showed no significant differ-ences in size or morphology between pMNPs and MNPs. The size of the water-soluble MNPs and pMNPs was determined to be 77.4 ± 32.4 nm and 137 ± 53.2 nm, respectively. In addition, the surface charge of aminated MNPs also changed from 20.62 ± 1.96 Mv (aminated water-soluble MNPs) to -17.76 ± 1.64 mV (pMNPs) due to the presence of HA (Fig. 3).
3.2. Solubility and intensity of pMNPs
Sequence details: Ultra short TE (TR: 6.72 ms; TE: 0.07 ms, slice thickness: 0.2 mm, flip angle: 4°, in-plane Scheme 1. (Color online) Schematic illustration of T2-weighed RF and UTE RF molecular MR imaging using polymer-based mag-netic nanoparticles in a mouse gastric cancer model.
Fig. 1. (Color online) FT-IR spectra of the polymer (HA, black line), MNPs (green line), and pMNPs (red line) (NH2 : 1538
cm1, Amide : 1650 cm1, C-N : 1100 cm1 ). This data proved
resolution: 0.28 mm, scan time: 10.24 min) and T2 Turbo spin echo (TR: 4000 ms, TE: 114 ms, slice thickness: 0.2 mm, flip angle: 60-180°, in-plane resolution: 0.469 mm, scan time: 11 min)
3.3. Biocompatibility
We showed that the MKN-45 and MKN-28 cells retain-ed over 80 % viability basretain-ed on the concentration of 0.4 μg Fe + Mn/mL after pMNP treatment in vitro (Fig. 5), indicating that the pMNPs are biocompatible even at high concentrations.
3.4. In vitro binding efficacy of pMNPs
Darkfield microscopy images demonstrated that the pMNPs displayed excellent binding ability to MKN-45 cells (Fig. 6). MKN-45 cells treated with pMNPs exhibited Fig. 2. Transmission electron microscopy (TEM) images of (a) MNPs and (b) pMNPs (scale bars = 100 nm). (a) MNPs were before coating with polymer and PMNPs were after coating with polymer. Magnetic nanoparticles have a uniform size of 12.38 ± 1.0 nm (100 particles were measured).
Fig. 3. Average size (gray bars) and zeta potential (black cir-cles) of MNPs and pMNPs The size of MNPs and pMNPs was determined to be 77.4 ± 32.4 nm and 137 ± 53.2 nm, respec-tively.
Fig. 4. (Color online) (a) Sample photograph and solution MR images (T2 and UTE MR sequence) under each condition (0.87 to 0.09 mM) and (b) T2 and UTE intensities based on (a).
a bright spot, and the membranes of pMNP-treated MKN-45 cells shone more brightly compared to those of the non-treated MKN-45 cells. The cells were incubated for 4 h with 10 μg/mL pMNPs. The scale bar represents 20 μg/ mL. As shown in Fig. 7, The cells were incubated for 4 h with 40 μg/mL pMNPs. The scale bar is 10 μm.
Numer-ous blue spots, produced by the rapid exchange of electrons between Prussian blue and the ferric ions of the pMNPs, appeared in the intracellular region. And MKN-28 is CD44 negative cell line, MKN-45 is CD44 positive cell line, pink color represents cells and blue color represents magnetic nanoparticles.
3.5. In vivo MR imaging
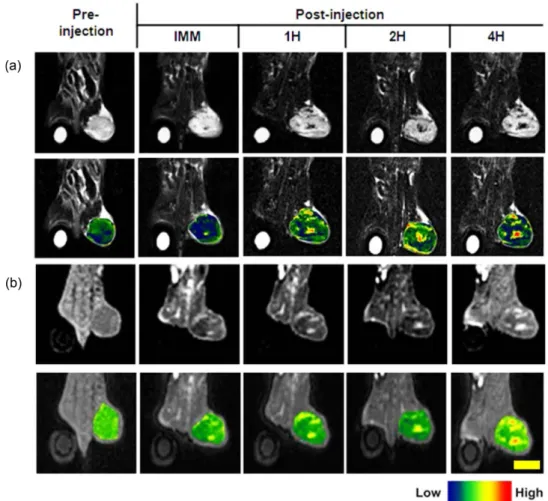
As shown in Figure 8, MR signal enhancement was identified after pMNPs injection to the mice. Initially, T2 time is shortened due to the influx of Manganese ferrite based contrast agent, resulting in a darker image. And then enhanced MR imaging signal intensity at the sur-rounding vessels was simultaneously observed. In T2-Fig. 5. Cell viabilities of MKN-45 and MKN-28 cells treated
with different concentrations of pMNPs. MKN-45 is CD44 positive cell line and MKN-28 is CD44 negative cell line. This data showed that pMNPs exhibited no significant proliferation inhibition (over 80 % cell viability).
Fig. 6. (Color online) Darkfield microscopy images of MKN-45 cells treated with pMNPs and untreated control cells. (The scale bar is 10 μm)
Fig. 7. (Color online) Prussian blue staining images of pMNPs-treated MKN-45 cells and MKN-28 cells, respectively (The scale bar is 10 μm).
weighted MR images, clear anatomical details were observed, and there was no artifact due to a difference in susceptibility. In contrast, in the UTE MR images, an opposite pattern of obvious enhancement of the MR
imaging signal was observed compared to that of the T2-weighted MR images after injection of pMNPs. Sequence details is (a) TR: 4,000 ms, TE: 114 ms, Slice thickness: 1.0 mm, FOV read: 180 mm, coil elements: wrist coil (b) Fig. 8. (Color online) In vivo MR imaging of MKN-45 xenograft mouse model (a) T2 TSE MR images of xenograft mouse model after intravenous injection of pMNPs. (b) UTE MR images of tumor-bearing mice after intravenous injection of pMNPs. The scale bar is 80 mm.
TR: 6.72 ms, TE:0.07 ms, Slice thickness: 0.6 mm, FOV read: 110 mm, Coil elements: wrist coil. The same tendency was observed in vitro as in vivo imaging. After sacrificing in vivo mice, each representative organ (tumor, liver, spleen, muscle) was placed in a dish with pbs and scanned by magnetic resonance imaging. Sequence details is (a) TR: 4,000 ms, TE: 114 ms, Slice thickness: 1.0 mm, FOV read: 180 mm, coil elements: wrist coil (b) TR: 6.72 ms, TE: 0.07 ms, Slice thickness: 0.6 mm, FOV read: 110 mm, Coil elements: wrist coil.
3.6. Histological analysis
In Fig. 10, the histological morphology of tumor was confirmed using H&E staining. We noticed that each of the cancer cells could be observed through hematoxylin (nucleus: blue) and eosin Y (cytoplasm: pink) staining.
4. Discussion
Molecular imaging have been applied to magnetic re-sonance (MR) imaging for cancer diagnosis. In particular, various MR sequences with biocompatible polymer-based magnetic nanoparticles (pMNPs) have been applied for the MR imaging of cancer. In this study, we confirmed the T1 and T2 magnetic resonance imaging using polymer based magnetic nanoparticles in various ways. Owing to the predominant T2 or T2* effects over the usual dipole-dipole relaxation mechanism that affects both T1 and T2, Manganese ferrite nanoparticles are usually treated as T2 or T2* contrast agents. On the other hand, Manganese ferrite nanoparticles also exhibit a high longitudinal R1 relaxivity providing intrinsic signal enhancement on T1 weighted images. However, conventional imaging sequences
cannot fully take advantage of such strong T1 weighted contrast effect because of the predominant T2 and spin dephase effects of Manganese ferrite nanoparticles. Ultra-short echo time (UTE) imaging is capable of imaging materials with extremely short T2 and very fast signal decay. With very short echo time, typically below 0.1 ms, UTE imaging allows for signal acquisition with little T2 influence. Therefore, we confirmed this using pMNPs. And also, pMNPs have polymer based targeting modality that can selectively increase contrast. This makes it possible to more clearly confirm the contrast enhancement of T1, T2.17,18,19 To make sure that the pMNP is well
synthe-sized, after amination with polysorbate 80, the peak at the 1650 cm1 region indicated the amide bond of the pMNPs
(Fig. 1, blue arrow). These results clearly demonstrated that the desired pMNPs were successfully synthesized. The size of the water-soluble MNPs and pMNPs was determined to be 77.4 ± 32.4 nm and 137 ± 53.2 nm, respectively. Thus, the size slightly increased after conju-gation of pMNPs due to the large molecular weight of the polymer (HA) of 1000 kDa. In addition, the surface charge of aminated MNPs also changed from 20.62 ± 1.96 Mv (aminated water-soluble MNPs) to -17.76 ± 1.64 mV (pMNPs) due to the presence of HA (Fig. 3). The reason why the surface charge changed from positive to negative is evidence that H.A coated the surface of the magnetic nanoparticles well. To assess the clinical feasi-bility of using the prepared pMNPs as MR imaging agents, we performed MR imaging experiments on solution samples using the pMNPs exhibiting the strongest magnetic pro-perties with appropriate size to prolong their retention in the circulation. As shown in Fig. 4(a), the T2-weighted MR image exhibited a negative strong intensity (black), Fig. 10. (Color online) (a) Prussian blue-stained image of the tumor in mouse xenograft model. and (b) image of the boxed section are magnified of 10 times from (a). Black arrows indicate iron.
which indicated a decrease in signal intensity owing to the thicker pMNP solution. In contrast, the UTE MR solution image demonstrated the opposite deposition (positive strong intensity: white) due to the very short TE. This means that the UTE sequence can enable positive contrast imaging (T1 MRI) without requiring a positive contrast agent. Comparison of the T2 and UTE intensities revealed an opposite deposition, which was confirmed by comparing the T2 intensity with UTE intensity. This demonstrated that the two types of image contrasts or weighting (T1/T2) were obtained with a single MR con-trast agent (T2) (Fig. 4b). Before processing nanoparticles, cytotoxicity tests were performed to determine the appro-priate concentration of treatment. MTT Assay is a sensi-tive, quantitative and reliable colorimetric assay that mea-sures viability, proliferation and activation of cells. The assay is based on the capacity of mitochondrial dehydro-genase enzymes in living cells to convert the yellow water-soluble substrate 3-(4,5-dimethylthiazol-2-y1)-2,5-diphenyl tetrazolium bromide (MTT) into a dark blue formazan product that is insoluble in water. Since this magnetic nanoparticle has a targeting ability, targeting ability was confirmed by darkfield microscopy. Darkfield microscopy images demonstrated that the pMNPs dis-played excellent binding ability to MKN-45 cells (Fig. 6). MKN-45 cells treated with pMNPs exhibited a bright spot, and the membranes of pMNP-treated MKN-45 cells shone more brightly compared to those of the non-treated MKN-45 cells. This confirmed that the HA-conjugated MNPs bound to the CD44 receptors of MKN-45 cells through receptor-mediated endocytosis. As shown in Fig. 7, Prussian blue staining confirmed the extent of intra-cellular uptake with pMNPs for both 45 and MKN-28 cells. Thus, the transport of pMNPs into MKN-45 cells took place efficiency. In contrast, untreated MKN-45 cells and MKN-28 cells exhibited no significant cellular uptake. The small fractions of iron observed represented non-specific cellular binding of the MNPs. The UTE MR images showed a more meaningful result regarding clinical diagnosis, and could also provide more information than possible with T2-weighted MR images from a diagnostic point of view. In area of Nanoscience for MR contrast agents, T1 and T2 images using contrast agents were only obtained by injecting the respective contrast agents, or T1, T2 contrast agents were obtained by making integrated T1/ T2 nanoparticle. Images obtained by injecting each con-trast agent (T1 and T2) cannot simultaneously obtain phenomena occurring in viewpoint of nano contrast agents, and also have a disadvantage in that a synthesis method is difficult in the case of a contrast agent carrying integrated T1/T2 nanoparticle. The key of this study is that T2
con-trast agent (Manganese ferrite based nanoparticles) was used to confirm the effect of T1 through the UTE sequence without integrated T1 (Iron oxide)/T2 (Manganese ferrite) nanoparticle. Previously, a single contrast MR agent (T2) for a single MR image (T2) was used in contrasting viewpoints. However, there were limitations in obtaining two types of image contrasts using the same single con-trast agent. This study demonstrated that the two types of images (T1/T2) were obtained with a single MR contrast agent (T2), and showed the possibility to overcome that limitation. This enhancement was confirmed by ex vivo images, it was confirmed in which organs pMNPs accumulate more in vivo using T2 and UTE sequence (Fig. 9). Figure 10(b) shows that the iron content (black arrows) of accumulated pMNPs in the tumors was also observed by Prussian blue staining. We thus confirmed that our developed pMNPs had an adequate capability for targeting CD44-overexpressing gastric cancer. Our study has some limitations, Firstly, absence of DICOM files and use of clinical MRI modality rather than animal MRI modality. As a result, various parameters could not be adjusted. We are currently planning an experiment using MRI equipment for only animals, and in the future study, we will try to improve the research by solving these problems. Secondly, we has been used as the imaging tool for identifying magnetic resonance images with a focus on nanoparticle’s application. In further study, we will make up in-depth and specific data about magnetic resonance imaging.
5. Conclusion
In summary, we synthesized pMNPs as MR imaging agents for effective diagnosis of CD44-overexpressing gastric cancer, which was verified in a mouse model. Development of this contrast agent using pMNPs and variable MR sequences can help to overcome the diffi-culty of gastric cancer diagnosis with MR imaging, especially at an early stage. From a diagnostic point of view, the ability to simultaneously observe the T1-T2 effect using conventional T2 and UTE is of great signi-ficance. Consequentially, this work shows potential to expand the applications of molecular MR imaging to guide cancer imaging.
Acknowledgments
This work was supported by grants from the National Research Foundation of Korea (NRF) funded by the Korean government (NRF-2020R1I1A1A01060851 and NRF-2019R1I1A1A01057005).
References
[1] S. M. Van Duijnhoven, M. S. Robillard, S. Langereis, and H. Grüll, Contrast Media Mol. Imaging. 10, 4 (2015).
[2] J. H. Lee, Y. M. Huh, Y. W. Jun, J. W. Seo, J. T. Jang, H. T. Song, S. Kim, E. J. Cho, H. G. Yoon, J. S. Suh, and J. Cheon, Nature Med. 13, 1 (2007).
[3] R. Weissleder and M. J Pittet, Nature 452, 7187 (2008). [4] M. Rudin and R. Weissleder, Nature Rev. Drug.
Discov-ery 2, 2 (2003).
[5] M. Desai, A. L. Slusarczyk, A. Chapin, M. Barch, and A. Jasanoff, Nature Comn. 7 (2016).
[6] M. A. Stammes, S. L. Bugby, T. Porta, K. Pierzchalski, T. Devling, C. Otto, J. Dijkstra, A. L. Vahrmeijer, L. F. de Geus-Oei, and J. S. D. Mieog, Br. J. Surg. 105, 2 (2018). [7] M. R. Makowski and R. M. Botnar, Radiology 269, 1
(2013).
[8] M. Haris, S. K. Yadav, A. Rizwan, A. Singh, E. Wang, H. Hariharan, R. Reddy, and F. M. Marincola, J. Transl. Med. 23, 13 (2015).
[9] A. Ito, Y. Ito, S. Matsushima, D. Tsuchida, M. Ogas-awara, J. Hasegawa, K. Misawa, E. Kondo, N. Kaneda, and H. Nakanishi, Gastric Cancer. 17, 3 (2014). [10] J. I. Choi, I. Joo, and J. M. Lee, Wolrd J. Gastroenterol.
20, 16 (2014).
[11] K. G. Hartley, B. M. Damon, G. T. Patterson, J. H. Long, and G. E. Holt, J. Am Acad. Orthop. Surg. 20, 12 (2015). [12] H. J. Kwon, W. H. Shim, G. Cho, H. J. Cho, H. S Jung, C. K. Lee, Y. S Lee, J. H. Baek, E. J. Kim, J. Y. Suh, Y. S. Sung, D. C. Woo, Y. R. Kim, and J. K. Kim, NMR Biomed. 28, 6 (2015).
[13] Eric Y. Chang, Jiang Du, and Christine B. Chung, J. Magn. Reson. Imaging. 41, 4 (2015).
[14] T. Okigawa, D. Utsunomiya, S. Tajiri, S. Okumura, A. Sasao, H. Wada, S. Oda, H. Arimura, E. Hayashida, J. Urata, and Y. Yamashita, Magnetic. Reson. Med. 13, 1 (2014).
[15] S. H. Yang, D. Heo, J. Park, S. Na, J. S. Suh, S. Haam, S. W. Park, Y. M. Huh, and J. Yang, Nanotechnology 23, 5 (2012).
[16] R. Bazak, M. Houri, S. E. Achy, W. Hussein, and T. Refaat, Mol. Clin. Oncol. 2, 6 (2014).
[17] W. C. Small, R. C. Nelson, and M. E. Bernardino, Magn. Reson. Imaging. 11 (1993).
[18] E. Canet, D. Revel, R. Forrat, C. Baldyporcher, M. Delo-rgeril, L. Sebbag, J. P. Vallee, D. Didier, and M. Amiel, Magn. Reson. Imaging. 11 (1993).
[19] J. Huang, X. Zhong, L. Wang, L. Yang, and H. Mao, Theranostics 2, 1 (2012).