ORIGINAL ARTICLE Special feature: Special Issue of Yonsei Univ. Creative Human Resources Center for Resilient Infrastructure (II)
이산화염소를 이용한 선박평형수 내 지표 미생물 불활성화
Inactivation of Indicating Microorganisms in Ballast Water Using Chlorine Dioxide
박종훈1ㆍ심영보2ㆍ강신영3ㆍ김상현4*
1고려대학교 건축사회환경공학부 박사 과정, 2연세대학교 사회환경시스템공학부 석사 과정, 3대구대학교 환경공학과 석사 과정,
4연세대학교 사회환경시스템공학부 교수
Jong-Hun Park1, Young-Bo Sim2, Shin-Young Kang3 and Sang-Hyoun Kim4*
1Department of Civil, Environmental and Architectural Engineering, Korea University, Seoul 02841, Korea
2School of Civil and Environmental Engineering, Yonsei University, Seoul 03722, Korea
3Department of Environmental Engineering, Daegu University, Gyeongsan 38453, Korea
4School of Civil and Environmental Engineering, Yonsei University, Seoul 03722, Korea
Received 21 June 2018, revised 30 July 2018, accepted 3 August 2018, published online 30 September 2018
ABSTRACT: Disinfection of ballast water using chlorine dioxide was investigated under various initial microorganism contents, dose concentrations and pH values. Kinetics of microorganism inactivation and byproduct generation of chlorine dioxide treatment were compared with the chlorine treatment. Results of treatments with chlorine dioxide concentrations of 0 to 10 mg Cl2/L showed that The optimum concentration of chlorine dioxide required for disinfection of ballast water was 1 mg/L. The difference among the second order reaction constants for bacterial disinfection at pH 7.2 to 9.2 for chlorine dioxide was less than 5% for both bacteria. This result implied that the bactericidal effects of chlorine dioxide was independent of the pH in the examined range. On the other hand, the inactivation kinetics of chlorine for E. coli and Enterococcus decreased by 17% and 25%, respectively, when pH increased from 7.2 to 9.2. The bactericidal power of chlorine dioxide was superior to sodium hypochlorite above pH 8.2, the average pH value of sea water. Furthermore, treatments of chlorine dioxide generated less harmful byproducts than chlorine and had a long-term disinfection effect on bacteria and phytoplankton from the results of experiment for 30 days. Chlorine dioxide would be a promising alternative disinfectant for ballast water.
KEYWORDS: Bacteria, Byproducts, Disinfection, pH, Phytoplankton
요 약: 선박평형수 처리에의 적용을 목적으로 다양한 미생물 농도, 소독제 주입량, pH 조건에서 이산화염소의 소독 효과를 조사하였다.
살균 반응 속도 및 소독 부산물 생성 여부는 선박평형수 처리에 일반적으로 사용되는 소독제인 염소와 비교 평가하였다. 선박평형수 배출 규제 항목인 E. coli 와 Enterococcus의 이산화염소에 의한 사멸 효과는 유사 2차 반응으로 모사하였다. 선박평형수 처리를 위한 최적 이산화염소 투입 농도는 1 mg/L으로 나타났다. pH 7.2 - 9.2 범위에서 이산화염소의 살균 반응 속도 상수의 변화폭이 5% 이내였던데 비해 같은 유효염소 농도에서의 염소의 살균 반응 속도 상수는 E. coli 기준 17%, Enterococcus 기준 25% 감소하여 약 염기성인 선박평형수의 소독에 이산화염소가 염소에 비해 효과적임을 확인하였다. 또한 생태계를 교란할 수 있는 소독 부산물 생성에 있어서도 염소에 비해 현격히 낮은 결과를 보였다. 소독 후 장기 보관 시 30일까지는 지표 세균 및 플랑크톤의 재증식은 발견되지 않았다. 이산화염소는 선박평형수에 적합한 소독제로 판단된다.
핵심어: 세균, 부산물, 소독, pH, 식물성 플랑크톤
*Corresponding author: [email protected], ORCID 0000-0003-3835-4077
ⓒ Korean Society of Ecology and Infrastructure Engineering. All rights reserved.
This is an open-access article distributed under the terms of the Creative Commons Attribution Non-Commercial License (http://creativecommons.org/licenses/by-nc/3.0/), which permits unrestricted non-commercial use, distribution, and reproduction in any medium, provided the original work is properly cited.
111
1. 서 론
선박평형수 (Ballast water)란 선박에 화물을 적하 시 부력에 의해 무게 중심이 높아져 선박안정성이 낮아 지는 것을 방지하기 위해 선박의 밑 부분에 채우는 물로 써, 해로를 통한 선박이동이 대부분이므로 주로 해수가 사용되며 국제적인 무역량이 증가함에 따라 선박평형 수의 사용량도 증가하는 추세이다. 국제해사기구 (In- ternational Maritime Organization, IMO)에서는 선박 평형수로 세계에서 매년 30 - 50 억 톤 이상의 바닷물이 이동하고 있으며, 7000종 이상의 수중 생물이 선박 평 형수와 함께 이동하고 있다고 보고하였다 (Latarche 2014). 선박평형수로 이동된 생물이 새로운 환경에서 정착하여 생존할 확률은 낮으나, 정착에 성공했을 경우 토착생물의 생존을 위협하며 생태계 교란을 일으킬 수 있다. 이에 따라 IMO는 2004년에 ‘선박평형수 처리기 준’을 제시하여, 우리나라를 비롯하여 세계의 모든 선 박은 2017년부터 선박평형수 처리장치를 의무적으로 장착하고 있다.
한편, IMO의 규정이 명문화되기 이전부터 선박평 형수 이동양이 많은 캘리포니아와 뉴욕 등은 선박평형 수를 규제 관리해왔으며, 현재는 IMO 규정보다 최대 1000배 강화된 규정을 적용 중이다. 특히 캘리포니아 주의 경우 세계 최고 수준의 선박평형수 처리 기준을 지
향하여, 장기적으로 선박평형수 내 미생물 불검출을 목 표로 하고 있다. 또한 뉴욕 주의 경우는 2013년 8월부터 모든 선박이 규제대상이되고, 2012년에는 미국해안경 비대 (USCG)에서 선박평형수 배출 기준을 제시하였 으며, 2013년 12월 1일 이후 제조되는 모든 선박은 이 를 만족해야한다 (Table 1). 이처럼 선박평형수 처리에 관해 여러 기준들이 생겨남에 따라 세계적 관심이 높아 지고 있으며, 국제 기준을 제시하는 IMO는 앞으로 보 다 강력한 규제를 할 것으로 예상된다. 현재 상용화된 선박평형수 처리 기술은 대부분 약품 주입 또는 전기분 해로 생성된 염소 (Cl2)를 이용한 살균에 바탕을 두고 있다. 그러나, 염소를 이용한 처리 기술은 pH가 높을 경 우 효율이 급격히 저하되며, Trihalomethanes (THM) 등과 같은 해양 생태계에 유해한 부산물이 생성될 가능 성이 높다는 한계가 있다 (Maranda et al. 2013, Simon et al. 2014). 본 연구에서는 강력한 산화제로 알려져 있 는 이산화염소 (ClO2)의 해수 내 미생물 사멸 능력을 염 소와 비교 평가하여 선박평형수 처리에 대한 적용 가능 성을 타진하였다. 선박평형수를 모사한 다양한 미생물 농도, 소독제 주입량, pH 조건에서 이산화염소의 소독 효과를 조사하고, 살균 반응 속도 및 소독 부산물 생성 여부를 선박평형수 처리에 일반적으로 사용되는 소독 제인 염소와 비교 평가하였다.
Table 1. Criteria for ballast water discharge (IMO 2004) Organism
category IMO US coast guard legislation California (SB497)
NY (CWA401)
Phase-1 Phase-2 2012 (all ships) 2013 (new ships)
Plankton, >50 µm in minimum
dimension <10 cell/m3 <10 cell/m3 <1 cell/100 m3 0 <1 cell/10 m3 0 Plankton,
10 - 50 µm <10 cells/mL <10 cells/mL <1 cell/100mL <0.01/mL <1 cell/10 m3 <0.01/mL
Plankton, ≤10 µm N/A N/A
<1,000 bacteria/100 mL
<10,000 virus/
100 mL
<1,000 bacteria/100 mL
<10,000 virus/
100 mL
N/A
<1,000 bacteria/100 mL
< 10,000 virus/100 mL Toxicogenic
Vibrio cholera (O1 and O139)
<1 CFU/
100 mL <1 CFU/
100 mL <1 CFU/100 mL <1 CFU/100 mL <1 CFU100 mL <1 CFU/100 mL
Escherichia coli <250 CFU
/100 mL <250 CFU
/100 mL <126 CFU /100 mL <126 CFU /100 mL <126 CFU /
100 mL <126 CFU /100 mL Intestinal
Enterococci <100 CFU
/100 mL <100 CFU
/100 mL <33 CFU /100 mL <33 CFU /100 mL <33 CFU /100 mL <33 CFU /100 mL
2. 재료 및 방법
2.1 선박평형수를 모사한 인공 해수 제조
대표성이 있는 해수 제조를 위해 ASTM (2013)에서 제안한 해수 조성에 따라 인공 해수를 제조하였으며 (Table 2), 이때 pH는 8.2로 측정되었다. 사용한 시약은 모두 덕산약품 (대한민국)에서 구입하였고 미량물질의 영향을 최소화하기 위하여 희석수로는 초순수를 사용 하였다. E. coli, Enterococcus, 종속영양세균의 농도는 G시 소재 하수처리장 유입수를 투입하여 조절하였으 며, 이때의 종속영양 세균 (heterotrophic bacteria) 농 도는 IMO가 제시하는 mL당 104 colony forming unit (CFU)이상 조건을 만족하였다 (Latarche 2014). 추가 로 식물성 플랑크톤 (phytoplankton)의 대표적인 종인 Tetraselmis suecica를 식종하였다 (Creswell 2010).
각 미생물의 초기 농도는 해수에 대한 기존 문헌을 참고 하여 설정하였다 (Maranda et al. 2013).
2.2 살균 실험
세균 초기 농도 (E. coli 572 - 8,704 CFU/100 mL, Enterococcus 122 - 1,951 CFU/100 mL), 이산화염소 농도 (0 - 10 mg/L), pH (7.2 - 9.2)를 변화하면서 8 - 12 hr 동안 살균 실험을 수행하였다. Tetraselmis suecica 초기 농도, 온도, 용존 유기탄소 농도는 각각 6,000 cell/mL, 20°C, 5 mg/L으로 고정하였다. pH 영향 고찰 시 동일한 유효 염소량의 염소 (Cl2)를 투입하여 미생물 사멸 효율을 비교 평가하였다. 또한 도출된 최적 조건
에서 이산화염소 및 염소 투입 후 42일간 실험을 수행 하여 미생물 재성장 여부 및 소독부산물 생성을 검증하 였다.
2.3 화학분석
이산화염소 및 염소 농도는 Standard Methods (APHA 1998)의 DPD ferrous titrimetric method (4500-Cl-F) 로 측정하였다. E. coli, Enterococcus, heterotrophic bacteria 농도는 IDEXX laboratories Inc. (Maine, USA) 의 Colilert18, Enterolert, HPC kit를 이용하여 분석하 였다. Tetraselmis suecica의 배양 및 계수는 Standard methods (APHA, 1998) 및 Creswell (2010)을 참고하 였다. THMs 항목은 Gas chromatography/mass spectrometry (GC/MS, Bruker 320MS, USA)를 활용 하여 측정하였다 (Lee and Lee 2015). 타 분석 항목은 Standard Methods (APHA, 1998)을 준용하여 분석하 였다.
3. 결과 및 고찰
3.1 살균 반응 속도 해석
미생물 살균 반응의 동력학적 해석을 위해 세균의 초 기 농도를 달리하여 온도 20°C, pH 8.2, 이산화염소 5 mg/L에서 이산화염소를 이용한 살균 실험을 수행하였 다. 세균 초기 농도는 하수처리장 유입수의 투입량을 통해 조절하였다. 시간에 따른 세균 및 플랑크톤의 농 도 변화는 1차식 Eq. 1 또는 2차식 Eq. 2로 해석하였다.
Table 2. Characteristics of artificial seawater (ASTM 2013)
Chemical Concentration salt (g/L) Percentage in salt (%)
NaCl 24.53 0.681
MgCl2 5.2 0.144
Na2SO4 4.09 0.114
CaCl2 1.16 0.0322
KCl 0.695 0.0193
NaHCO3 0.201 0.00558
KBr 0.101 0.0028
H3BO3 0.027 0.000749
SrCl2 0.025 0.000694
NaF 0.003 0.0000833
× (Eq. 1)
(Eq. 2)
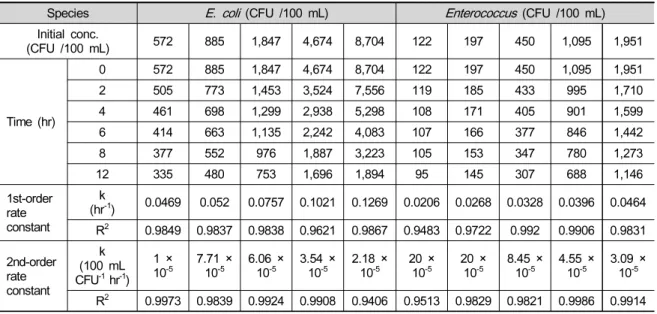
여기서 C0는 미생물 초기 농도 (CFU/100 mL for bacteria, cells/mL for phytoplankton), C는 시간에 따른 미생물 농도 (CFU/100 mL for bacteria, cells/mL for phyto- plankton), k는 살균 반응속도상수 (1차 반응의 경우 hr-1, 2차 반응의 경우 100 mL CFU-1 hr-1 for bacteria, mL cells-1 hr-1 for phytoplankton), t는 살균시간 (hr)이 다. E. coli는 초기 개체수 572, 885, 1,847, 4,674, 8,704 CFU/100 mL 조건에서, Enterococcus는 초기 개체수 122, 197, 450, 1,095, 1,951 CFU/100 mL 조건에서 실 험을 진행하였으며, 결과를 Table 3에 도시하였다. E.
coli 및 Enterococcus 반응 해석 최적화를 위한 모델링
결과 2차 반응의 반응상수 (k) 및 결정계수 (R2)가 1차 반응의 반응상수 및 결정계수에 비해 반응 해석에 적합 한 것으로 판단되어 차후 실험 결과 해석은 Eq. 2를 이 용하여 세균 농도에 대한 2차 반응으로 해석하였다. 한 편 E. coli, Enterococcus 모두 초기 개체수가 많을수록 2차 살균반응속도 k가 감소하는 형태를 보여 미생물 농 도에 있어 완전한 2차 반응이 아닌 유사 2차식인 것으 로 나타났다. 이는 이산화염소에 의한 세균의 소독 반 응이 단순한 1차 또는 2차 반응이 아닌 여러 단계로 구 성된 다소 복잡한 기작에 의해 진행되기 때문인 것으로 사료된다 (Benarde et al. 1967). 반면 Tetraselmis suecica의 경우 1차 반응의 반응상수 (k) 및 결정계수 (R2)가 2차 반응의 반응상수 및 결정계수에 비해 반응 해석에 적합한 것으로 판단되어 차후 실험 결과 해석은 1차 반응으로 해석하였다 (Table 4).
Table 3. Disinfection of E. coli and Enterococcus by chlorine dioxide at various initial bacterial contents
Species E. coli (CFU /100 mL) Enterococcus (CFU /100 mL)
Initial conc.
(CFU /100 mL) 572 885 1,847 4,674 8,704 122 197 450 1,095 1,951
Time (hr)
0 572 885 1,847 4,674 8,704 122 197 450 1,095 1,951
2 505 773 1,453 3,524 7,556 119 185 433 995 1,710
4 461 698 1,299 2,938 5,298 108 171 405 901 1,599
6 414 663 1,135 2,242 4,083 107 166 377 846 1,442
8 377 552 976 1,887 3,223 105 153 347 780 1,273
12 335 480 753 1,696 1,894 95 145 307 688 1,146
1st-order rate constant
(hrk-1) 0.0469 0.052 0.0757 0.1021 0.1269 0.0206 0.0268 0.0328 0.0396 0.0464
R2 0.9849 0.9837 0.9838 0.9621 0.9867 0.9483 0.9722 0.992 0.9906 0.9831 2nd-order
rate constant
(100 mL k CFU-1 hr-1)
1 ×
10-5 7.71 ×
10-5 6.06 ×
10-5 3.54 ×
10-5 2.18 × 10⁻⁵ 20 ×
10-5 20 ×
10-5 8.45 ×
10-5 4.55 ×
10-5 3.09 × 10⁻⁵ R2 0.9973 0.9839 0.9924 0.9908 0.9406 0.9513 0.9829 0.9821 0.9986 0.9914
Table 4. Disinfection of Tetraselmis suecica by chlorine dioxide
Time (hr)
Tetraselmis suecica
cells/mL 1st-order rate
constant, k (hr-1) R2 for the 1st-order rate constant
2nd-order rate constant, k (mL cells-1 hr-1)
R2 for the 2nd-order rate constant
0 6,000
0.5255 0.9930 0.0002 0.9722
2 2,000
4 1,000
6 0
8 0
3.2 이산화염소 농도 영향
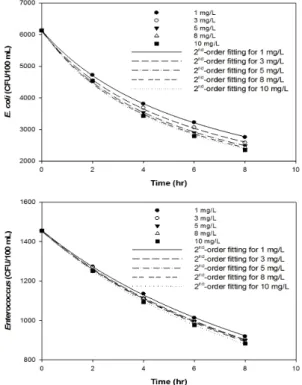
이산화염소 투입 농도를 0, 0.1, 0.5, 1 mg/L로 변화 시키면서 8시간 동안 살균 실험을 수행한 결과, 대조군 에 비해 이산화염소 투입 시 미생물의 농도가 확연히 줄 어들고, 이산화염소 농도의 증가에 따라 살균 반응 속 도가 향상됨을 효율이 향상됨을 확인하였다 (Fig. 1).
이에 추가적으로 이산화염소의 농도를 1, 3, 5, 8, 10 mg/L로 달리하여 8시간 동안 살균 실험을 진행하였으 며, 1 mg/L 이상에서는 이산화염소 농도 증가에 따른 살균 증대 효과가 미미한 것을 확인하였다 (Fig. 2). 이 산화염소 제조에 소요되는 비용을 절감하고 해수 방류 시 이산화염소에 의한 생태계 2차 교란을 방지하기 위 하여, 추후 살균 조건 도출 실험은 최적 이산화염소 농 도인 1 mg/L에서 진행하였다.
3.3 pH 영향과 염소와 살균력 비교
해수의 pH 농도 및 소독제 종류에 따른 E. coli 및 Enterococcus의 살균 반응속도를 비교하는 실험을 수 행하였다. 염소와의 살균 영향을 대조하기 위해 환원 반응식 (Eqs. 3 and 4)을 참조하여 유효염소농도를 동
일하게 하였으며 (이산화염소 1 mg/L, 염소 2.63 mg/L), pH에 따른 세균 농도 및 살균 반응 해석 결과를 각각 Tables 5 and 6에 나타내었다.
ClO2 + 5e- + 4H+→ Cl- + 2H2O (Eq. 3)
0.5Cl2 + e-→ Cl- (Eq. 4)
pH 7.2에서의 살균력은 이산화염소와 염소가 유사 하였지만, pH 8.2와 9.2에서는 이산화염소가 염소에 비해 우수한 살균 효과가 있음을 확인하였다. 해수의 pH가 통상적으로 8.0 이상임을 감안할 때, 동일한 유효 염소 농도에서 이산화염소가 염소에 비해 우수한 세균 살균력을 보일 것으로 판단된다. 이는 염소의 경우 차 아염소산 이온 (OCl-)에 비해 살균력이 100배 정도 높 은 차아염소산 (HOCl)의 비율이 pH가 증가할수록 감 소하나 (MetCalf and Eddy 2014), 이산화염소의 경우 pH에 따른 이온화가 진행되지 않기 때문인 것으로 판 단된다.
HOCl → H+ + OCl- (pKa: 7.58 at 20°C) (Eq. 5)
Fig. 1. Time-dependent decrease of E. coli and Enterococcus
with the treatment of chlorine dioxide up to 1 mg/L. Fig. 2. Time-dependent decrease of E. coli and Enterococcus with the treatment of chlorine dioxide from 1 to 10 mg/L.
3.4 소독제의 장기 영향 및 THM 생성 비교 평형수 처리 소독제 투입 시기를 결정하기 위해, 이 산화염소 주입 시 E. coli, Enterococcus, Total coliforms, Tetraselmis suecica 대한 영향을 42일 동안 관찰하였 다 (Table 5). 실험 결과, 42일 이후 E. coli의 농도는 각 각 855 CFU/100 mL에서 82 CFU/100 mL로 감소하였
고, Enterococcus의 농도는 637 CFU/100 mL에서 75 CFU/100 mL로 감소하여 IMO기준에 따른 개발목표 치인 <200 및 <80 CFU/100 mL를 달성함을 보여주었 다. 그러나, 시간에 따른 E. coli 및 Enterococcus 농도 변화를 살펴보면 30일 이후 조금씩 농도가 증가함을 볼 수 있다. 소독제 처리 후 장기 보관 시 세균의 재증식은 Maranda et al. (2013) 등 기존 문헌에서도 보고된 바 있
Table 5. Effect of pH on the disinfection of E. coli and Enterococcus by chlorine dioxide
Species E. coli (CFU /100 mL) Enterococcus (CFU /100 mL)
pH 7.2 8.2 9.2 7.2 8.2 9.2
Time (hr)
0 4,674 4,674 4,674 1,214 1,214 1,214
2 3,174 3,257 3,174 1,060 1,085 1,085
4 2,513 2,575 2,577 956 975 976
6 2,025 2,042 2,091 882 884 881
8 1,731 1,671 1,769 826 829 829
2nd-order rateequation
(100 mL k
CFU-1 hr-1) 4.67 × 10⁻⁵ 4.59 × 10⁻⁵ 4.47 × 10⁻⁵ 5.02 × 10⁻⁵ 4.94 × 10⁻⁵ 4.96 × 10⁻⁵
R2 0.9987 0.9989 0.9971 0.9927 0.9983 0.9978
Table 6. Effect of pH on the disinfection of E. coli and Enterococcus by chlorine
Species E. coli (CFU /100 mL) Enterococcus (CFU /100 mL)
pH 7.2 8.2 9.2 7.2 8.2 9.2
Time (hr)
0 4,674 4,674 4,674 1,214 1,214 1,214
2 3,151 3,241 3,325 1,085 1,112 1,169
4 2,646 2,638 2,789 956 1,020 1,057
6 2,042 2,071 2,277 885 916 955
8 1,732 1,768 1,948 826 861 890
2nd-order rateequation
(100 mL k
CFU-1 hr-1) 4.52 × 10⁻⁵ 4.39 × 10⁻⁵ 3.77 × 10⁻⁵ 5.03 × 10⁻⁵ 4.29 × 10⁻⁵ 3.77 × 10⁻⁵
R2 0.9944 0.998 0.9961 0.9949 0.9954 0.9684
Table 7. Time-dependent in concentrations of E. coli, Enterococcus, Tetraselmis suecica, and heterotrophic bacteria with chlorine dioxide at 1 mg/L
Species E. coli
(CFU /100 mL) Enterococcus
(CFU /100 mL) Tetraselmis suecica
(cells /mL) Heterotrophic bacteria (CFU /100 mL)
Time (days)
0 855 637 6,000 178,000
4 368 197 0 3,873
8 96 84 0 1,872
14 116 90 0 1,054
24 52 50 0 873
30 41 51 0 719
36 61 72 0 581
42 82 75 0 560
는 현상이며, 평형수의 경우 30일 이상의 보관은 적절 치 않은 것으로 판단된다. 한편, Tetraselmis suecica은 4일 이후 전혀 발견되지 않았다.
한편, 42일 이후 이산화염소 처리군, 염소 처리군, 대 조군에서의 THM (trichloromethane, dichlorobromo- methane, dibromochloromethane, tribromomethane) 을 분석한 결과를 Table 6에 나타내었다. 이산화염소 실험군의 경우, dichlorobromomethane 만 1.58 µg/L 검출되었으나, 이는 대조군에서도 1.57 µg/L으로 검출 된 물질이었다. 1 mg/L의 이산화염소를 이용한 평형수 처리는 THM 생성을 유발하지 않을 것으로 사료된다.
반면, 동일한 유효 농도의 염소를 사용한 경우 tri- chloromethane 4.55 µg/L, dichlorobromomethane 1.82 µg/L가 검출되어, 이산화염소를 이용한 선박평형수 살 균이 상대적으로 해양 생태계에 미치는 잠재적인 부작 용이 낮은 방안이라는 것을 확인하였다.
4. 결 론
선박평형수를 모사한 인공 해수를 이용한 실험에서 이산화염소가 동일 함량의 유효염소량의 염소에 비하 여 미생물 사멸 효과가 크고 소독 유해부산물 생성량이 적었다. 일반적으로 이산화염소의 생산 단가가 염소보 다 높지만 투입 요구량이 낮고 해양 생태계에 미치는 부 작용이 적다는 측면에서 이산화염소를 이용한 선박평 형수 처리 가 타당할 것으로 판단된다.
References
American Public Health Association (APHA), American Water Works Association (AWWA), and Water Envir- onment Federation (WEF) 1998. Standard Methods for the Examination of Water and Wastewater, 20th Edition.
United Book Press, Inc., Baltimore, MD, USA.
American Society for Testing and Materials (ASTM) 2013. Standard Practice for the Preparation of Substitute Ocean Water, ASTM D1141-98. West Conshohocken, PA, USA.
Benarde, M.A., Snow, W.B., Olivieri, V.P., and Davidson, B. 1967. Kinetics and mechanism of bacterial disinfection by chlorine dioxide. American Society for Microbiology 15(2): 257-265.
Cha, H.-G., Seo, M.-H., Lee, H.-Y., Lee, J.-H., Lee, D.-S., Shin, K.-S., and Choi, K.-H. 2015. Enhancing the efficacy of electrolytic chlorination for ballast water treatment by adding carbon dioxide. Marine Pollution Bulletin 95(1): 315-323.
Creswell, L. 2010. Phytoplankton Culture for Aquaculture Feed. Pub. No. 5004, Southern Regional Aquaculture Center (SRAC), USA.
International Maritime Organization (IMO) 2004. Inter- national Convention for the Control and Management of Ships’ Ballast Water and Sediments. Document BWM/CONF/36, 16 February 2004. IMO, London, UK.
Latarche, M. 2014. Ballast Water Treatment: A Guideline to Regulation and Technology. ShipInsight, Surrey, UK.
Lee, K. and Lee, W. 2015. Effects of pH, water tem- perature and chlorine dosage on the formation of disinfection byproducts at water treatment plant. Journal of Korean Society of Environmental Engineers 37(9):
505-510. (in Korean)
Maranda, L., Cox, A.M., Campbell, R.G., and Smith, D.C.
2013. Chlorine dioxide as a treatment for ballast water to control invasive species: Shipboard testing. Marine Pollution Bulletin 75: 76-89.
Metcalf and Eddy. 2014. Wastewater Engineering Treatment and Reuse, 5th ed., McGraw-Hill, Singapore.
Simon, F.X., Berdalet, E., Gracia, F.A., Espana. F., and Llorens, J. 2014. Seawater disinfection by chlorine dioxide and sodium hypochlorite. A comparison of biofilm formation. Water, Air, & Soil Pollution 225: 1921-1.
Waite, T.D., Kazumi, J., Lane, P.V.Z., Farmer, L.L., Smith, S.G., Smith, S.L., Hitchcock, G., and Capo, T.R.
2003. Removal of natural populations of marine plankton by a large-scale ballast water treatment system. Marine Ecology Progress Series 258: 51-63.
Table 8. Trihalomethane, dichlorobromo methane, dibromochloro methane, tribromomethane concentrations after 42 days treatment of Cl2 and ClO2
Chemicals Trichloro
methane (µg/L) Dichlorobromo
methane (µg/L) Dibromochloro
methane (µg/L) Tribromomethane (µg/L)
Control N.D 1.57 N.D N.D
Cl2 4.55 1.82 N.D N.D
ClO2 N.D 1.58 N.D N.D