- 139 -
Ciliary Activity of Upper Airway Epithelial Cells of Rats with Experimentally Induced Allergic Rhinitis*
Chul Hee Lee, M.D., Ja Bock Yun, M.D., Kang Soo Lee, M.D., Chae-Seo Rhee, M.D. and Yang-Gi Min, M.D.
ABSTRACT
Objectives:The aim of this study was to investigate whether the ciliary activity of respiratory epithelium is affected in allergic rhinitis. Methods:Twenty Wistar rats were divided into an unsensitized control group and sensitized allergic group. The sens- itized group was immunized intraperitoneally with ovalbumin, followed by intranasal administration of ovalbumin. Allergy was determined by an increase in nasal symptoms, the number of tissue eosinophils and a positive result to a passive cutaneous ana- phylaxis (PCA) test. Nasal, nasopharyneal, tracheal, and bronchial epithelial cells were obtained from both the control and allergic groups. Ciliary beat frequency (CBF) was measured using a video-computerized analysis technique in vitro. We compared the CBF of two groups in each site. We also evaluated the findings of the nasal mucosa of both groups with an scanning electron microscope. Results:In vitro CBF measurement demonstrated that the CBF of the control and allergic groups did not differ significantly (p>0.05). Conclusion:CBF is not affected by respiratory allergy.
KEY WORDS:Allergic nasal mucosa·Ciliary beat frequency·Rat·Allergy Model.
INTRODUCTION
While allergic diseases have become increasingly common in modern society, there has been little progress in the devel- opment of treatments.
1)2)It is necessary to have a better un- derstanding of the pathophysiology to develop better treatm- ents. Accordingly, many studies have been conducted, but it is very difficult to repeatedly get the required data with hom- ogeneous conditions in studies on human subjects. Therefore, there have been active attempts to experimentally induce al- lergies in various kinds of animal experiments, and in active studies on the pathophysiology of allergic diseases using ex- perimentally induced allergies.
The ciliary function of nasal mucosa is an essential biol- ogical defense mechanism against foreign bodies entering the airway, and if this mechanism works abnormally, foreign bodies or bacilli could invade to cause a disease like upper
respiratory tract infection. Therefore, the examination of cil- iary function is clinically very important. Some studies have reported that ciliary beat frequency (CBF) shows a statistic- ally significant decrease in allergic rhinitis,
3)but others have reported no change in ciliary beat frequency.
4)The aim of this study was to investigate the changes in CBF in experimentally induced allergic rhinitis in rats.
MATRIALS AND METHODS Induction of allergic rhinitis in rats
Thirty male Wistar rats, healthy in appearance, weighing between 200-250 g were the subjects of the experiment. Al- lergic rhinitis was induced in 10 of the 30 rats, and 10 were used as a control group for comparative observation. The re- maining 10 rats were used for a passive cutaneous anaphylaxis (PCA) test.
For the experimental group (n=10), we dissolved ovalb- umin 10 μg and Al(OH)
3gel 1 mg in normal saline, and did an intraperitoneal injection of 1ml of this solution (0.5 ml of ovalbumin 20 ug/ml and 0.5 ml of Al(OH)
3gel 2 mg/
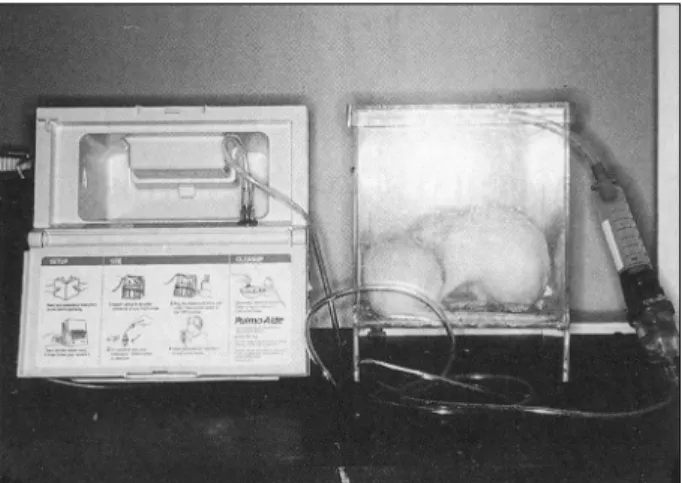
ml) on the 1st, 5th, and 21th day, and for a week from the 28th day, we nebulized 0.1 gm% of ovalbumin in a transparent acryl box for 15 minutes to practice intranasal sensitization, on a daily basis (Fig. 1). As an antigen challenge, 200 μl of ovalbumin solution (5 mg/ml) was instilled intranasally at
*Supported by grant No. 1-93-137 from the Seoul National University Hospital Research Fund.
Department of Otorhinolaryngology-Head and Neck Surgery, Seoul National University, College of Medicine, Seoul, Korea Address Correspondence and reprint requests to Chul Hee Lee, M.D., Department of Otorhinolaryngology, Seoul Natio- nal University, College of Medicine, 28 Yongon-Dong, Chon- gro-Gu, Seoul 110-744, Korea
Tel:82-2-760-2446, Fax:82-2-745-2387 Accepted for publication October 15, 1997
24 hours after last intranasal sensitization, and for 15 minutes afterward, we observed and recorded the symptoms (sneezing and nasal rubbing) (Figs. 1 and 2). For the control group (n=
10), we did the same experiments as we did for the allergic group using the equivalent amount of normal saline only, ins- tead of ovalbumin. Here, we confirmed the expression of al- lergy through assessment of allergic symptoms and a PCA test. In the PCA test, we diluted serum acquired from the experimental group and the control group in normal saline at 1:8, and intradermally injected 0.1 ml of the diluted serum on the shaved back of normal rats. Dividing these rats into two groups, after 4 hours and 7 days respectively, we injected 1 ml of 1% Evans blue solution and 5 mg of ovalbumin into the femoral vein. Then, we examined whether a blue spot ap- peared at the intradermal injection site 30 minutes after the injection.
Measuring ciliary beat frequency in nasal allergy in rats
Having removed the nasal dorsum of the allergic and con- trol groups, we made a vertical incision from periosteum to
both nasal cavities to expose both nasal cavities, and with care not to damage the mucosa, acquired nasal mucosa with a dia- meter of about 1 cm under a microscope from the middle third of the septum. Then, we divided the acquired nasal mucosa into three equivalent portions, and each of them was used, respectively, to measure CBF and for examination under a light and an electron microscope. We also acquired tracheal, nasopharyneal, and main bronchial mucosa in the same way for measuring CBF.
We measured the CBF of nasal mucosa from both the alle- rgic and normal groups. A cluster of epithelial cells was placed in a specially designed sterile culture dish and fixed it using a ring of platinum wire for easier microscopic observation. In order to keep the temperature constant, we used a warming plate and thermoregulator suited for the culture bottle susta- ining the temperature of the bottle at 37℃ during observation.
CBF was measured through at recording with a charged cou- pled device (CCD) camera (Digistar Xomed, Jacksonville, Florida, USA) under an inverted microscope with 1,000 times magnification. We recorded for 15 seconds per cell, then rec- orded 10 sites per sample and got the maximum beat freque- ncies shown in each site and averaged them.
Scanning electron microscopic and light micros- copic findings in experimentally induced allergic rhinitis in rat
We washed the nasal mucosa acquired from allergic and no- rmal group rats in normal saline, then after having fixed them with glutalaldehyde for one day, dehydrated them with alcohol and coated them with palladium gold. We then observed the cilia with a Siemens scanning microscope at 3,000 and 6,000 times magnification. We selected the cilia that lay the most st- raight measured their diameters and lengths using thin wire, and an average value of 10 measurements was taken as diameter and length in the specimen studied. We also examined other findings such as clubbing, compound cilia, ciliary loss, and disorientation.
We fixed the remaining nasal mucosa in 10% formalin fix- ative for 24 hours, then through paraffin embedding, acquired 4 μm sections from 2 spots. One of them was stained with Hematoxylin & Eosin, and the other was stained with Luna stain. In the stained tissue, we observed general findings of epithelium and lamina propria, and the tissue infiltration of eosinophil and also examined the number of eosinophil per view under a light microscope at 400 times magnification, averaging the numbers from 10 views.
Statistic analysis
In order to examine the statistical significance, we calcula-
Fig. 2. Protocol of induction of nasal allergy in rats.
OA:ovalbumin;Sx:symptom
Fig. 1. Photographs of intranasal nebulization of ovalbumin sol- ution in an acryl box by jet type nebulizer for the intranasal se- nsitization.
ted p-value from the results acquired from the control and the experimental group using the Student t-test and Wilcoxon rank sum test and examined its significance of p>0.05.
RESULTS
Change of the frequency of nasal symptoms in rats with experimentally induced allergic rhinitis In the rats from the allergic group into which ovalbumin was intranasally injected, we could observe sneezing and nasal ru- bbing. The result of 15 minutes’ observation showed that the allergic group, compared to the control group, had a high sta- tistical significance (p<0.05) in frequency of both sneezing (2.43±1.90 vs 0.22±1.13) and nasal rubbing (9.57±3.95 vs 2.12±1.74).
PCA test on rats with experimentally induced alle- rgic rhinitis
For the PCA test, 1 ml of ovalbumin mixed with Evans blue was injected intravenously 4 hours and 7 days after the intra- dermal injection of 0.1 ml of serum obtained from the experi- mental group diluted in normal saline at 1:8. Then, in 6 rats we made an intravenous injection, and they showed blue dots on the sites where we injected the serum from the experimental group after 10 minutes of intravenous injections administered after 4 hours and 7 days of the initial serum injection. These sp- ots darkened as time went by (Fig. 3) and those spots where we injected the serum of the control group did not show blue dots.
Light microscopic findings of nasal mucosa in rats with experimentally induced allergic rhinitis
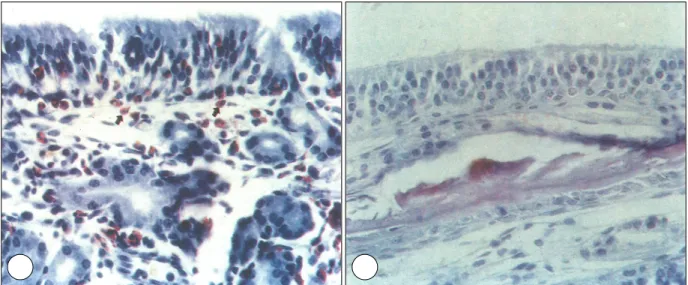
In the findings of Hematoxylin & Eosin stained and Luna stained tissue sections, vessel dilatation findings and edema findings of lamina propria were more frequently observed in the allergic group compared to the control group. There were more goblet cells observed, and in partciular, findings of tissue infiltration of eosinophil were frequently observed, mainly in the basement membrane (Figs. 4 and 5). As we measured the number of eosinophil under a light microscope at 400 times magnification, we observed an average 4.84±2.08 of eosin- ophil per view and this number was, statistically, significantly
Fig. 4. Photomicrograph (×400, H & E stain) showing mild infiltration of eosi- nophil (arrow) in submucous layer and goblet cell hyperplasia (blank arrow).
Fig. 3. Photographs of passive cutaneous anaphylaxis (PCA) reaction showing blue spot on the site intradermally injected with diluted serum from allergy rat model.
high (p<0.05) compared to that of the 0.90±0.55 shown in the control group. It was particularly easier to distinguish eo- sinophil in a Luna stain that only stains eosinophil red (Fig. 5).
CBF of airway mucosa in rats with experimentally induced allergic rhinitis
CBF was measured in nasal, tracheal, nasopharyneal, and main bronchial mucosa acquired from the allergic group and the normal group. The CBF of the allergic group turned out to
be 11.20-12.83 Hz, and was no statistical significance (p>
0.05) when compared to the 12.24-13.12 Hz of the normal control group (Table 1).
Scanning electron microscopic findings of nasal mucosa in rats with experimentally-induced aller- gic rhinitis
We measured the length and diameter of cilia in the nasal
Table 2. Scanning electron microscopic features of allergy and control group in nasal epithelia in rats
Findings Allergy Control p-value
Length of cilia (μm) 3.67±0.74 4.17±0.25 NS Diameter of cilia (μm) 0.20±0.06 0.18±0.05 NS Clubbing cilia not observed not observed
Compound cilia not observed not observed Ciliary loss not observed not observed Disorientation not observed not observed NS:not significant
Table 1. The ciliary beat frequencies of allergy and control gr- oup in rats
Site Allergy (n=10) mean±SD
Control (n=10)
mean±SD p-value Nasal cavity 11.10±3.12 10.90±2.11 p>0.05 High trachea 11.04±0.75 11.07±0.86 p>0.05 Main bronchus 10.88±1.17 9.70±0.33 p>0.05 Nasopharynx 11.66±0.33 11.98±0.96 p>0.05
Fig. 5. Photomicrograph (×400, Luna stain) of the nasal mucosa in allergy group (A) and control group (B). There are prominent inf- iltration of eosinophil (arrow) in submucous layer in allergy group (A).
Fig. 6. Scanning electron micrograph (×6000) of the nasal mucosa in allergy group (A) and control group (B). Cilias of nasal mucosa are intact without clubbing, ciliary loss and disorientation in both group.
A A A
A B B B B
A A A
A B B B B
mucosa of the experimental and the normal group, but there was no statistical significance found (Table 2). Neither ciliary atrophy, ciliary loss, ciliary shortening, ciliary clubbing, nor compound cilia finding was observed (Fig. 6).
DISCUSSION
Since 1967 when Ishizaka et al. first discovered that IgE induces allergic reactions, there have been active attempts to experimentally induce allergies in various kinds of experim- ental animals including guinea pigs.
5)This was because it was very difficult to repeatedly get required materials and have ho- mogeneous conditions for studies with human subjects. Thus, allergic models were developed in various animals such as mice, rats, guinea pigs, etc., and they were used for the study of the pathophysiology of allergy and for the development of the treatment of allergy.
6-8)However, it is said that in inducing allergic rhinitis in animals, they don’t express allergic reac- tions unless they are treated with much care as they are very sensitive to stress. Indeed, Ovary
9)reported that allergic reac- tions failed to express or decreased under stressful circumsta- nces. In this study, we therefore held the rat with care under quiet circumstances without noise to spare it from stress, while performing intraperitoneal injection and intranasal instillation.
As a result, we observed higher frequencies of nasal symptoms with statistical significance compared to those of the control group, and could suppose the formation of allergic reactions by ovalbumin in rats. In our study, relatively lower frequencies of sneezing and nasal rubbing were observed in comparison with other studies and in particular, sneezing was rarely obs- erved in the control group, which, we assume, implied that we intranasally instilled too small an amount of ovalbumin, or that the amount of ovalbumin that actually went into the nasal ca- vity was smaller than what we used, and we conjectured that this problem could be worked out by improving the method of intranasal instillation by using a micropipette or through the use of other antigen challenge methods.
Allergic reactions were examined by a passive cutaneous anaphylaxis (PCA) test which works as follows. Intradermally injected antibody sticks on mast cell membrane, and reacts with an allergen that is introduced later through an intravenous injection to raise the allergy. Then, when the mast cell degra- nulates with the allergy, vessel permeability increases due to vasoactive mediators releasing from it and blue dye within veins infiltrate out of the veins to make blue dots.
9)If a blue dot with a diameter bigger than 5 mm is observed, it is reg- arded as a positive reaction. In general, it could be judged as allergy positive, when the serum of the experimental group shows a positive reaction in the titer over 1:8.
10)In this study,
we acquired equivalent results from the entire experimental group, so we could confirm the existence of an allergic rea- ction.
We can observe tissue infiltration of eosinophil in allergic rhinitis patients. Here, it is appears that, after nasal mucosa has been exposed to allergen, eosinophil moves from the inside to the outside of the vessel and moves through the epithelium toward internal nasal discharge,
5)and in our study, findings of an increase of eosinophil with a statistical significance were also observed in all airway mucosa more frequently in the al- lergic group than in the control group.
Scanning electron microscopic findings in the measuring of the lengths and diameters of cilia acquired from nasal mucosa, airway and main bronchial showed no statistical significance between the allergic and the normal group. Neither ciliary at- rophy nor ciliary loss, nor ciliary shortening, ciliary clubbing nor compound cilia finding were observed. These findings more or less conflict with those of other studies that report nasal epithelial damage in allergy patients.
11)Part of the reas- ons for this conflict, we assume, is that because the time period spent for the sensitization of allergen in our study was 5 weeks, which is relatively shorter than the 3 months spent in other studies, the nasal epithelium was less damaged.
Over the past 20 years, various methods have been tried in the effort to measure CBF more accurately. Some have used photoelectric signal or laser, and Kennedy et al.
12)introduced the fast Fourier transformation analysis method. The problems with these methods, i.e. the difficulty of measuring CBF of multiple cells and the difficulty of measuring the CBF of a single cell, were solved with the introduction of video recor- ding equipment, the method used in this study, which was to observe the ciliary beat of a single cell, then to get CBF using a computer program. This method was able to provide more objective and quantitative data compared to other ones.
13)Us- ually, based on the data acquired from video images taken under a inverting microscope at 1000 times magnification, one can calculate the change in the brightness of each pixel in the images and thereby measure CBF.
Resently, there have been conflicting reports on the CBF
change in allergic rhinitis. Ohashi et al. reports that CBF in
allergy patients considerably decreases in comparison with
the control group.
3)On the other hand, the results of another
study have shown that there is no change between them.
4)In
this study, neither a decrease nor increase was observed. The-
refore, we supposed that there is little correlation between
CBF and the degree of allergy. Because a change in the ciliary
beat frequency appears following pathologic or histologic fi-
ndings, we might assume the existence of damage in the epit-
helial mucosa from a change of the ciliary beat frequency.
14)In our study, as scanning electron microscopic findings in the experimental group turned out normal, we supposed that a no- rmal CBF would be the result of it.
These observations do not necessarily mean that CBF is no- rmal in allergic rhinitis in vivo. It is possible that CBF is inh- ibited due to presence of mucuous secretion and inflammatory mediators in vivo. However, the CBF may be restored to normal because these mucuous secretion or mediators washed away as in this in vitro study.
A comparison of CBFs from random different locations both in the control and allergic groups showed statistically insign- ificant values in the mean and standard deviation. So we me- asured CBF in a way to get the value of maximum frequencies in ten different sites.
In human subjects with chronic nasal allergy, the number of ciliated cell is diminished and the structure of ciliated cell is affected. Pathologic ciliated cells display a reduce CBF. And the nasal CBF of patients of nasal allergy is reduced as the morbid period is prolonged.
3)So it is possible that reduced CBF is resulted if duration of the anti-gen exposure is prol- onged in this study.
It is suggested that CBF change may be resulted from the chronicity of allergy rather than the presence of allergy.
CONCLUSION
In this study, we confirm the ovalbumin-induced allergic rhinitis in rats, by observing changes of nasal symptoms, with positive PCA test results, and with the increase in the number of eosinophil in the findings of stained sections of nasal muc- osa tissue. From the CBF measured in the experimental group, we failed to show any deviation of significance in all the va- rious airway mucosa when compared to the normal control group, and under a scanning electron microscope, we observed undamaged cilia just as healthy as those of the control group.
REFERENCES
1) Del Prete GF, Maggie E, Parronchi P, et al. IL-4 is an essential factor for IgE synthesis induced in vitro by human T cell clones and their supernatants. J Immunol 1988;140:4193-8.
2) Pene J, Rousset F, Briere F, et al. IgE production by normal hu- man B cells induced by alloactive T cell clones is mediated by IL- 4 and suppressed by IFN-γ. J Immunol 1988;141:1218-4.
3) Ohashi Y, Nakai Y, Ikeoka H, et al. Increased ciliary beating freq- uency of nasal mucosa following immunotherapy for allergy. Ann Otol Laryngol 1989;98:350-4.
4) Maurer DR, Sielczak M, Oliver W, et al. Role of ciliary motility in acute allergic mucociliary dysfunction. J Appl Physiol 1982;52 (4):1018-23.
5) Mygind N. Nasal allergy. 2nd Ed. Oxford: Blackwell Scientific Publications, 1979.
6) Mota I. Biological characterization of mouse early antibodies. Im- munol 1967;12:343-9.
7) Binaghi RA, Benacerraf B. The production of anaphylactic anti- body in the rat. J Immunol 1964;92:920-6.
8) Sakakura S, Majima Y, Sakakura Y. Nasal mast cells in experim- entally induced allergic rhinitis in guinea pig. Clin Exp Allergy 1994;24:238-44.
9) Ovary Z. Passive cutaneous anaphylaxis. In: Ackroyd JF. ed. Im- munological method. Oxford: Blackwell Scientific Publications, 1964:p.259-83.
10) Cain WA, Lerner M, Wells JH. Immunization of guinea pigs to produce heatlabile homocytotropic antibody. J Allergy Clin Imm- unol 1983;71:116-21.
11) Hong SK, Jeon SY, Hwang EG, et al. Experimental induced nasal allergy in guinea pigs: development of nasal allergy model and the histopathology. Korean J Otolaryngol 1995;38(3):359-73.
12) Kennedy DW, Duckett K. The study of ciliary frequencies with an optical spectrum analysis system. Exp Cell Res 1981;135:147-56.
13) Min YG, Sung MH, Rhee CS, et al. The effects of phenylephrine on ciliary beat in human respiratory epithelium: quantitative mea- surement by a video-computerized analysis technique. Laryngos- cope 1997. in press.
14) Sakakura Y, Ukai K, Itoh H, et al. Cilia injury during virus infec- tion in chickens. Rhinology 1985;23:283-90.