www.cmj.ac.kr
Factors Affecting the Accuracy of Intraocular Lens Power Calculation with Lenstar
Tae Hee Lee, Mi Sun Sung, Lian Cui, Ying Li and Kyung Chul Yoon*
Department of Ophthalmology, Chonnam National University Medical School and Hospital, Gwangju, Korea
This retrospective study was performed to compare refractive outcomes measured by conventional methods and by use of the Lenstar biometer and to investigate the factors affecting intraocular lens (IOL) power calculation with Lenstar with and without IOL-constant optimization. The study included 100 eyes of 86 patients who underwent cataract surgery. Corneal curvature was measured with a manual keratometer (MK), automated keratometer (AK), and the Lenstar biometer, and axial length (AL) was measured by A-scan and Lenstar. Mean numerical error (MNE) and mean absolute error (MAE) were compared between AK and MK with A-scan, and Lenstar with and without optimization. Factors affecting the accuracy of the IOL power calculation by use of Lenstar with and without optimization were analyzed. No significant differences were observed in the MNE or MAE among the devices. The proportion of MAE within 0.5 D was higher for Lenstar with optimization (62.7%) than without optimization (46.2%). The proportion of MAE within 0.5 D was 62% and 58% for MK and AK with A-scan, respectively. Without optimization, the MAE was smaller in eyes with ALs be- tween 23 mm and 25 mm (p=0.03), whereas it was smaller at higher corneal powers when the IOL constant was optimized (>44 D, p=0.03). The IOL power calculations showed no significant differences among the devices, but the results of MAE within 0.5 D by use of Lenstar without optimization were worse than those of conventional methods. The AL influenced the accuracy of refractive outcomes determined by using Lenstar without optimization, and corneal curvature was shown to affect the accuracy of refractive measurements using Lenstar with optimization.
Key Words: Axial length; Corneal topography; Lenses, Intraocular
This is an Open Access article distributed under the terms of the Creative Commons Attribution Non-Commercial License (http://creativecommons.org/licenses/by-nc/4.0) which permits unrestricted non-commercial use, distribution, and reproduction in any medium, provided the original work is properly cited.
Article History:
received 20 May, 2015 revised 29 June, 2015 accepted 8 July, 2015
Corresponding Author:
Kyung Chul Yoon
Department of Ophthalmology, Chonnam National University Medical School and Hospital, 42, Jebong-ro, Gwangju 501-757, Korea TEL: +82-62-220-6741 FAX: +82-62-227-1642 E-mail: [email protected]
INTRODUCTION
Currently, two instruments are used to assess intra- ocular lens (IOL) power: the ultrasound (US) A-scan and optical biometry based on partial coherence interferome- try (PCI). Ultrasound scan biometry has been the gold standard for a long time. Some authors have shown better refractive predictability with PCI than with contact US,1-5 whereas others have shown comparable results between PCI and immersion US.6,7 The Lenstar (Haag-Streit AG, Koeniz, Switzerland) and IOLMaster (Carl Zeiss, Jena, Germany) biometers have been used to make accurate bio- metry measurements for choosing IOL power on the basis of predicted postoperative refractive outcomes. Lenstar is
a noncontact instrument that uses optical low-coherence reflectometry. Previous studies have reported the accuracy and repeatability of ocular biometry by use of the Lenstar biometer.8,9 In addition, ocular biometry measurements by use of the Lenstar instrument show a high degree of con- sistency with measurements made by use of the PCI-based IOLMaster biometer and A-scan.8
The manufacturer’s recommended A-constants are based on US measurements and thus may not be directly trans- ferable to measurements obtained by using light-based PCI. Previous studies have proven that optimization pro- duces more favorable outcomes for predicting refraction with the use of PCI after cataract surgeries.10-12 However, no study has been published on the benefits of optimization
TABLE 1. Biometry measurements by manual keratometer, auto- mated keratometer Lenstar, and A-scan
MK AK Lenstar A-scan
AL (mm) - - 23.37±1.13* 23.20±1.13
K (D) 43.98±1.49 43.92±1.49 43.86±1.49 - AL: axial length, K: keratometry, MK: manual keratometer, AK: automated keratometer.
Data are expressed as the mean±standard deviation.
*p<0.05.
of the IOL constant and the factors related to the accuracy of IOL power calculation by use of the Lenstar biometer.
The purpose of this study was to evaluate and compare refractive outcomes obtained by conventional methods (manual and automated keratometer with contact US) and by use of the Lenstar biometer with and without IOL-con- stant optimization. Factors affecting the accuracy of IOL power calculations by Lenstar with and without IOL-con- stant optimization were also investigated.
MATERIALS AND METHODS
Study subjects included a total of 86 patients (100 eyes) who underwent uncomplicated phacoemulsification sur- gery with in-the-bag IOL implantation in the Department of Ophthalmology, Chonnam National University Hospital, between May 2013 and October 2013. Informed consent was obtained from each subject enrolled in this study. The Chonnam National University Hospital Institutional Review Board reviewed and approved the study protocol. All study conduct adhered to the tenets of the Declaration of Hel- sinki.
1. Patient assessments and surgeries
Before surgery, the patients underwent assessments of uncorrected visual acuity and best corrected visual acuity, manifest refraction and slit-lamp examination, intraocular pressure measurement with Goldmann applanation ton- ometry, and dilated fundus examination. Corneal curva- ture was measured by using Lenstar (Haag-Streit AG), an automated keratometer (KR 8900Ⓡ; Topcon, Tokyo, Japan), and a manual keratometer (Bausch & Lomb, Rochester, NY, USA). Axial length (AL) was also measured with Len- star and A-scan (MentorⓇ; Mentor O & O Inc., Norwell, MA, USA). The measurements of AL and corneal curvature were made by one experienced examiner. The average time of ex- amination with the Lenstar was 1 or 2 minutes in all pati- ents. Patients with posterior capsular opacification, ma- ture cataracts, previous ocular surgery other than cataract surgery, intraoperative complications, postoperative visu- al acuity less than 6/12, or poor cooperation were excluded from this study.
The surgeries were performed with the use of topical an- esthesia by one surgeon. A temporal corneal incision, con- tinuous curvilinear capsulorrhexis, hydrodissection, and phacoemulsification with the Infinity machine (Alcon, Fort Worth, TX, USA) were performed to remove the cataract.
A foldable posterior chamber IOL was implanted in the cap- sular bag. The IOLs used in the study were one-piece acrylic IOLs (SN60WF; Alcon). All of the surgeries were sutureless.
Manifest refraction, uncorrected visual acuity, best corrected visual acuity, and intraocular pressure were assessed four times postoperatively: at 1 week, 2 weeks, 1 month, and 2 months after the surgery.
2. Power calculations
IOL power calculations were obtained by measurements
with (1) automated keratometer and A-scan (AK + A), (2) manual keratometer and A-scan (MK + A), (3) Lenstar without IOL-constant optimization (LW/OO), and (4) Lenstar with IOL-constant optimization (LWO). The IOL power calculation with Lenstar was performed by using the soft- ware program installed on the device. The target was em- metropia using the SRK/T formula (recommended and pre- viously optimized ultrasound A-constant, 118.7; Lenstar optimized A-constant, 119.02). The optimized IOL con- stant was obtained from East Valley Ophthalmology (Mesa, AZ, USA; www.doctor-hill.com). The final refraction [spherical equivalent (SE)] was measured by using an au- torefractometer (KR 8900Ⓡ; Topcon) at 2 months postope- ratively. Mean absolute error (MAE) was defined as the average absolute value of the numerical error (ie, the final postoperative SE minus the predicted postoperative SE).
Accuracy was analyzed by comparing the mean numerical errors (MNEs) and MAEs among devices. The distribution and proportion of MAEs within 0.5 to 2.0 D were investi- gated.
Factors related to the accuracy of IOL power calculation included severity of nuclear sclerosis, corneal curvature, spherical equivalent, and AL before cataract surgery; the statistical significance of these factors on MAEs was inves- tigated. Severity of nucleosclerosis was determined by us- ing the lens opacities classification system (LOCS) III clas- sification (mild: ≤NO2/NC2, moderate: >NO2/NC2 and
≤NO4/NC4, and severe: >NO4/NC4). The ALs were cate- gorized into three groups: shorter than 23 mm, 23 to 25 mm, and longer than 25 mm. Corneal curvature was also catego- rized into three groups: smaller than 42 D, 42 to 44 D, and larger than 44 D.13
3. Statistical analysis
SPSS version 18.0 for Windows (SPSS Inc., Chicago, USA) and MedCalc (MedCalc, Mariakerke, Belgium) were used. The paired t-test was used to compare ALs between two instruments. Corneal curvature measurements were compared among the three instruments by using analysis of variance (ANOVA). Bland-Altman plots were used to as- sess the level of agreement (LoA; width of the 95% limits of agreement). The Kruskal-Wallis test was used to test the difference among instruments for MNE and MAE. The Student’s t-test and Kruskal-Wallis test were used to ana- lyze the factors affecting MAE. A p value<0.05 was consid-
FIG. 2. Bland-Altman plot of the axial length between Lenstar and A-scan (95% limits of agreement for axial length differ- ence: Lenstar - A-scan, –0.53 to 0.19).
ered statistically significant.
RESULTS
The patients’ mean age was 67.62±10.64 years. There were 46 women and 40 men. Corneal curvatures measured by MK, AK, and Lenstar were 43.98±1.49 D, 43.92±1.49 D, and 43.86±1.49 D, respectively (Table 1). No statistically significant difference was found in the corneal curvatures obtained by using the three instruments (p=0.85). The measurements of AL obtained by using Lenstar were sig- nificantly higher than those obtained by using A-scan (23.37±1.13 mm versus 23.20±1.13 mm; p<0.01). However, Bland-Altman plots of keratometry and AL data revealed excellent agreement between instruments with a 95% LoA (Figs. 1 and 2).
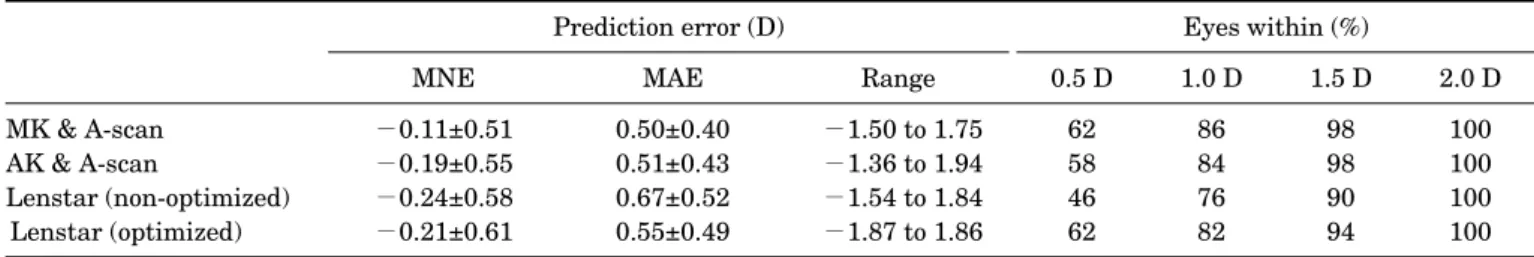
The MNEs were −0.11±0.51, −0.19±0.55, −0.24±0.58, and −0.21±0.61 for MK + A, AK + A, LW/OO, and LWO, respectively. There were no significant differences in MNE between the methods used for IOL power calculation (p=
0.13). The MAEs were 0.50±0.40, 0.51±0.43, 0.67±0.52, and 0.55±0.49 for MK + A, AK + A, LW/OO, and LWO, respecti- vely. The MAE also did not differ significantly (p=0.11). The proportions of MAE within 0.5 D were 62%, 58%, 46%, and 62% for MK + A, AK + A, LW/OO, and LWO, respectively.
The respective ratios of MAE within 1.0 D were 86%, 84%,
76%, and 82% (Table 2).
In the analysis of the factors affecting the IOL power cal- culation by use of Lenstar with and without IOL-constant optimization, severity of nucleosclerosis and preoperative spherical equivalent did not affect the MAE. Without IOL- constant optimization, the MAE was significantly smaller in eyes with ALs between 23 and 25 mm than in eyes with FIG. 1. Bland-Altman plots of keratometry using (A) Lenstar and an automated keratometer, (B) Lenstar and a manual keratometer, and (C) automated keratometer and manual keratometer (95% limits of agreement for keratometry dif- ference: Lenstar - automated keratometer, –0.84 to 0.71;
Lenstar - manual keratometer, –1.14 to 0.90; automated keratometer - manual keratometer, –1.18 to 1.07).
TABLE 2. Comparison of prediction error between A-scan with automated keratometer and manual keratometer, and Lenstar
Prediction error (D) Eyes within (%)
MNE MAE Range 0.5 D 1.0 D 1.5 D 2.0 D
MK & A-scan −0.11±0.51 0.50±0.40 −1.50 to 1.75 62 86 98 100
AK & A-scan −0.19±0.55 0.51±0.43 −1.36 to 1.94 58 84 98 100
Lenstar (non-optimized) −0.24±0.58 0.67±0.52 −1.54 to 1.84 46 76 90 100
Lenstar (optimized) −0.21±0.61 0.55±0.49 −1.87 to 1.86 62 82 94 100
MK: manual keratometer, AK: automated keratometer, MNE: mean numerical error, MAE: mean absolute error.
Data are expressed as the mean±standard deviation.
TABLE 3. Factors that influence IOL power calculation by Lenstar (non-optimized IOL-constant)
Factors Number MAE (D) p value
Nucleosclerosis Mild 26 0.68 0.32
Moderate 46 0.58
Severe 28 0.79
Corneal curvature (D) <42 21 0.83 0.31
42-44 40 0.68
>44 39 0.62
Preoperative SE (D) <−2 12 0.58 0.66
−2 to 2 66 0.70
≥2 22 0.62
Axial length (mm) <23 30 0.80 0.03*
23-25 51 0.59
≥25 19 0.72
Mild: ≤NO2/NC2, Moderate: >NO2/NC2 and ≤NO4/NC4, and Severe: >NO4/NC4, IOL: intraocular lens, MAE: mean absolute error, SE: spherical equivalent.
*p<0.05.
TABLE 4. Factors that influence IOL power calculation by Lenstar (optimized IOL-constant)
Factors Number MAE (D) p value
Nucleosclerosis Mild 26 0.48 0.48
Moderate 46 0.56
Severe 28 0.58
Corneal curvature (D) <42 21 0.60 0.03*
42-44 40 0.68
>44 39 0.39
Preoperative SE (D) <−2 12 0.36 0.28
−2 to 2 66 0.60
≥2 22 0.47
Axial length (mm) <23 30 0.56 0.93
23-25 51 0.54
≥25 19 0.51
Mild: ≤NO2/NC2, Moderate: >NO2/NC2 and ≤NO4/NC4, and Severe: >NO4/NC4, IOL: intraocular lens, MAE: mean absolute error, SE: spherical equivalent.
*p<0.05.
an AL shorter than 23 mm or longer than 25 mm (p=0.03;
Table 3). With IOL-constant optimization, the MAE was significantly smaller in the eyes with corneal curvature greater than 44 D (p=0.03; Table 4). In contrast, the MAE was larger when the corneal curvature was less than 44 D.
DISCUSSION
In cases involving cataract surgery, preoperative IOL power calculations are indispensable for reaching the de- sired postoperative goal. An error of 0.1 mm in AL measure- ment can lead to MAE values of 0.25 D to 0.75 D. An error of 0.5 D in the keratometric reading also can lead to a re- fractive error of ±1.17 D.14 In this study, we found a high degree of consistency between corneal curvature and ALs measured by Lenstar and measurements made by other instruments. The previous study also demonstrated that ocular biometric findings obtained by using A-scan, IOL Master, and Lenstar were highly comparable.9 However, another study reported that the AL values in eyes with cat- aracts were significantly longer when measured by Lenstar than when measured by A-scan.15 Our study also showed that ALs obtained by using Lenstar were 0.17 mm higher
than ALs measured by use of A-scan. There are two reasons for this finding. First, AL is measured by the noncontact method with the Lenstar biometer. Second, AL is measured at the level of the retinal pigment epithelium and not the internal limiting membrane.
Constant optimization is the process by which the IOL constant is adjusted to minimize systematic errors.16 The process of constant optimization has little effect on the dis- tribution of outcomes around the mean,16 but maximizes the proportion of eyes within a particular target range and minimizes the MAE. IOL constant optimization has been shown to significantly improve prediction accuracy for con- tact US (from 79.7% to 82.5% within ±1.0 D),17 immersion US (from 60.0% to 65.0% within ±0.5 D),11 and optical bio- metry (from 76-89% to 92-94% within ±1.0 D, dependent upon IOL model and formula).12 The previous study re- ported that serial modifications to the A-constant were suc- cessful in reducing the unexpected errors.10 Other studies found significant improvement in IOL power prediction and refractive outcomes when using IOLMaster with opti- mized A-constants, generating refractive errors of <0.25 D in 40%, <0.50 D in 75%, and <1.0 D in 95% of eyes.18 However, no study has reported differences in refractive
outcomes by use of Lenstar with and without IOL-constant optimization. Furthermore, this is first report that has an- alyzed the factors related to the accuracy of IOL power cal- culation with the use of the Lenstar biometer.
We evaluated MNE and MAE with and without IOL-con- stant optimization by use of the Lenstar biometer. The MNE and MAE were also compared with values based on the refractive power obtained by MK + A and AK + A. The MNE and MAE did not differ significantly between groups.
We found that the IOL power calculations had no signifi- cant differences among the devices. However, measurement accuracy is better characterized by the proportion of eyes under the refractive value limits of 0.5 D and 1.0 D. The ra- tios of MAE within 0.5 D and 1.0 D using LWO (62% and 82%) were superior to those using LW/OO (46% and 76%).
Furthermore, the results of MAE within 0.5 D or 1.0 D using LW/OO were worse than those of conventional methods.
Previous studies have shown various effects of AL, kera- tometry, and the severity of cataract on the precision of IOL power calculations with IOLMaster.19-21 Ueda et al.19 re- ported that postoperative outcome was affected by cataract density using IOLMaster. Hsieh and Wang,13 however, re- ported that many factors, including age, AL, keratometry, severity of cataract, and DM status exerted no effects on IOL power predictability regardless of the IOL power calcu- lation method using IOLMaster or A-scan. In the present study, we investigated preoperative factors that affected the accuracy of IOL power calculation with and without IOL-constant optimization with the use of Lenstar. We found that various factors, including the severity of nuclear sclerosis and preoperative spherical equivalent, had insig- nificant effects on MAE regardless of IOL-constant optimization. However, before IOL-constant optimization, AL had a significant effect only when it was either longer than 25 mm or shorter than 23 mm. Häsemeyer et al.21 re- ported that the difference in refractive error using IOLMaster was significantly larger in eyes with an AL shorter than or equal to 23.2 mm than in eyes with an AL longer than 23.2mm. Kim et al.22 also demonstrated that eyes with an AL ≤23 mm showed significantly greater hy- peropic shifts in postoperative refraction. However, Song et al.3 reported that the MAE increased in eyes with an AL longer than 25 mm. The previous study reported a trend that the MAE was smaller in the group with keratometric readings less than 42 D when autorefractometer, ultra- sound, and IOLMaster were used, but not significantly.13 In the present study, after IOL-constant optimization, on the other hand, corneal curvature led to significant differ- ences in MAE (>44 D; p=0.03). Additional studies of the different factors affecting IOL power calculation using Lenstar according to IOL constant optimization will be needed in the future.
The present study had several limitations. First, our study had a retrospective design involving a relatively small number of patients. Second, the follow-up period was short. Third, we did not compare our results with rotating Scheimpflug imaging, scanning slit corneal topography,
and IOLMaster, which have been broadly used for IOL- power calculation. Fourth, we did not compare various IOL- power calculation formulas.
In conclusion, Lenstar with IOL-constant optimization improved the prediction of refractive power compared with Lenstar without IOL-constant optimization after cataract surgery. The refractive outcomes of the conventional meth- od were as accurate as Lenstar with IOL-constant opti- mization. However, the results of MAE within 0.5 or 1.0 D using Lenstar without optimization were worse than those of conventional methods. The AL can influence the accu- racy of refractive outcomes determined by using Lenstar without IOL-constant optimization; whereas, with IOL- constant optimization, significant differences depend on corneal curvature. Therefore, our results suggest that these factors should be taken into consideration before cataract surgery.
CONFLICT OF INTEREST STATEMENT None declared.
REFERENCES
1. Connors R 3rd, Boseman P 3rd, Olson RJ. Accuracy and reprodu- cibility of biometry using partial coherence interferometry. J Cataract Refract Surg 2002;28:235-8.
2. Rajan MS, Keilhorn I, Bell JA. Partial coherence laser inter- ferometry vs conventional ultrasound biometry in intraocular lens power calculations. Eye (Lond) 2002;16:552-6.
3. Song BY, Yang KJ, Yoon KC. Accuracy of partial coherence inter- ferometry in intraocular lens power calculation. J Korean Oph- thalmol Soc 2005;46:775-80.
4. Findl O, Drexler W, Menapace R, Heinzl H, Hitzenberger CK, Fercher AF. Improved prediction of intraocular lens power using partial coherence interferometry. J Cataract Refract Surg 2001;
27:861-7.
5. Eleftheriadis H. IOLMaster biometry: refractive results of 100 consecutive cases. Br J Ophthalmol 2003;87:960-3.
6. Haigis W, Lege B, Miller N, Schneider B. Comparison of immer- sion ultrasound biometry and partial coherence interferometry for intraocular lens calculation according to Haigis. Graefes Arch Clin Exp Ophthalmol 2000;238:765-73.
7. Kiss B, Findl O, Menapace R, Wirtitsch M, Petternel V, Drexler W, et al. Refractive outcome of cataract surgery using partial co- herence interferometry and ultrasound biometry: clinical feasi- bility study of a commercial prototype II. J Cataract Refract Surg 2002;28:230-4.
8. Buckhurst PJ, Wolffsohn JS, Shah S, Naroo SA, Davies LN, Berrow EJ. A new optical low coherence reflectometry device for ocular biometry in cataract patients. Br J Ophthalmol 2009;93:
949-53.
9. Jasvinder S, Khang TF, Sarinder KK, Loo VP, Subrayan V.
Agreement analysis of LENSTAR with other techniques of bio- metry. Eye (Lond) 2011;25:717-24.
10. Madge SN, Khong CH, Lamont M, Bansal A, Antcliff RJ. Optimiz- ation of biometry for intraocular lens implantation using the Zeiss
IOLMaster. Acta Ophthalmol Scand 2005;83:436-8.
11. Nemeth G, Nagy A, Berta A, Modis L Jr. Comparison of intra- ocular lens power prediction using immersion ultrasound and op- tical biometry with and without formula optimization. Graefes Arch Clin Exp Ophthalmol 2012;250:1321-5.
12. Aristodemou P, Knox Cartwright NE, Sparrow JM, Johnston RL.
Intraocular lens formula constant optimization and partial coher- ence interferometry biometry: Refractive outcomes in 8108 eyes after cataract surgery. J Cataract Refract Surg 2011;37:50-62.
13. Hsieh YT, Wang IJ. Intraocular lens power measured by partial coherence interferometry. Optom Vis Sci 2012;89:1697-701.
14. Jo DH, Oh JY, Kim MK, Lee JH, Wee WR. Corneal power estima- tion using orbscan II videokeratography in eyes with previous cor- neal refractive surgeries. J Korean Ophthalmol Soc 2009;50:1730-4.
15. Tappeiner C, Rohrer K, Frueh BE, Waelti R, Goldblum D. Clinical comparison of biometry using the non-contact optical low coher- ence reflectometer (Lenstar LS 900) and contact ultrasound bio- meter (Tomey AL-3000) in cataract eyes. Br J Ophthalmol 2010;
94:666-7.
16. Olsen T. Prediction of the effective postoperative (intraocular lens) anterior chamber depth. J Cataract Refract Surg 2006;32:
419-24.
17. Gale RP, Saldana M, Johnston RL, Zuberbuhler B, McKibbin M.
Benchmark standards for refractive outcomes after NHS cataract surgery. Eye (Lond) 2009;23:149-52.
18. Aristodemou P, Knox Cartwright NE, Sparrow JM, Johnston RL.
Formula choice: Hoffer Q, Holladay 1, or SRK/T and refractive outcomes in 8108 eyes after cataract surgery with biometry by partial coherence interferometry. J Cataract Refract Surg 2011;
37:63-71.
19. Ueda T, Ikeda H, Ota T, Matsuura T, Hara Y. Relationship between postoperative refractive outcomes and cataract density: multiple regression analysis. J Cataract Refract Surg 2010;36:806-9.
20. Prinz A, Neumayer T, Buehl W, Kiss B, Sacu S, Drexler W, et al.
Influence of severity of nuclear cataract on optical biometry. J Cataract Refract Surg 2006;32:1161-5.
21. Häsemeyer S, Hugger P, Jonas JB. Preoperative biometry of cata- ractous eyes using partial coherence laser interferometry.
Graefes Arch Clin Exp Ophthalmol 2003;241:251-2.
22. Kim SM, Choi J, Choi S. Refractive predictability of partial coher- ence interferometry and factors that can affect it. Korean J Oph- thalmol 2009;23:6-12.