2)
Introduction
The kidney performs two major functions: First, it participates in the maintenance of a relatively constant extracellular environment that is required for adequate cellular function. This is achieved by the excretion of waste products of metabolism and of water and electrolytes that are derived from dietary intake.
Second, it secretes hormones that participate in the
Received March 9, 2007. Accepted May 8, 2007.
Correspondence author : Sung Kyew Kang, M.D.,
Department of Internal Medicine, Chonbuk National University Hospital, 634-18 Keumam-dong, Dukjin-gu, Jeonju, Jeonbuk 561-712, Korea
Tel :+ 82-63-250-1677 Fax : +82-63-254-1609 E-mail : [email protected]
regulation of systemic and renal hemodynamics, red cell production, and mineral metabolism1).
The cellular environment is maintained by ion pump in the cellular membrane. For example, the sodium is unable to diffuse freely across the cell membrane.
Thus, transmembrane transporter or channels are required for sodium reabsorption to take place.
Renal function is controlled and influenced by cultural factors such as living environment, and dietary habits.
Because of special living environment and dietary habits, the Korean s’ “normal” renal function was different from the western people in the 1960 s’ 2). About 40 years ago, Hong et al.2)reported that in Koreans, two thirds of the urine osmolality is contributed by
Changes in Urine Osmolar Composition seen in Different Age Groups in the Local Korean Population
Kyoung Hoon Lee, M.D.1, Kyung Pyo Kang, M.D.1, Min Sun Kim, M.D.2 Dae Yul Lee, M.D.2, and Sung Kyew Kang, M.D.1
Departments of1Internal Medicine and 2Pediatrics, Research Institute of Clinical Medicine Chonbuk National University Medical School, Jeonju, Korea
Due to their unique living conditions and dietary habits, the Koreans renal function model may be’ different from that of the Western people. About 40 years ago, a researcher reported that two thirds of the urine osmolality in Koreans was contributed by NaCl, while less than 1/3 by urea. It is known that the Koreans daily consumption of NaCl is higher while their protein intake is lower, compared to’ that of the Westerners. Now-a-days, the Korean's dietary habit is changing to a westernized life style. In this study, we investigated whether there were changes in urine composition and osmolality according to age. The subject of study were 215 Koreans (128 male, 142 female, age 7-68 years) living in the Chonbuk and Chonnam province in Korea. We performed routine physical examinations and analyses of the urine Na+, K+, Cl-, urea, NH3, creatinine, and osmolality on their 24 hour urine samples. In the case of the male, total body water, Na and Cl excretion, urine ammonia excretion were significantly changed between groups. In the case of the female, total body water and urine creatinine excretion were significantly changed between groups. We calculated the urine osmolar contribution of NaCl and urea. Our results showed that NaCl composed 63.6% of total urine osmolality and Urea composed 36.4% of total urine osmolality. In conclusion, urine osmolar composition is similar to the 1960 s, but further studies are required to elucidate the change of urine composition in’ this population for another 50 years.
Electrolyte, Osmolar concentration, Urine Original article
NaCl, while less than 1/3 is by urea. Such composition of urine osmolality is due to a low protein and high salt diet. Nowadays, the Korean s dietary habit has changed’ because of a westernized life style. In this study, we investigated if there were differences in urine comp osition and omolality according to age.
Materials and methods
1. Study population
The subjects consisted of 284 Koreans, 142 males and 142 females, living in Chonbuk and Chonnam province in Korea. Their age ranged from 7 to 68 years of age. According to the study subjects age, groups’ were defined as follows: group I has patients under 15 years of age, group II between 16 and 20 years, group III between 21 and 30, group IV between 31 and 40, group V between 41 and 50 years, and group VI over 50 years of age. Each group consisted of males and females in similar ratios. We performed routine physical examinations and biochemical analyses on their 24 hour urine samples. A written informed consent was obtained from all subjects. Total body water was calculated by Watson methods [male; 2.45+0.34 Weight (kg)× + 0.11 Height (cm)-0.095 Age (years), female; -2.1× ×
+0.25 weight (kg)× +0.11 Height (cm)]3). Chonbuk National University Hospital Ethical Committee
approved the protocols used for this study.
2. Chemical analyses of serum and urine sample Blood and urine electrolytes were measured by ASTRA-8 (Beckman, Utah, USA) and HITACHI 7600-110 (Tokyo, Japan). Blood and urine osmolality was measured by the FISKE Micro-osmometer model 210 (MA, USA). Urine ammonia was measured by the osmometry method4).
3. Statistic analyses
All analyses were conducted using the SPSS Sta- tistical Software Package (version 11.0 : SPSS Inc, Chicago, IL, USA), and all data are expressed as means SD. Differences in biochemical parameters± between groups were assessed by student's t-test.
Correlations between 24 hours urine volume, and urine electrolyte excretion were tested by Pearson's cor- relation. A P value of <0.05 was regarded as signi- ficant.
Results
1. Total body water, 24 hour urine electrolytes, osmolality and ammonia excretion according to the age In case of the male, total body water, Na and Cl excretion, urine ammonia excretion were significantly
Table 1. Total Body Water, 24 Hour Urine Volume, Osmolality, and Total Excretion Amount of Electrolyte, Urea, Creatinine, and Ammonia According to Change with Different Ages in Males
Group (No of Subjects)
I
<15 (n=32)
II 16-20 (n=11)
III 21-30 (n=41)
IV 31-40 (n=30)
V 41-50
(n=9)
VI
>51 (n=19) TBW
L
%
Urine volume (mL/kg/24hr) Na (mmoL/kg/24h) Cl (mmoL/kg/24h) K (mmoL/kg/24h) Osmolality (osm/kg) Urea (mg/dL) NH3(mmol/L) Creatinine (mg/kg/24h)
30.8 6.2± 75.7 13.5± 20.3 10.4± 5.3 4.2± 6.6 4.7± 2.3 1.8± 780.5 251.8±
91.3 11.9± 31.4 18.8± 14.5 8.4±
41.1 3.8± 63.9 3.9± 20.9 5.3± 8.8 7.7± 9.6 7.7± 3.3 1.4± 485.6 53.1±
18.2 10.3± 17.4 5.5± 15.1 10.0±
42.4 4.2± 61.1 4.2± 16.7 5.6± 7.9 5.0± 6.4 4.1± 2.4 1.3± 764.8 173.7±
17.5 2.0± 26.3 20.8± 11.9 15.8±
41.5 4.0± 59.6 3.7± 14.3 5.6± 3.3 3.8± 3.1 2.6± * 1.2 1.1± 777.7 388.7±
48.4 3.3± 9.3 1.3± 12.1 4.5±
38.6 1.9± 58.6 1.6± 11.4 3.3± *
2.2 0.4± * 1.9 0.3± * 1.1 0.4± * 703.4 117.8± 117.8 4.8±
21.2 5.4± 12.7 3.1±
35.2 10.6± 56.1 1.4± 14.1 2.0± *
2.5 0.6± * 2.4 0.7± * 1.3 0.5± * 566.1 63.0±
89.5 35.0± 23.2 10.3± 17.1 7.3± mean SD.± *p<0.05 vs group I. TBW, total body water
changed between groups. In case of the female, total body water and urine creatinine excretion were signi- ficantly changed between groups. The other parame- ters were similar between both male and female groups (Table 1, 2, Fig. 1-4).
In the groups I and II, the total body water was increased significantly in both males and females. In the group II male, urine volume, Na+and K+excretion were not changed compared to the group I male. But, urine osmolality and urea were decreased in the group II males (Table 1). Urine ammonia excretion was 31.4 18.8 mmol/L in the group I males as com± pared to 17.4 5.5 mmol/L in the group II males, the difference± being statistically significant (p<0.05). In the females, urine osmolality was decreased in group II as compared to the group I (Table 2). But, Na+ and K+ excretion were not changed compared to the group I female. Urea was increased in the group II female. Urine ammonia excretion was similar between the groups I and II female (Table 2).
In the groups I and III, Na+and K+excretion, urine osmolality, urea and ammonia excretion were similar in the group III males (Table 1). In the females, urine volume, Na+and K+excretion, urine osmolality, urea and creatinine excretion were similar in the group III, but urine ammonia excretion were decreased in the group III (Table 2).
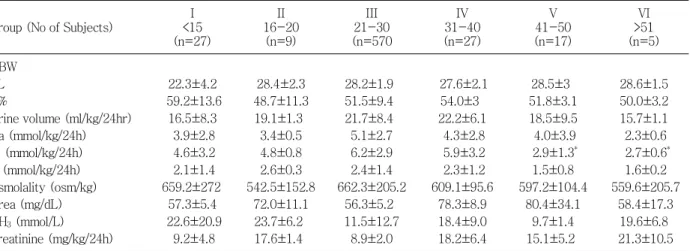
In the groups I and IV, urine volume, Na+, K+, Cl- excretion and urea and urine ammonia excretion were decreased in the group IV male (Table 1). In the female, Na+, K+ and Cl- excretion, urea and urine ammonia Table 2. Total Body Water, 24 hour Urine Volume, Osmolality, and Total Excretion amount of Electrolyte, Urea, Creatinine and Ammonia according to change with Different Ages in Females
Group (No of Subjects)
I
<15 (n=27)
II 16-20 (n=9)
III 21-30 (n=570
IV 31-40 (n=27)
V 41-50 (n=17)
VI
>51 (n=5) TBW
L
%
Urine volume (ml/kg/24hr) Na (mmol/kg/24h) Cl (mmol/kg/24h) K (mmol/kg/24h) Osmolality (osm/kg) Urea (mg/dL) NH3(mmol/L) Creatinine (mg/kg/24h)
22.3 4.2± 59.2 13.6± 16.5 8.3±
3.9 2.8± 4.6 3.2± 2.1 1.4± 659.2 272±
57.3 5.4± 22.6 20.9±
9.2 4.8±
28.4 2.3± 48.7 11.3± 19.1 1.3±
3.4 0.5± 4.8 0.8± 2.6 0.3± 542.5 152.8±
72.0 11.1± 23.7 6.2± 17.6 1.4±
28.2 1.9± 51.5 9.4± 21.7 8.4± 5.1 2.7± 6.2 2.9± 2.4 1.4± 662.3 205.2±
56.3 5.2± 11.5 12.7±
8.9 2.0±
27.6 2.1± 54.0 3± 22.2 6.1±
4.3 2.8± 5.9 3.2± 2.3 1.2± 609.1 95.6±
78.3 8.9± 18.4 9.0± 18.2 6.4±
28.5 3± 51.8 3.1± 18.5 9.5± 4.0 3.9± 2.9 1.3± * 1.5 0.8± 597.2 104.4±
80.4 34.1± 9.7 1.4± 15.1 5.2±
28.6 1.5± 50.0 3.2± 15.7 1.1± 2.3 0.6± 2.7 0.6± * 1.6 0.2± 559.6 205.7±
58.4 17.3± 19.6 6.8± 21.3 10.5± mean SD.± *p<0.05 vs group I. TBW, total body water
Table 3. Percent Contribution of NaCl and Urea to the Specific Gravity and the Total Osmolality of Urine
Subjects
% of S.G.
accounted for by
% of Uosm accounted
for by Urea NaCl Urea NaCl Koreans
Hong, Park & Hong Yoon & Hong (1961) Suh & Hong (1961) Kim (unpublished data) Author (2006)
Male Female
14.5 - - 18.3
41.0 - - 48.5
28.8 19.8 - 28.2 36.4 46.2 26.6
58.5 57.7 53.2 58.8 63.6 53.7 73.4 Americans
Price et al. (1940) low protein high protein Miller et al. (1941)
ordinary diet Epstein et al. (1957)
low protein high protein
20.0 28.0
21.8
- -
29.3 26.8
30.9
- -
- -
-
25.0 40.0
- -
-
- - British
McCance (1945) ordinary diet ordinary diet+salt
- -
- -
41.0 -
32.0 62.0 S.G., Specific Gravity; Uosm, Osmolality
excretion were increased in the group IV female (Table 2).
In the groups I and V, urine volume, Na+ and K+ excretion and urine ammonia excretion were de- creased in the group V male, but urea excretion were increased (Table 2). In the female, K+and urine am- monia excretion were decreased in the group V (Table 2).
In the groups I and VI, urine volume, Na+, K+and urine osmolality ammonia were decreased in the group IV male (Table 1). In female, urine volume, Na+and K+ excretion and urine ammonia excretion were decreased in the group VI (Table 2).
We calculated the urine osmolar contribution of NaCl and urea. Our results showed that NaCl composed 63.6% of total urine osmolality and Urea composed 36.4% of total urine osmolality (Table 3).
2. Correlation between 24 hour urine volume, Na+, K+ and creatinine excretion
The correlation between 24 hour urine volume and Na+ excretion was significant (male : R=0.487, p<
0.001, female : R=0.49, p<0.001) in both the male and female groups (Fig. 5). The correlation between 24 hour urine volume and K+ excretion was significant (male : R=0.657, p<0.001, female : R=0.553, p<0.001) in both the male and female groups (Fig. 6).
Discussion
Urine concentration ability in the renal tubule is influenced by several conditions, such as ADH se- cretion, water intake, dehydration, or protein intake.
The Indicator of urine concentration ability is urine
Fig. 1. Changes of urine volume with different ages of the males and females.
Fig. 2. Changes of Na+excretion amount with different ages of the males and females
Fig. 3. Changes of K+excretion amount with different ages of the males and females.
Fig. 4. Changes of Cl-excretion amount with different ages of the males and females.
omsolality. Boyarsky et al. reported a urine osmolality of 789 mOsm/kgH2O when 5 units of Pitressin tannate was injected5). Wardener et al. reported that the urine concentrations following the intravenous admi- nistration of pitressin were 865 and 885 mOsm/kgH2O in the subjects6). Epstein et al. reported that urine osmolality was 902 mOsm/kgH2O during continuous
pitressin infusion7). In the dehydrated state, urine os- molality were 1,400 mOsm/kgH2O in westerners and 1,170 mOsm/kgH2O in Koreans. Some differences are seen in urine osmolality between westerners and Koreans. The osmolar composition of urine in the occidentals indicate that urea is responsible for 56.2%
and NaCl is responsible for 43.8%.
Chang et al.8)reported that the 24 hour urine volume was 1,312 50 mL, ammonia excretion was 46± ±0.02 mg/dL, NaCl excretion was 280.5 0.6 mEq/L, and urine± osmolality was 755 21.2 mOsm/kgH± 2O in a healthy young man in the 1960 s. Our results indicate that urine’ volume is slightly decreased in males and females in the twenties compared to teenager s. Urea excretion in’ the twenties is slightly decreased in male but in case of female, there was no changes compared to teenager's. Ammonia excretion is slightly decreased in males and females in the twenties compared to teenager s. Our urine Na’ +excretion in the twenties is 7.94 5 mmol/kg/24hr in male, 5.12 2.7 mmol/kg/24hr± ± in female. About 40 years ago, Hong et al.2)reported that the urine osmolality accounted for by NaCl is 58.5%, while that by urea was 28.8% in healthy Koreans. In our results, NaCl composed 63.6 % of total urine osmolality and Urea composed 36.4% of total urine osmolality. This result indicates that salt may be responsible for two thirds of urine omsolality. The causes are unknown but we postulated that it is due to larger intake of fast food among those in the twenties, and the fact that overall diet habit has not changed since the 1960's.
In conclusion, urine osmolar composition is similar to the 1960 s, but further studies are required to elu’ - cidate the change of urine composition in this po- pulation for another 50 years.
References
1) Rose DB, Post TW :Clinical physiology of acid-base and electrolyte disorders, 5th ed., New York, McGraw-Hill, Medical Pub. Division, 2001 2) Hong YP, Park CS, Hong SK : The Relation of Urine
Specific Gravity to Its Composition and Osmolality Urine volume (ml/24hr)
0 500 1000 1500 2000 2500
0 200 400 600 800 1000
1200 Male
Female
Urinary Excretion of Na+(mEq/24hr)
Urine volume (ml/24hr)
0 500 1000 1500 2000 2500
0 200 400 600 800 1000
1200 Male
Female
Urinary Excretion of Na+(mEq/24hr)
Fig. 5. Relationship between Na+excretion amount and urine volume during 24 hours of the males and females (male:
R=0.487, p<0.001, female : R=0.49, p<0.001).
0 500 1000 1500 2000 2500
0 100 200 300 400
Male Female
Urinary Excretion of K+(mEq/24hr)
Urine volume (ml/24hr)
0 500 1000 1500 2000 2500
0 100 200 300 400
Male Female
Urinary Excretion of K+(mEq/24hr)
Urine volume (ml/24hr)
Fig. 6. Relationship between K+excretion amount and urine volume during 24 hours of the males and females (male : R=0.657, p<0.001, female : R=0.553, P<0.001).
in the Normal Korean. Yonsei Med J 2:27-30, 1961
3) Watson PE, Watson ID, Batt RD : Total body water volumes for adult males and females estimated from simple anthropometric measurements. Am J Clin Nutr 33:27-39, 1980
4) Oh MS, Phelps KR, Lieberman RL, Carroll HJ. De- termination of urinary ammonia by osmometry.
Anal Chem 51:2247-2248, 1979
5) Boyarsky S, Smith HW : Renal concentrating operation at low urine flows. J Urol 78:511-524, 1957
6) De Wardener HE, Herxheimer A : The effect of a high water intake on the kidney's ability to con- centrate the urine in man. J Physiol 139:42-52, 1957
7) Epstein FH, Kleeman CR, Pursel S, Hendrikx A : The effect of feeding protein and urea on the renal concentrating process. J Clin Invest 36:635-641, 1957
8) Chang KS, Park CS, Hong SK : Further analysis of various renal functions in the Korean. 3. Urinary excretion of phosphate, ammonia and titratable acid. Yonsei Med J7:13-19, 1966