411
Isolated and Combined Influences of Diabetes and Hypertension on the Myocardial Function and Geometry
Kyoung Im Cho, MD, Jeong Ho Park, MD, Chun Kwan Lee, MD, Suk Hun Kim, MD, Jeong Myung Ahan, MD, San Kim, MD and Tae Ik Kim, MD
Division of Cardiology, Department of Internal Medicine, Maryknoll General Hospital, Busan, Korea ABSTRACT
Background and Objectives:Because hypertension and left ventricular hypertrophy (LVH) frequently coexist with diabetes, in this study we sought to compare the myocardial functional and structural changes in diabetic patients who were with or without hypertension with those myocardial functional and structural changes in non-diabetic subjects with hypertension (essential hypertension), in order to identify the role of diabetes alone, in relation to the myocardial dysfunction. Subjects and Methods:We studied 50 patients with essential hypertension (HTN, 20 men and 30 women; mean age: 59±12 years), 54 diabetes mellitus patients without hypertension (DM, 24 men and 30 women; mean age: 60±9 years), 53 diabetes mellitus patients with hypertension (DM+HTN, 23 men and 30 women; mean age: 61±7 years), and 49 normal subjects (22 men and 27 women; mean age: 56±
13 years). We used echocardiography that was comprised of the standard 2-dimensional and conventional Doppler imaging for estimating the left ventricular mass index (LVMI), the relative wall thickness (RWT) and the Doppler- derived myocardial performance index (MPI, Tei index). Subjects were considered to have normal geometry (NG) if both the LVMI and RWT were normal (LVMI≤104 g/m2 in females, LVMI≤116 g/m2 in males, RWT≤0.43), concentric hypertrophy (CH) if both were elevated, eccentric hypertrophy (EH) if the LVMI was elevated and the RWT was normal, and concentric remodeling (CR) if the LVMI was normal and the RWT was elevated. Results:
The Tei index was significantly higher in the patients with essential hypertension and diabetes, especially in the DM+
HTN group (HTN=0.48±0.13; DM=0.41±0.09; DM+HTN=0.53±0.11), as compared to the controls (0.31±
0.11, p<0.05). The LVMI and RWT were significantly higher in the patients with essential hypertension and diabetes, and especially in the DM+HTN group (HTN=132.2±44.4 g/m2 and 0.45±0.11; DM=125.9±34.4 g/m2 and 0.44±0.07; DM+HTN=153.9±42.9 g/m2 and 0.48±0.07), as compared to the controls (108.9±22.2 g/m2 and 0.39±0.05, p<0.05). Conclusion:Our study demonstrated the early appearance of adverse myocardial functional and geometric changes in the diabetic patients, and the study also showed that the contributory effects of diabetes to the myocardial impairment and LV hypertrophy were produced by the presence of hypertension. The Tei index is a very sensitive method for the detection and evaluation of myocardial impairment in diabetic patients. (Korean Circulation J 2006;36:411-417)
KEY WORD:Diabetes mellitus.
Introduction
Elevated blood pressure occurs 1.5 to 2 times more frequently in diabetics than in non-diabetic persons.1)2)
The Framingham study reported that up to 50% of the patients with diabetes mellitus(DM) have systemic hy- pertension.3) Although age amplifies the incidence of both conditions, systemic hypertension is associated with type 2 DM, and this is independent of age, obesity or the renal function.4) Despite the well-established asso- ciation of hypertension with DM, the cardiac features and systemic hemodynamic profile of hypertension that are associated with DM have not been fully elucidated.
Patients with essential hypertension and the hypertensive diabetes patients with a normal left ventricular(LV) ejec- tion fraction are closely associated with the development
Received:August 17, 2005
Revision Received:November 9, 2005 Accepted:November 22, 2005
Correspondence:Kyoung Im Cho, MD,Division of Cardiology, Department of Internal Medicine, Maryknoll General Hospital, 4-12 Daechung-dong, Joong-gu, Busan 600-730, Korea
Tel: 82-51-461-2349, Fax: 82-51-465-7470 E-mail: [email protected]
of congestive heart failure. However, the recent studies have suggested the coexistence of impaired systolic func- tion in those patients with presumably isolated diastolic dysfunction and a normal ejection fraction.5)6) The Dop- pler-derived myocardial performance index(MPI, Tei in- dex) is a non-geometrical noninvasive assessment of the global LV function, and it includes components from both the systole and diastole.7) The aim of the present study was to investigate the separate and joint effects of systemic hypertension and DM on the cardiac structure and global function of the left ventricle, as evaluated by the MPI.
Subjects and Methods
Study subjects
The study population was prospectively enrolled bet- ween March 2004 and December 2004, and it consisted of 157 consecutive patients. We studied 50 patients with essential hypertension(Group 1, HTN, 20 men and 30 women; their average age was 59±12 years), 54 diabe- tes mellitus patients without hypertension(Group 2, DM, 24 men and 30 women; their average age was 60±9 years), 53 diabetes mellitus patients with hypertension (Group 3, DM+HTN, 23 men and 30 women; their average age was 61±7 years), 49 normal subjects(22 men and 27 women; their average age was 56±13 years).
Hypertension was diagnosed if the blood pressure was
≥140 mmHg systolic and/or 90 mmHg diastolic or if the participants took antihypertensive medications.8) DM was diagnosed if the fasting plasma glucose was ≥126 mg/dL or if the participants were taking insulin or oral hypoglycemic medications.9) Patients with coronary artery disease were excluded based on negative dobutamine stress echocardiography or a treadmill exercise test and, in a number of cases, on normal coronary angiography [13 patients from Group 1(HTN), 16 from the Group 2(DM), and 15 from Group 3(DM+HTN)]. LV ejec- tion fraction was in all cases >55% and fractional shor- tening was >25%, as evaluated by echocardiography.
The other exclusion criteria were secondary arterial hypertension, chronic obstructive lung disorder, severe renal failure and bundle branch block or atrial fibril- lation.
Echocardiography
All echocardiography examinations were performed on a GE Vivid Seven ultrasound machine(GE Medical Sys- tem, Horden, Norway) with a 2.5 MHz transducer.
M mode echocardiography
Measurements of the left atrial dimension, the left ventricular end diastolic internal dimension(LVIDd), the left ventricular end systolic internal dimension (LVIDs), the interventricular septal thickness(IVSd),
the left ventricular posterior wall thickness(LVPWTd), and the ejection fraction {EF=(LVIDd3-LVIDs3/ LVIDd3)} were determined from 2-dimensionally tar- geted M-mode tracings according to the recommenda- tions of the American Society of Echocardiography. The LV mass was calculated by the corrected American So- ciety of Echocardiography cube formula,10) and it was indexed for the body surface area to obtain the LV mass index.
ASE-cube LV mass(g)=1.04{(IVSd+LVIDs+LVP- WTd)3-LVIDs3}
LV mass by corrected ASE method(LVMASE)=0.8 (ASE-cube LV mass)+0.6
LV mass index(LVMI)=LVMASE/BSA(g/m2) The relative posterior wall thickness was measured at end diastole as the ratio between the double of the pos- terior wall thickness to the LV diastolic cavity diameter.
LV hypertrophy(LVH) was defined as an increased LV mass index >104 g/m2 in women and >116 g/m2 in men.11) Concentric hypertrophy was defined as LVH with an increased relative wall thickness(2×posterior wall diameter/LV diastolic diameter >0.43). Concentric LV remodeling was defined as an increased relative wall thickness with a normal LV mass index. Eccentric hy- pertrophy was defined as LVH without an increased re- lative wall thickness.12)
Doppler echocardiography
Conventional Doppler measurements included the peak early and late diastolic mitral flow velocity, the de- celeration time(DT) of the early diastolic mitral flow,
Mitral flow a
b IRT
LV outflow Mitral flow
ICT
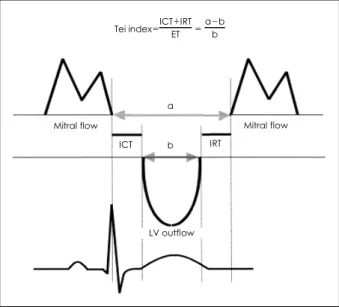
Tei index=ICT+IRT ET = a-b
b
Fig. 1. The interval a (from the cessation to the onset of mitral inflow) is equal to the sum of the isovolumetric contraction time (ICT), the ejection time (ET), and the IRT. The interval b represents the ET at the left ventricular outflow tract. The Tei index of myocardial performance was calculated as (a-b)/b. IRT: isovolumetric relaxation time, LV: left ventricular.
the isovolumetric relaxation time and the total ejection time. Pulsed Doppler measurements were obtained with the transducer in the apical four-chamber view with the Doppler beam aligned perpendicular to the plane of the mitral annulus. The sample volume was placed between the tips of the mitral leaflets. Five consecutive beats were used for calculating the Doppler variables. Doppler time intervals were measured from the mitral inflow and LV outflow velocity-time intervals as previously described by Tei et al.(Fig. 1).7) All the echocardiograms were per- formed and then analyzed by one observer(C.K.I).
Statistics
All data are expressed as means±standard deviations (SD). The data were analyzed using standard statistical software(SPSS package version 11.0), and comparisons of all the measurements were made with a F test(one- way ANOVA) for continuous variables, the chi-square test for categorical variables and Pearson’s test for the
correlation analysis. A p of <0.05 was considered stati- stically significance.
Results
The patients’ basic demographics are shown in Table 1.
There were no statistical differences in age, gender, heart rate, smoking histories or plasma creatinine among all the disease groups and controls. Group 1(HTN) and Group 3(DM+HTN) had significantly higher systolic and diastolic blood pressures, body mass indexes and more prescriptions for antihypertensive medications than the other groups, but they did not significantly differ between each other with regard to these parameters. No significant differences were found between Group 2 (DM) and Group 3(DM+HTN) for the diabetic treat- ment, the type and duration of diabetes, the plasma glucose and hemoglobin A1c and the prevalence of dia- betic complications(Table 1).
Table 1. Comparison of the clinical and laboratory characteristics
Control (n=49) HTN (n=50) DM (n=54) DM+HTN (n=53)
Age (years) 056±13 59±12 60±9 61±70*
Gender (M/F) 22/27 20/30 24/30 23/30
BMI (kg/m2) 23.4±3.5 24.5±2.8*† 23.1±2.7 24.8±3.6*†
SBP (mmHg) 118.5±12.4 158.6±10.8*† 124.4±14.0 160.6±19.9*†
DBP (mmHg) 76.5±9.2 93.5±9.3*† 77.1±9.7 90.0±8.0*†
HR (bpm) 067.6±10.3 69.0±14.40. 71.6±9.2 71.2±11.60
Smoking (%) 30 45 38 43
Duration of HTN or DM (years) - 3.9 (1-15) 5.6 (1-20) 6.5 (1-21)
BP medicaiotn
ACE inhibitor/AT II blocker Beta blockers
CCB Diuretics
-
32/50 32/50 30/50 14/50
- 30/54
34/53 36/53 28/53 26/53
Serum creatinine 000.7±0.32 00.8±0.27 000.8±0.34 0.9±0.42
HbAIc - - 006.7±0.92 6.9±0.84
Values are means±SDs. *: p<0.05 vs. control, †: p<0.05 vs. diabetes mellitus without hypertension. HTN: essential hypertension, DM: diabetes mellitus without hypertension, DM+HTN: diabetes mellitus without hypertension, BMI: body mass index, SBP: systolic blood pressure, DBP: dia- stolic blood pressure, HR: heart rate, ACE: angiotensin converting enzyme, AT: angiotensin, CCB: calcium channel blocker, HbAIc: glycosylated he- moglobin
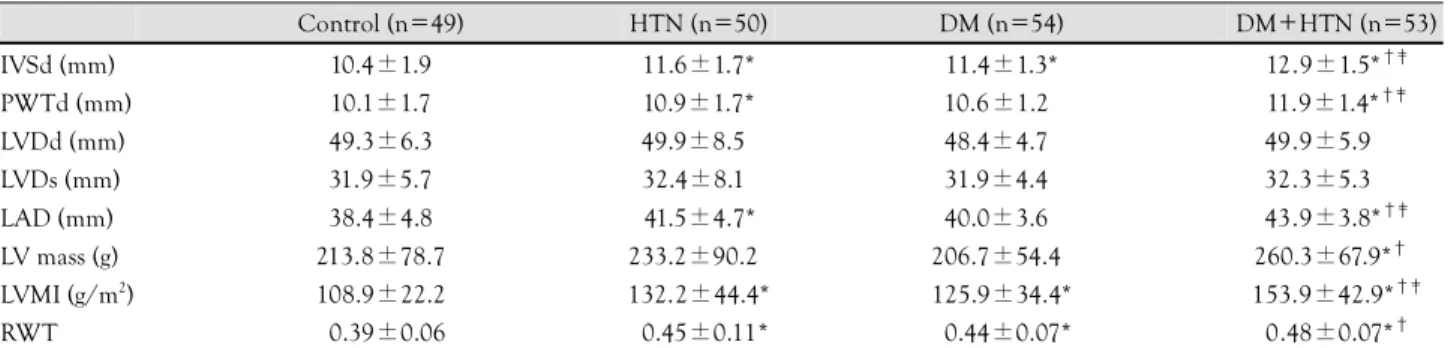
Table 2. Comparison of the M-mode assessment of the left ventricular geometry
Control (n=49) HTN (n=50) DM (n=54) DM+HTN (n=53)
IVSd (mm) 10.4±1.9 11.6±1.7* 11.4±1.3* 12.9±1.5*†‡
PWTd (mm) 10.1±1.7 10.9±1.7* 10.6±1.2* 11.9±1.4*†‡
LVDd (mm) 49.3±6.3 49.9±8.5* 48.4±4.7* 49.9±5.9*†‡
LVDs (mm) 31.9±5.7 32.4±8.1* 31.9±4.4* 32.3±5.3*†‡
LAD (mm) 38.4±4.8 041.5±4.7** 40.0±3.6* 43.9±3.8*†‡
LV mass (g) 213.8±78.7 233.2±90.2* 206.7±54.4* 260.3±67.9*†‡
LVMI (g/m2) 108.9±22.2 132.2±44.4* 125.9±34.4* 153.9±42.9*†‡
RWT 00.39±0.06 00.45±0.11* 00.44±0.07* 0.48±0.07*†
Values are means±SDs. *: p<0.05 vs. control, †: p<0.05 vs. diabetes mellitus without hypertension, ‡: p<0.05 vs. essential hypertension. HTN:
essential hypertension, DM: diabetes mellitus without hypertension, DM+HTN: diabetes mellitus with hypertension, IVSd: interventricular septal thickness, PWTd: left posterior wall thickness, LVDd: left ventricular diastolic dimension, LVDs: left ventricular systolic dimension, LAD: left atrium dimension, LV: left ventricular, LVMI: left ventricular mass index, RWT: relative wall thickness
M mode echocardiographic data and the LV geome- tric pattern
The mean interventricular septal and posterior LV wall thickness were greater in the patients with hypertension and diabetes with no difference being noted between the groups for the LV chamber size; therefore, the relative wall thickness was greater in the diabetic and hyperten- sive individuals, especially for Group 3(DM+HTN) (Group 1, HTN=0.45±0.11; Group 2, DM=0.44±
0.07; Group 3, HTN+DM=0.48±0.07); these indi- viduals had the largest left atrial dimension and LV mass index(Group 1, HTN=132.2±44.4 g/m2; Group 2, DM=125.9±34.4 g/m2; Group 3, HTN+DM=153.9±
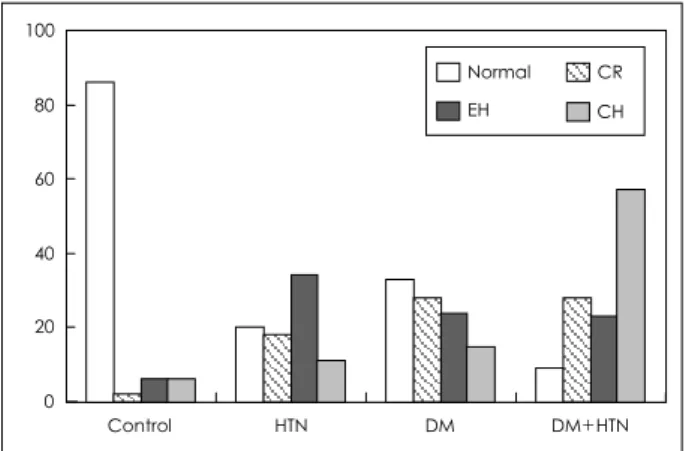
42.9 g/m2)(Table 2)(Fig. 2). Among the patients in Group 1(HTN) who had a LV mass index greater than the 95th percentile, 14 of them had concentric hyper- trophy and 17 of them had eccentric hypertrophy. Nine patients had an LV mass less than the 95th percentile, but they had an elevated relative wall thickness, indi- cating that concentric LV remodeling had taken place.
The remaining 10 patients had normal LV geometry.
Among the Group 2 patients(DM) who had geometrical
changes of the left ventricle, 15 had concentric hyper- trophy, 13 had eccentric hypertrophy and 8 had concen- tric remodeling. However, 18 group 2 patients showed normal geometry. Among the Group 3 patients(DM+
HTN), 30 had concentric hypertrophy, 12 had eccen- tric hypertrophy, 5 had concentric remodeling and only 6 had normal geometry(Fig. 3).
Doppler echocardiographic data and diastolic func- tion
There was no significant difference in the LV ejection fraction between the groups. The peak E velocity was significantly decreased in Group 1(HTN) compared to the normal subjects(69.4±14.2 cm/s vs. 62.7±17.3 cm/
s, p<0.05), and the peak A velocity was significantly increased in Group 3(DM+HTN) compared to Group 2(DM)(87.6±15.9 cm/s vs. 78.2±16.3 cm/s, p<0.05).
The E/A ratio, DT and IRT were comparable between Group 1(HTN) and Group 3(DM+HTN), but these parameters were significantly increased compared to the normal group and Group 2(DM). The conventional Doppler parameters; i.e., a lower E/A ratio and a longer IRT, were able to demonstrate LV diastolic dysfunction only for the patients from Group 1(HTN) and Group 3(DM+HTN), and these parameters failed to demon- strate this for the Group 2(DM) patients(Table 3).
Tei index in essential hypertension and diabetes The Tei index was significantly increased in the pa- tients with hypertension and the patients with diabetes, and the Tei index was especially increased in Group 3(DM+HTN) patients(Group 1, HTN=0.48±0.13;
Group 2, DM=0.41±0.09; Group 3, DM+HTN=
0.53±0.11) compared to the controls(0.31±0.11, p<
0.05)(Table 3)(Fig. 4). This was primarily due to the prolongation of the IRT in the patients with hyperten- sion and the shortening of the ejection time in the groups with hypertension and diabetes. No correlations
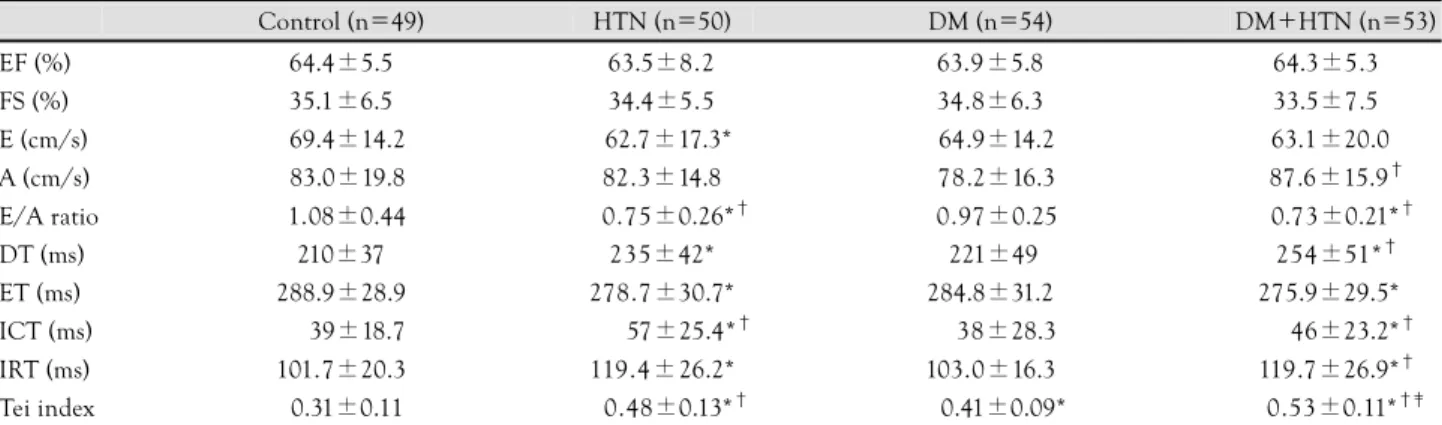
Table 3. Comparison of the left ventricular systolic and diastolic variables
Control (n=49) HTN (n=50) DM (n=54) DM+HTN (n=53)
EF (%) 64.4±5.5 63.5±8.2 63.9±5.8 64.3±5.30.
FS (%) 35.1±6.5 34.4±5.5 34.8±6.3 33.5±7.50.
E (cm/s) 069.4±14.2 062.7±17.3* 064.9±14.2 63.1±20.0*
A (cm/s) 083.0±19.8 82.3±14.8 078.2±16.3 87.6±15.9†
E/A ratio 01.08±0.44 000.75±0.26*† 00.97±0.25 ..0.73±0.21*†
DT (ms) 210±37 235±42* .221±49 254±51*†
ET (ms) 288.9±28.9 278.7±30.7* 284.8±31.2 275.9±29.5*†
ICT (ms) 00.39±18.7 000..57±25.4*† 00.38±28.3 00.46±23.2*†
IRT (ms) 101.7±20.3 119.4±26.2* 103.0±16.3 119.7±26.9*†
Tei index 00.31±0.11 000.48±0.13*† 000.41±0.09* 0.0.53±0.11*†‡
Values are means±SDs. *: p<0.05 vs. control, †: p<0.05 vs. diabetes mellitus without hypertension, ‡: p<0.05 vs. essential hypertension. HTN:
hypertension, DM: diabetes mellitus without hypertension, DM+HTN: diabetes mellitus with hypertension, EF: ejection fraction, E: peak E velocity, A: peak A velocity, DT: deceleration time, ET: ejection time, IRT: isovolumetric relaxa tion time, ICT: isovolumetric contraction time, FS:
fractional shortening
61% 47% 72%
14%
0 10 20 30 40 50 60 70 80
Control HTN DM DM+HTN LVH
Fig. 2. The prevalence of left ventricular hypertrophy in the groups.
HTN: essential hypertension, DM: diabetes mellitus without hyperten- sion, DM+HTN: diabetes mellitus with hypertension, LVH: left ven- tricular hypertrophy.
were observed for the diabetes duration, the HbA1c or the urine albumin excretion. The index was similar in Group 1(HTN) patients who had geometric LV abnor- mality as compared to the patients without geometric changes(0.48±0.13 vs. 0.39±0.10, respectively, p=NS).
Similar findings were found in Group 2(DM) patients who had geometric changes of the left ventricle as com- pared to the patients with normal geometry(0.40±0.02 vs. 0.40±0.11, respectively, p=NS). However, the index was higher in Group 3(DM+HTN) patients who had geometrical changes of the left ventricle as compared to the patients with normal geometry(0.51±0.13 vs. 0.39±
0.18, respectively, p<0.05). Multiple regression analyses showed that the E/A ratio and IRT were related to the LVMI, BMI and the systolic and diastolic blood pres- sures, but the Tei index was only related to the systolic blood pressure and the IRT(Table 4).
Discussion
The present study shows that diabetes and hyperten- sion are associated with the independent and additive
increases in the prevalence and degree of the abnorma- lities of the LV structure and function. Diabetes without hypertension deteriorates the LV myocardial performance, and diabetes further enhances the LV systolic and dia- stolic dysfunction that’s present in patients with essential hypertension. The Tei index is increased in patients with essential hypertension and in diabetic patients with or without hypertension who have a normal ejection frac- tion, and this adds valuable information for the evalua- tion of the LV systolic and diastolic function. This result indicates that the Tei index is a very sensitive method of detecting and evaluating the myocardial impairment in diabetic patients.
Diabetes may predispose a patient to heat failure in- dependently of any concurrent coronary or rheumatic heart disease.1) Diabetic myocardial changes may be due to metabolic derangements,13) microvascular disease,14) and myocardial fibrosis.15) The most prominent histo- pathologic findings in diabetic patients without coronary artery disease and hypertension are myocellular hyper- trophy and myocardial fibrosis,16) and this implies changes in both the myocardial function and structure; these
Table 4. Correlation analysis of the left ventricular filling parameters between the diabetics and non-diabetics; Pearson’s correlation coeffi- cient®
Non-diabetes (n=103) Diabetes (n=103) Isovolumetric relaxation time
r p r p
LVMI -0.28 <0.001 -0.04 NS
BMI -0.21 <0.001 -0.19 NS
RWT -0.17 NS -0.17 NS
Systolic BP -0.48 <0.001 -0.09 NS Diastolic BP -0.41 <0.001 -0.13 NS
Peak EA velocity ratio
r p r p
LVMI -0.28 <0.001 -0.10 NS
BMI -0.22 <0.001 -0.16 NS
RWT -0.13 NS -0.09 NS
Systolic BP -0.34 <0.001 -0.30 <0.001 Diastolic BP -0.30 <0.001 -0.14 NS
Myocardial performance index (Tei index)
r p r p
LVMI -0.15 NS -0.17 NS
BMI -0.30 NS -0.19 NS
RWT -0.14 NS -0.09 NS
Systolic BP -0.44 <0.001 -0.24 <0.001 Diastolic BP -0.43 <0.001 -0.11 NS
IRT -0.57 <0.001 -0.32 <0.001
E/A ratio -0.26 NS -0.17 NS
LVMI: left ventricular mass index, RWT: relative wall thickness, BMI:
body mass index, SBP: systolic blood pressure, DBP: diastolic blood pressure, HR: heart rate, IRT: isovolumetric relaxation time, DT:
deceleration time, NS: non significant, E: peak E velocity, A: peak A velocity
0 20 40 60 80 100
Control HTN DM DM+HTN Normal CR
EH CH
Fig. 3. Distribution of the ventricular hypertrophy according to the geometric patterns. HTN: hypertension, DM: diabetes mellitus without hypertension, DM+HTN: diabetes mellitus with hypertension, EH:
eccentric hypertrophy, CR: concentric remodeling, CH: concentric hypertrophy.
* * *
0 0.1 0.2 0.3 0.4 0.5 0.6
Control HTN DM DM+HTN Tei index
Fig. 4. Comparison of the Tei index between the groups. *: p<0.05 vs.
control. HTN: hypertension, DM: diabetes mellitus without hyperten- sion, DM+HTN: diabetes mellitus with hypertension.
changes are largely indistinguishable from the changes found in hypertensive left ventricular disease. The patho- genesis of diabetic cardiomyopathy is unclear, although the possible mechanisms include the synergistic impact of hypertension plus a chronic derangement of myocar- dial metabolism with increased free fatty acid oxidation and decreased glucose utilization.17)
In relation to the left ventricular structure and func- tion in diabetes, the published studies in Korea have been mainly focused on the early LV diastolic filling defects in diabetics with microangiopathy.18-20) In the present study, the most commonly used indexes of LV systolic performance, such as LV fractional shortening and the LV ejection fraction, were within normal the range and they failed to discriminate any myocardial dysfunction in the evaluated diabetic population. The conventional Doppler parameters such as the E/A ratio turned out to be of very limited value because they did not reveal the LV dysfunction in the diabetics without hypertension. The present study demonstrated that the Tei index was significantly increased in patients with essential hypertension and also in the diabetics with or without associated hypertension despite their normal LV ejection fraction and their relatively short disease duration. The increase of the Tei index was related to the abnormalities of the LV systolic as well as the diastolic myocardial function. However, the underlying myocar- dial dysfunction seemed to differ between the non-dia- betic and diabetic patients with hypertension. For the patients with essential hypertension, the MPI was pri- marily increased due to prolongation of the isovolume- tric contraction and shortening of the ejection time, which indicated abnormalities of the systolic perfor- mance. These results are similar to the findings from other investigators who reported a reduced ratio of the pre-ejection time and the ejection time in the patients who had a reduced systolic LV function.12) The Tei index was increased in the patients with essential hyperten- sion regardless of the presence of abnormal diastolic filling; however, the increase of the index was most pro- nounced in the patients with diastolic dysfunction. Es- sential hypertension is associated with LV hypertrophy, increased myocardial fibrosis and subendocardial ische- mia, and these are factors that are believed to influence the myocardial function.21) However, in the present study, we did not find any relation between the Tei index and the LV mass or the changes in the LV geometry, which corresponds well to the previous studies.22)
In the diabetics group, the increased Tei index was primarily due to prolongation of the IRT, shortening of the ejection time and the elevated IRT/ET, which is well correlated to the invasive parameter of -dp/dt,7) and this was increased to the same extent in the diabetes patients who were without signs of diastolic filling abnormali- ties(the E/A ratio), as compared to the patients with
abnormal filling. This suggests that the Tei index might supplement the traditional methods of assessing the myocardial function of the diabetics with associated hy- pertension. The impact of the coexistence of diabetes and hypertension on the LV function has recently been investigated both by the Strong Heart study and the HyperGen study,23-25) where the apparent implications of a specific effect of diabetes on the LV relaxation of the myocardium were found in hypertensive type 2 diabetes patients.23) This can be due to impaired glycemic con- trol, microangiopathy or the interstitial accumulation of elastin and collagen, which also increase the LV mass and stiffness in diabetes patients.15) The changes due to dia- betes and hypertension appear to be synergistic, as is evidenced by the significantly higher Tei index and LVH in the diabetes with hypertension patient group; these findings are consistent with those of the previous studies that showed the combination of diabetes and hyperten- sion to have an adverse effect on the myocardium.24)25)
The LVH in some patients with diabetes may be mainly secondary to the diabetes rather than to the hypertension; this is supported by the findings for the 36 patients in the diabetes without hypertension group.
In the present study, DM was associated independently of systemic hypertension with a greater LV wall thickness and mass, and a worse myocardial function. This sug- gests that diabetes is as likely as hypertension to be associated with myocardial fibrosis, and this may be an important factor in the pathology of early diabetic heart disease. These results are similar to those results from a study that revealed greater replacement of the myocar- dium by fibrosis in rats with both diabetes and hyper- tension than in the rats with diabetes alone.26)
A new result of our analyses is that DM was more strongly associated with an increased LV relative wall thickness, while essential hypertension was more stron- gly associated with an increased LV mass. One factor contributing this finding is maybe the modest reduc- tion in blood volume due to hypoalbuminemia, which is due to the elevated urinary albumin excretion in the pa- tients with DM; this leads to a lower cardiac output and stroke volume in the group with DM alone than in the group with hypertension alone, allowing that the former group have a smaller LV chamber size and consequen- tly, a less elevated mass.
Because of the known adverse effects of LV hyper- trophy and systolic dysfunction on the cardiovascular event rates, the results of the present study have shown that the patients with DM and hypertension are an especially high-risk group. The ability to reverse LV hypertrophy and LV systolic dysfunction via instituting antihypertensive treatment and/or strict glycemic control may provide both mechanistic pathways and treatment targets that will serve to benefit patients suffering with DM and hypertension.
Study limitations
Several limitations are inherent in this type of obser- vational study. The medical therapies among the patients with essential hypertension and diabetes with associa- ted hypertension were different, which can possibly have influenced our results. Yet the patients’ medical therapies were consistent with the recommended regimens. Most of the diabetes patients were on medication, and the average HbA1c was 7% to 8%, suggesting imperfect, but moderately successful control of the patients’ blood sugar levels. A greater spectrum of control might have facili- tated elucidation of the relationship between myocardial dysfunction and glycemic control. Finally, we did not divide the patients according to the presence of diabe- tic microangiopathy, such as diabetic retinopathy and microalbuminuria, but the prevalence of diabetic com- plications were comparable between the diabetes groups, and any cases with persistent massive proteinuria were excluded from this study.
REFERENCES
1) UK Prospective Diabetes Study. Complications in newly diagno- sed type 2 diabetic patients and their association with different clinical and biochemical risk factors. Diabetes Care 1990;13:1-11.
2) Fuller JH, Stevens LK. Epidemiology of hypertension in diabetic patients and implications for treatment. Diabetes Care 1991;14 (Suppl 4):8-12.
3) Kannell WB, McGhee DL. Diabetes and cardiovascular risk fac- tors. Circulation 1979;59:8-13.
4) Yu CM, Lin H, Yang H, Kong SL, Zhang Q, Lee SW. Progres- sion of systolic abnormalities in patients with “isolated” diastolic heart failure and diastolic dysfunction. Circulation 2002;105:
1195-201.
5) Aurigemma GP, Williams D, Gaasch WH, Reda DJ, Materson BJ, Gottdiener JS. Ventricular and myocardial function following treatment of hypertension. Am J Cardiol 2001;87:732-6.
6) Kannell WB, Wilson PW, Zhang TJ. The epidemiology of impai- red glucose tolerance and hypertension. Am Heart J 1991;121:
1268-73.
7) Tei C, Nishimura RA, Seward JB, Tajik AJ. Noninvasive Doppler- derived myocardial performance index: correlation with simul- taneous measurements of cardiac catheterization measurements.
J Am Soc Echocardiogr 1997;10:169-78.
8) Howard BV, Welty TK, Fabsitz RR, et al. Risk factors of coronary heart disease in diabetic and non-diabetic Native Americans.
Diabetes 1992;41(Suppl 2):4-11.
9) American Diabetes Association. Report of the expert committee on the diagnosis and classification of diabetes mellitus. Diabetes Care 1997;20:1183-97.
10) Devereux RB, Alonso DR, Lutas EM, et al. Echocardiographic assessment of left ventricular hypertrophy: comparison to necro-
psy findings. Am J Cardiol 1986;57:450-8.
11) Levy D, Garrison RJ, Savage DD, Kannel WB, Castelli WP.
Prognostic implications of echocardiographically determined left ventricular mass in the Framingham Heart Study. N Engl J Med 1990;322:1561-6.
12) Ganau A, Devereux RB, Roman MJ, et al. Patterns of left ventri- cular hypertrophy and geometric remodelling in essential hyper- tension. J Am Coll Cardiol 1992;19:1550-8.
13) Rodrigues B, Cam MC, McNeill JH. Metabolic disturbances in diabetic cardiomyopathy. Mol Cell Biochem 1998;180:53-7.
14) Nitenberg A, Valensi P, Sachs R, Dali M, Aptecar E, Attali JR.
Impairment of coronary vascular reserve and ACh-induced coro- nary vasodilation in diabetic patients with angiographically nor- mal coronary arteries and normal left ventricular systolic function.
Diabetes 1993;42:1017-25.
15) van Hoeven KH, Factor SM. A comparison of the pathological spectrum of hypertensive, diabetic, and hypertensive-diabetic heart disease. Circulation 1990;82:848-55.
16) Genda A, Mizuno S, Nunoda S, et al. Clinical studies on diabetic myocardial disease using exercise testing with myocardial scinti- graphy and endomyocardial biopsy. Clin Cardiol 1986;9:375-82.
17) Solang L, Malmberg K, Ryden L. Diabetes mellitus and conges- tive heart failure: further knowledge needed. Eur Heat J 1999;
20:789-95.
18) Chang KS, Hong SP, Cho KK. A study on left ventricular function in diabetics by digitized echocardiography. Korean Circ J 1988;
18:93-102.
19) Park IS, Kim CM, Chun SS, et al. Early doppler echocardiogra- phic determination of left ventricular diastolic filling defect in adult onset diabetes mellitus. Korean Circ J 1990;20:174-84.
20) Ihm SH, Park IS, Youn HJ, Kim JH, Hong SJ, Choi KB. Impair- ment of right ventricular diastolic function in early type 2 diabetes.
Korean Circ J 2003;33:499-506.
21) Querejeta R, Varo N, Lopez B, et al. Serum carboxy-terminal propeptide of procollagen type I is a marker of myocardial fibro- sis in hypertensive heart disease. Circulation 2000;101:1729-35.
22) Tei C, Ling LH, Hodge DO, et al. New index of combined systolic and diastolic myocardial performance: a simple and reproducible measure of cardiac function? a study in normals and dilated cardiomyopathy. J Cardiol 1995;26:357-66.
23) Liu JE, Palmieri V, Roman MJ, et al. The impact of diabetes on left ventricular filling pattern in normotensive and hypertensive adults. J Am Coll Cardiol 2001;37:1943-9.
24) Palmieri V, Bella JN, Arnett DK, et al. Effect of type 2 diabetes mellitus on left ventricular geometry and systolic function in hy- pertensive subjects. Circulation 2001;103:102-7.
25) Bella JN, Devereux RB, Roman MJ, et al. Separate and joint effects of systemic hypertension and diabetes mellitus on left ven- tricular structure and function in American Indians (the Strong Heart Study). Am J Cardiol 2001;87:1260-5.
26) Factor SM, Bhan R, Minase T, Wolinsky H, Sonnenblick EH.
Hypertensive-diabetic cardiomyopathy in the rat: an experimental model of human disease. Am J Pathol 1981;102:219-28.