INTRODUCTION
The brackish lagoon in the eastern coastal part of S. Korea was generated by sand dunes. Salinity was generally higher due to the slow velocity of inflowing fresh water and frequent intrusion of seawater thus, greatly affecting the macrofauna (Cho et al., 1975). Due to the poor flushing condi- tions, the salinity was over 0.5‰, and thus en- abled to categorize the water body as brackish water (Horne, 1994). Well-developed aquatic plants were found in the littoral zone due to the
demoted water exchange. The lagoon’s brackish water has distinct functional properties and is characteristically different from the freshwater and seawater (Heo et al., 1999; Kwon, 2002; Hung, 2003). Serious dystrophic condition resulted in the stagnant anaerobic hypolimnion was unin- terrupted due to the formation of stratification (Pretus, 1989). Due to the shallow depths, wind is an important mixing factor in the brackish lagoons despite the formation of stratification (Smith, 1990; Arfi et al., 1993).
Estuaries and coastal lagoons (estuarine envi- ronments) are typical transitional ecosystems
─
─ 461 ──
*Corresponding Author: Tel: +82-33-570-6573, Fax: +82-33-574-7262, E-mail: [email protected]
The Limnological Survey of a Coastal Lagoon in Korea (4); Lake Songji
Kwon, Sangyong, Woo- -myung Heo
1, Sangha Lee
1, Dongjin Kim
2and Bomchul Kim
(Department of Environmental Science, Kangwon National University, Chunchon 200-701, Korea
1Department of Environmental Eng., Samcheok National University, Samcheok 245-711, Korea
2National Institute of Environmental Research, Incheon 220-041, Korea)
Physicochemical parameters, plankton community structure, and sediment were surveyed from 1988 to 2002, at two months interval, in a eutrophic coastal lagoon (Lake Songji, Korea). The lake basin is separated from the sea by a narrow sand dune, and a shallow sill divides the lake basin into two sub-basins. The stable stratifications and chemoclines are maintained all through the year at 1-2 m depth.
DO was often very low (⁄⁄1 mgO2∙L-1) in the monimolimnion. Secchi disc trans- parency was in the range of 0.5-2.7 m. TP, TN, and Chl. a concentration in the mixolimnion were 0.015-0.396 mgP∙L-1, 0.223-3.521 mgN∙L-1, and 0.5-129.8 mg∙m-3, respectively. TSI was in the eutrophic range of 54 to 62. Sediment was composed of silt and coarse silt. COD, TP, and TN content of the sediment were 51.4-116.9 mgO2∙ gdw-1, 0.04-1.46 mgP∙gdw-1 and 0.12-1.03 mgN∙gdw-1, respectively. The 49 phyto- plankton species were identified. The maximum phytoplankton abundance obscured the lake in September 2001 (max. density: 23,350 cells∙mL-1). The Chlorophyte Schroederia judayi was dominant species in summer (max. density: 20,417 cells∙mL-1).
The lake showed unique limnological features of a brackish lagoon in respect to biological community, chemical characteristics, and physical phenomena.
Key words : Lake Songji, brackish lagoon, trophic state, chemocline
between land and sea, where seawater is mixed with fresh water. It is well known that estuarine environments are very valuable ecosystems be- cause of their unique ecological functions and geographical features, as well as socioeconomic values. In lagoons, a unique ecological interac- tion is found as organisms of brackish water, seawater and freshwater coexists (Wonju Regional Environmental Office, 1997).
A narrow sill divides Lake Songji into southern and northern part. Lake Songji has the surface area of 0.563 km
2and the shoreline length of 5,560 m (Ministry of Environment, 2002). In com- parison with other lagoons in the eastern coastal areas of Korea, Lake Songji has fairly preserved aquatic flora and water quality. However, the mountain fire has destroyed the terrestrial eco- system of the drainage area. In the study of
“Evaluation of eutrophication of lagoons in the eastern coast of Korea” Heo et al. (1999) showed that most of lagoons of Korea are hyper-eutro- phic.
Earlier researches on Lake Songji were mostly done for short period and were primarily moti- vated towards collecting basic data of fisheries (Cho et al., 1975, Kim et al., 1981 and Pyen, 1984).
The southern part of Lake Songji yielded an average of about 100 tons per year of Corbiculidae (general name: Asian Clam) (Ministry of Environ- ment, 2002). The fish catch composed of both salt-water fishes such as mullet, dace, as well as fresh water fishes such as carp and crucian.
Lake Songji serves as an important stopover for migratory birds and is a habitat for endan- gered birds such as Whooper Swan (Cygnus) and Steller’s Sa-eagle (Haliaeetus pelagicus). (IUCN, 2005). A total of 1,675 birds were cited consisting of 7 different species in the year of 1999 (Birds International, 2001). Thus, Lake Songji has been officially designated as the sanctuary for birds and beasts since 1985.
This study was conducted to evaluate the limno- ecological characteristics from May 1998 to No- vember 2002 on bi-monthly basis. Various phy- sico-chemical parameters including temperature salinity, secchi disc transparency, TN, TP, organ- ic matter in sediment and Chl. a were measured.
Changes of dominant species and cell density of phytoplankton were also measured.
MATERIALS AND METHODS
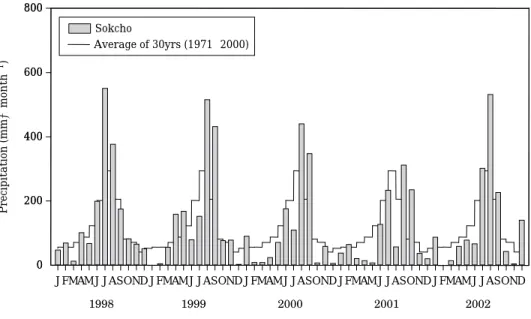
Lake Songji, located in the region of Gosung- gun, has an average yearly precipitation of 1,342 mm and the yearly average air temperature of 12.1� C. From June to September, about 60-80%
of yearly precipitation are recorded (Fig. 1). N and P generation in the drainage area was 55 kgN∙day
-1and 9 kgP∙day
-1respectively (Heo et al., 1999). Water samples collected from 1998 to 2002 for 5 sites (Fig. 2), were filtered with GF/C filter. The filter papers were kept frozen, and homogenized at the time of chlorophyll-a
0 200 400 600 800
JFMAMJ JASONDJFMAMJ JASONDJFMAMJ JASONDJFMAMJ JASONDJFMAMJ JASOND Precipitation (mm∙month-1)
0 200 400 600 800
Average of 30yrs (1971-2000) Sokcho
Fig. 1. Monthly variations of precipitation of Sokcho city.
analysis. Lorenzen’s (1967) method was used to calculate chlorophyll-a concentration. Filtrate was then used to calculate dissolved nitrogen and phosphorus. TP was determined according to Standard Methods (APHA, 1992), employing persulfate digestion and ascorbic acid method.
TN was determined by the cadmium reduction method after persulfate digestion, using a flow injection autoanalyzer (BRAN±LUEBBE, Auto Analyzer3). Temperature and salinity were mea- sured with a multiprobe meter (YSI, 6000). Tro- phic State Index (TSI) was calculated according to Carlson (1977). The phytoplankton samples were fixed by adding Lugol’s solution. The sam- ples were transported to the laboratory, and stor- ed for one week. The samples were concentrated by siphon and were counted under the optical microscope with the resolution of 400-600x. Pic- torial handbooks of Mizuno (1964) and Algae of Japanese Freshwater (Hirose and Yamagishi,
1977) were used as reference for the identifica- tion of phytoplankton. The sediment samples were used to measure the moisture content and total solid. COD of sediment was measured by using the wet samples, while TP and TN of sedi- ment were measured using dry samples after Kjeldal digestion method on the basis of the Stan- dard Method (APHA, 1992).
RESULTS AND DISCUSSION
1. Temperature, Salinity, DO and Secchi Disc transparency
During the study period, the average tempera- tures were in the range of 7.4-28.2� C (Table 1).
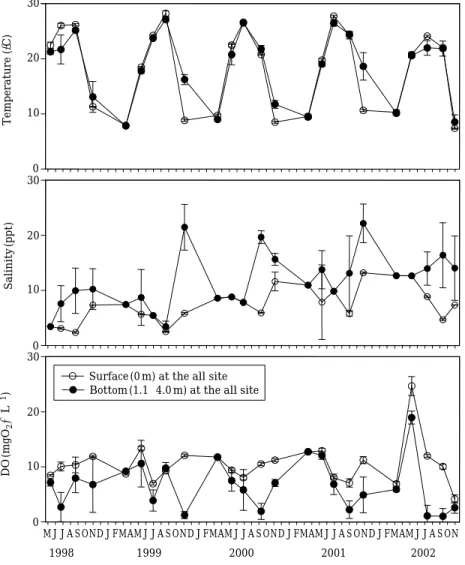
Although the minimum winter temperature cou- ldn’t be recorded as the lake freezes during the winter seasons, the maximum temperature was 28.7� C in September 1999. Seasonal variations of temperature of all the years were similar with comparable trends. Average salinity of mixoli- mnion at sites 2 and 3 were 7.7 and 7.7‰ res- pectively (Fig. 3). But the monimolimnion of the same sites showed higher average concentrations of 9.8, 11.6 and 13.3‰, respectively. Due to the frequent tidal interference, site 3 had higher salinity than other sites. The seasonal variation of salinity was in the lower ranges of 2.2-9.9‰
in the late rainy seasons (July to September).
Fig. 2. Map showing the watershed and sampling sites.
0 1 2 km
0 0.5 km
East sea
St. 2 St. 4
St. 1
St. 3 St. 5 N
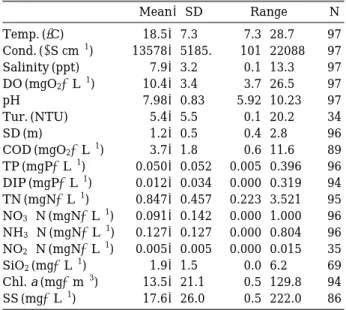
Table 1. A statistical summary of nutrients and the rele- vant hydrographical parameters.
Mean±SD Range N
Temp. (�C) 18.5±7.3 7.3-28.7 97 Cond. (µS cm-1) 13578±5185. 101-22088 97 Salinity (ppt) 7.9±3.2 0.1-13.3 97 DO (mgO2∙L-1) 10.4±3.4 3.7-26.5 97
pH 7.98±0.83 5.92-10.23 97
Tur. (NTU) 5.4±5.5 0.1-20.2 34
SD (m) 1.2±0.5 0.4-2.8 96
COD (mgO2∙L-1) 3.7±1.8 0.6-11.6 89 TP (mgP∙L-1) 0.050±0.052 0.005-0.396 96 DIP (mgP∙L-1) 0.012±0.034 0.000-0.319 94 TN (mgN∙L-1) 0.847±0.457 0.223-3.521 95 NO3-N (mgN∙L-1) 0.091±0.142 0.000-1.000 96 NH3-N (mgN∙L-1) 0.127±0.127 0.000-0.804 96 NO2-N (mgN∙L-1) 0.005±0.005 0.000-0.015 35 SiO2(mg∙L-1) 1.9±1.5 0.0-6.2 69 Chl. a (mg∙m-3) 13.5±21.1 0.5-129.8 94 SS (mg∙L-1) 17.6±26.0 0.5-222.0 86
Previous study done in Lake Songji (Kim et al., 1981) reported that the salinity in the mixolimnion and monimolimnion were in the range of 5.2- 9.4‰ and 6.6-16.9‰, respectively (July to No- vember). Pyen (1984) reported that salinity of Lake Songji was about 10‰ from February till June, then decreased to about 3‰ in August and increased to above 12‰ in December. Due to the seawater intrusion, the southern part of the lake
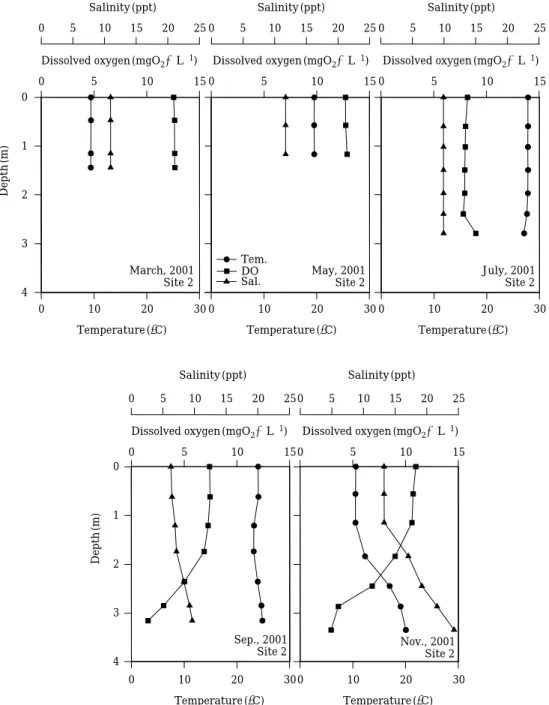
showed higher salinity concentration than the central and northern part. Higher variations in salinity were seen after the periods of high rain- fall and high tides. Seasonal variations of salin- ity showed lower concentrations in the summer season but higher in the spring season. Seasonal vertical variation of temperature, salinity and DO are show in Fig. 4. From March to September 2001, all the sites showed very low temperature
Temperature (�C)
0 10 20 30
Dissolved oxygen (mgO2∙L-1)
0 5 10 15
March, 2001 Site 2 Salinity (ppt)
0 5 10 15 20 25
Depth (m)
0
1
2
3
4
Temperature (�C)
0 10 20 30
Dissolved oxygen (mgO2∙L-1)
0 5 10 15
May, 2001 Site 2 Salinity (ppt)
0 5 10 15 20 25
Temperature (�C)
0 10 20 30
Dissolved oxygen (mgO2∙L-1)
0 5 10 15
July, 2001 Site 2 Salinity (ppt)
0 5 10 15 20 25
Temperature (�C)
0 10 20 30
Dissolved oxygen (mgO2∙L-1)
0 5 10 15
Sep., 2001 Site 2 Salinity (ppt)
0 5 10 15 20 25
Depth (m)
0
1
2
3
4
Temperature (�C)
0 10 20 30
Tem.
Dissolved oxygen (mgO2∙L-1)
0 5 10 15
DO
Nov., 2001 Site 2 Salinity (ppt)
0 5 10 15 20 25
Sal.
Fig. 3. Seasonal variations and vertical distribution on temperature, dissolved oxygen, and salinity at the site 2 and 3, March-November, 2001.
differences of about 1 and 2� C. In November, temperature of mixolimnion and monimolimnion in site 1 were 10.9� C and 15.7� C respectively.
Temperature of mixolimnion of sites 2 and 3 were about 10� C and 20� C respectively. Thus, temperatures below the metalimnion were higher than mixolimnion. The formation of chemocline in the metalimnion prevented vertical mixing (Heo et al., 1999; Heo et al., 2001; Kwon, 2002).
The seasonal variations of chemocline from Sep-
tember to November were higher. External for- ces such as wind, tides and inflowing water some- times destroys the chemocline (Uncles et al., 1990). Rainfall and tidal intrusion were of great significance as they highly affected the varia- tions of salinity (Hung, 2003). The distribution of salinity effects DO concentration. In November 1999, DO concentrations of mixolimnion were in the higher range of 11.8-12.3 mgO
2∙L
-1but DO concentration in the monimolimnion were in the
Temperature (�C)
0 10 20 30
Dissolved oxygen (mgO2∙L-1)
0 5 10 15
March, 2001 Site 3 Salinity (ppt)
0 5 10 15 20 25
Depth (m)
0
1
2
3
4
Temperature (�C)
0 10 20 30
Dissolved oxygen (mgO2∙L-1)
0 5 10 15
May, 2001 Site 3 Salinity (ppt)
0 5 10 15 20 25
Temperature (�C)
0 10 20 30
Dissolved oxygen (mgO2∙L-1)
0 5 10 15
July, 2001 Site 3 Salinity (ppt)
0 5 10 15 20 25
Temperature (�C)
0 10 20 30
Dissolved oxygen (mgO2∙L-1)
0 5 10 15
Sep., 2001 Site 3 Salinity (ppt)
0 5 10 15 20 25
Depth (m)
0
1
2
3
4
Temperature (�C)
0 10 20 30
Tem.
Dissolved oxygen (mgO2∙L-1)
0 5 10 15
DO
Nov., 2001 Site 3 Salinity (ppt)
0 5 10 15 20 25
Sal.
Fig. 3. To be continued.
range of 0.7-1.9 mgO
2∙L
-1(Fig. 4). Similarly, DO concentration below chemocline was at the lowest because of low oxygen solubility in saline water and high decomposition rate in monimo- limnion. Kim et al. (1981) pointed out that below the 3 m depth almost anoxic condition existed limiting the benthic organisms. Heo et al. (1999) reported that in most of the lagoons, in the eas- tern coast of Korea, chemocline is formed in the metalimnion and below the chemocline DO con- centration decreased while that of salinity incre- ased.
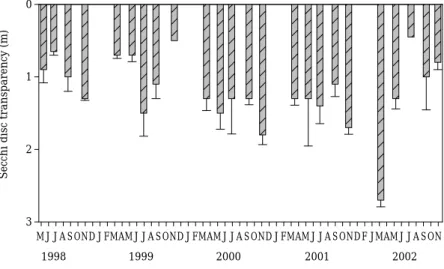
During the study period secchi disc transpar- encies were in the relatively lower range of 0.5±
0.0-2.7±0.1 m (Fig. 5). A trend of increase in the Secchi disc transparency over the Lake Songji can be observed from north to south, as the dis-
tance to the southern part was long enough for the suspended matters to settle on the way. The variations of secchi depth in each site showed similar trends at that of Lake Chongcho (Heo et al., 2001). In the study of Lake Hwajinpo, Kwon (2002) exhibited that secchi disc transparency decreased with the increases in the biomass of phytoplankton and suspended solid in the inflow- ing water during rainy seasons. Heo et al. (1999) showed that secchi disc transparency reduced to less than 1 m due to the higher suspended solid concentration and increase in biomass of phyto- plankton.
The presence of higher salinity, low DO in the mixolimnion, formation of round the year chemo- cline make most of the lagoons a unique habitat that is very different from general fresh water
M J S N J M M J S N J M M J S N J M M J S N J M M J S N DO (mgO2∙L-1)
0 10 20 30
Temperature (�C)
0 10 20 30
0 10 20 30
Salinity (ppt)
J A O D F A J A O D F A J A O D F A J A O D F A J A O Surface (0 m) at the all site
Bottom (1.1-4.0 m) at the all site
1998 1999 2000 2001 2002
Fig. 4. Seasonal variations of temperature, salinity and dissolved oxygen concentration.
lakes (Hong et al., 1962; Kim et al., 1998; Heo et al., 1999; Heo et al., 2000; Heo et al., 2001;
Kwon, 2002; Heo et al., 2004a, b, c; Heo and Kim, 2004).
2. Nutrients, chlorophyll a and trophic state
In September 1999, TP and DIP concentrations in the mixolimnion were high after rainy seasons (Fig. 6). During the study period, TP and DIP concentration in the mixolimnion were in the range of 0.015-0.396 mgP∙L
-1and 0.000-0.319 mgP∙L
-1respectively. The average TP concentra- tions in site 1 were the highest (0.064 mgP∙L
-1) and the concentrations in site 2 and 3 were 0.016
and 0.045 mgP∙L
-1respectively. Heo et al. (1999) and Kwon (2002) reported that phosphorus con- centration in the sites near the outlet were lower which is similar to the result of this study. Heo et al. (1999) reported that among the seven studied lagoons in eastern coast of Korea, Lake Songji has the lowest TP concentration. Similarly, DIP concentrations in Lake Songji were also lower than other lakes because watershed was rarely inhibited (Wonju Regional Environmental Office, 1997). This study showed that the average TP concentration were 0.050 mgP∙L
-1which is higher than the US EPA eutrophication classi- fication (1976) on the basis of TP concentration (0.020 mgP∙L
-1). Lake Songji is eutrophic as per
Phosphorus concentration (mgP∙L-1) 0.0 0.1 0.2 0.3 0.4 0.5
TP DIP
1998 1999 2000 2001 2002
M J S N J M M J S N J M M J S N J M M J S NJ A O D F A J A O D F A J A O D F A J A O DFJM M J S NA J A O
Fig. 6. Seasonal variations of TP and DIP concentration at study sites.
Secchi disc transparency (m)
0
1
2
3
1998 1999 2000 2001 2002 M J S N J M M J S N J M M J S N J M M J S NJ A O D F A J A O D F A J A O D F A J A O DFJM M J S NA J A O
Fig. 5. Seasonal variations of secchi disc transparency.
the guidelines set by the OECD (1980) has classi- fied lakes into eutrophic (0.035-0.100 mgP∙L
-1) on the basis of phosphorus concentration. DIP concentration of Lake Songji is 0.012 mgP∙L
-1, which is over the Sawyer (1947) limit of 0.010 mgP∙L
-1, when the harmful algae bloom begins.
Most of the lagoons in the eastern coast of Korea, including Lake Songji, have relatively longer hydraulic residence time, higher inflow of sus- pended particles and settlement rate, and com- paratively rapid annual life cycle of macrophytes around the littoral zone.
TN concentrations of the mixolimnion were in the range of 0.223-0.794 mgN∙L
-1with the highest concentration in September 2001 (Fig. 7).
The average TN concentrations of the northern and the southern part were 0.883 and 0.794 mgN∙L
-1respectively. Higher concentrations of TP and TN were found in the northern part. The concentrations of NO
3-N and NH
3-N were in the range of 0.000-1.000 mgN∙L
-1and 0.000- 0.804 mgN∙L
-1respectively. TN and NH
3-N concentrations didn’t showed much seasonal variations but the seasonal variations of NO
3-N concentration showed increasing trend after the rainy season but might be due to utilization of NO
3-by the bacteria in the absence of DO.
Very low concentrations of silicate (0.02-6.2 mgSi∙L
-1) were found from March to May. Sili- cate concentrations showed higher seasonal vari-
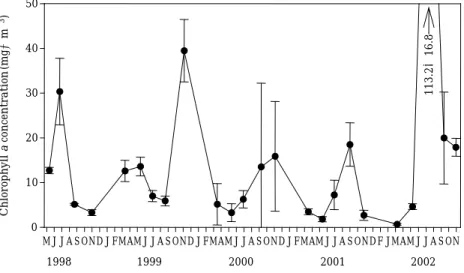
Chlorophyll a concentration (mg∙m-3) 0 10 20 30 40 50
1998 1999 2000 2001 2002
113.2±16.8
M J S N J M M J S N J M M J S N J M M J S NJ A O D F A J A O D F A J A O D F A J A O DFJM M J S NA J A O
Fig. 8. Seasonal variations of chlorophyll a concentration at study sites.
Nitrogen concentration (mgN∙L-1) 0 1 2 3 4
TN NO3-N NH3-N
1998 1999 2000 2001 2002
M J S N J M M J S N J M M J S N J M M J S NJ A O D F A J A O D F A J A O D F A J A O DFJM M J S NA J A O
Fig. 7. Seasonal variations of TN, NO3-N and NH3-N concentration at study sites.
ations. In the spring seasons, lower silicate con- centrations were found because of the utilization by the growing diatoms. So, silicate was the limi- ting nutrient for the phytoplankton growth (Mi- nistry of Environment, 2002).
Chl. a concentration of mixolimnion was in the range of 0.7±0.2-113.2±16.8 mg∙m
-3, with the highest concentration in July 2002 (Fig. 8). The average Chl. a concentration in each sites 1, 2, and 3 were 15.3, 15.2 and 16.0 mg∙m
-3respec- tively. US EPA (1976) classified lakes as eutro- phic if the Chl. a concentration is over 10 mg∙
m
-3. Forsberg and Ryding (1980) classified lakes as hyper-eutrophic if the Chl. a is over 40 mg∙
m
-3. As per these classifications, Lake Songji is classified as an eutrophic lake. TP, Chl. a, Secchi disc transparency and TN were used to calculate the Trophic State Index (TSI). Data of the grow- ing seasons (May to September) were used to calculate the TSI. The average TSI of Lake Song- ji were in the range of 54-62, with the highest value in 2000 (Table 2). Heo et al. (1999) showed that the average TSI value of lagoons in eastern coastal area were in the range of 59-77.
3. Sediment
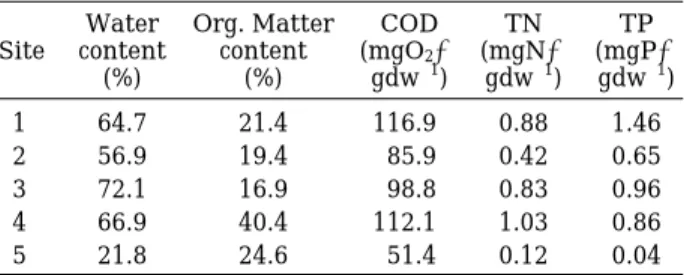
The average water content of sediment were in the range of 21.8-72.1%. Relatively lower sedi- ment depths and sediment water content were found near the areas of inflowing stream and tidal inlet point (Table 3). Particle size distribu- tion of the sediment of each site, excluding outlet and inlet areas, was in the range of 0-125 µ m.
The sediments of the inlet and outlet area con- tained more of coarse particles that the central part of the lake. Inlet area contained allochtho- nous sediments but the central part had much of autochthonous sediments such as organic mat- ter, debris of plants etc. COD concentration was in the range of 51.4-116.9 mgO
2∙gdw
-1(mean 93.0 mgO
2∙gdw
-1). This value is higher than Lake Hyangho, Lake Ssangho and Lake Maeho (Ministry of Environment 2002). Higher COD concentration was due to the narrow outlet, cau- sing much of degradable matter to reside in lake for longer time. In the outlet and inlet areas of the lagoon, relatively greater grain size distri- bution of particles were found, which is due to erosion, deposition of organic matter and debris of dead littoral plants, aquatic plants and microor- ganisms. The average organic content was about 24.5%, which is higher than Lake Hyangho, Lake Maeho and Lake Ssangho (Ministry of Environ- ment, 2002). TP and TN of the sediments were in the range of 0.04-1.46 mgP∙gdw
-1and 0.12- 1.03 mgN∙gdw
-1, respectively. The TN and TP concentration in site 5 were the lowest because this site is near the outlet area containing lower organic sediments.
4. Phytoplankton
During the survey period, a total of 49 phyto- plankton species were recorded (Fig. 9). The total density were in the range of 50-23,350 cells∙
mL
-1and with the highest cell density in Sep- tember 2001, when Chlorophyceae Schroederia ju- dayi dominated the cell density of 20,417 cells∙
mL
-1. In 2002 July, total density was 19,514 cells
∙mL
-1and the dominant species were Cyanoph- yceae Anabaena spiroides with the cell density of 12,218 cells∙mL
-1. Also during the same period, Chlorophyceae Schizochlamys gelatinosa were the subdominant species with cell density of 5,578 cells∙mL
-1. Heo et al. (1999) showed that most of lagoons in the eastern coastal areas of Korea were dominated by the Cyanophyceae.
Table 3. Water content and nutrient concentration of the sediment in Lake Songji.
Water Org. Matter COD TN TP Site content content (mgO2∙ (mgN∙ (mgP∙
(%) (%) gdw-1) gdw-1) gdw-1)
1 64.7 21.4 116.9 0.88 1.46
2 56.9 19.4 85.9 0.42 0.65
3 72.1 16.9 98.8 0.83 0.96
4 66.9 40.4 112.1 1.03 0.86
5 21.8 24.6 51.4 0.12 0.04
Table 2. TSI (trophic state index) in Lake Songji. TSI was calculated from warm season (May-Sept.) aver- age by surface water (SD: Secchi disc depth in m, CHL: chlorophyll a concentration in mg∙
m-3, TP: total phosphorus in mgP∙L-1, TN: to- tal nitrogen in mgN∙L-1).
TSI Average
SD CHL TP TN
1998 62 65 64 56 62
1999 59 60 59 56 58
2000 57 55 49 54 54
2001 57 56 57 57 57
2002 62 70 60 56 62
Kwon (2002) showed that in Lake Hwajinpo, Cyanophyceae were dominant in the summer.
These studies of phytoplankton communities were different that this lake excluding 1998, because in this study of Lake Songji Chlorophy- ceae and Bacillariophyceae dominated totally.
Kim et al. (1981) showed in the study of marine ecology of eastern coastal brackish lakes, phyto- plankton Coccone scutellum, Thalassiothrix frau- enfeldii, Cyclotella striata, Chaetoceros costatus and Amphora hyaline were dominant, and the marine species had the higher ratio of 53.3%.
0 5000 10000 15000 20000 25000
0 5000 10000 15000 20000 25000
(cells∙mL-1)
0 5000 10000 15000 20000 25000
0 5000 10000 15000 20000 25000 Total cell densityChlorophyceaeBacillarophyceae CyanophyceaeOthers
0 5000 10000 15000 20000 25000
1998 1999 2000 2001 2002
Ankistrodesmus falcatus Tetraspora sp. Tetraspora sp. Schizochlamys gelatinosa Schizochlamys gelatinosa Schizochlamys gelatinosa Schroederia judayi Chlorella sp. Schizochlamys gelatinosa
Cyclotella sp. Melosira sp. Coscinodiscus sp. Cyclotella glomerata Chaetoceros sp. Chaetoceros sp.
Oscillatoria sp. Oscillatoria sp. Oscillatoria sp. Oscillatoria sp. Anabaena spiroides Anabaena spiroides
Euglena sp. Euglena sp. Chlorella sp.
M JJ A O D F AS N J M M JJ A O D F AS N J M M JJ A O D F AS N J M M JJ A O D FS N JM M JA J A OS N
Fig. 9. Seasonal variations of phytoplankton cell density (cells∙mL-1) and dominant species.
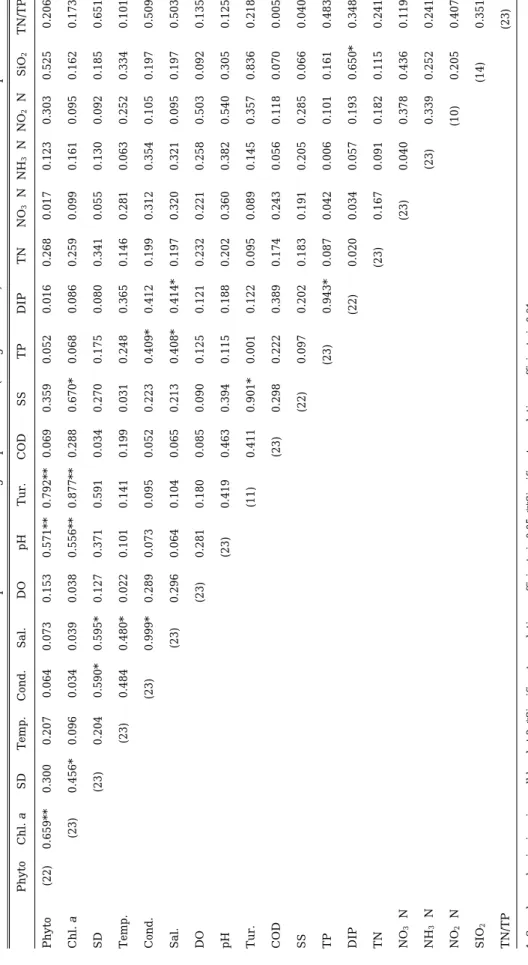
Table 4.Pearson correlation coefficients between nutrient species and limnological parameters(using st. 2 data). Refer to Table 1 for units of each parameter PhytoChl. aSDTemp.Cond.Sal.DOpHTur.CODSSTPDIPTNNO3-NNH3-NNO2-NSiO2TN/TP Phyto(22)0.659** -0.300 0.207 -0.064 -0.073 -0.153 0.571** 0.792** 0.069 0.359 0.052 0.016 0.268 -0.017 -0.123 0.303 0.525 -0.206 Chl. a(23)-0.456* 0.096 -0.034 -0.039 0.038 0.556** 0.877** 0.288 0.670* 0.068 -0.086 0.259 -0.099 -0.161 0.095 0.162 -0.173 SD(23)-0.204 0.590* 0.595* -0.127 -0.371 -0.591 -0.034 -0.270 -0.175 -0.080 0.341 0.055 -0.130 -0.092 -0.185 0.651* Temp.(23)-0.484 -0.480* -0.022 0.101 0.141 0.199 0.031 0.248 0.365 -0.146 0.281 -0.063 0.252 0.334 -0.101 Cond.(23)0.999* 0.289 0.073 -0.095 0.052 0.223 -0.409* -0.412 0.199 -0.312 -0.354 -0.105 -0.197 0.509* Sal.(23)0.296 0.064 -0.104 0.065 0.213 -0.408* -0.414* 0.197 -0.320 -0.321 -0.095 -0.1970.503* DO(23)0.281 -0.180 0.085 0.090 -0.125 -0.121 -0.232 -0.221 -0.258 0.503 -0.092 -0.135 pH(23)0.419 0.463 0.394 -0.115 -0.188 0.202 -0.360 -0.382 0.540 0.305 -0.125 Tur.(11)0.411 0.901* -0.001 -0.122 0.095 0.089 -0.145 -0.357 0.836 -0.218 COD(23)0.298 -0.222 -0.389 0.174 -0.243 -0.056 -0.118 0.070 0.005 SS(22)-0.097 -0.202 0.183 -0.191 -0.205 -0.285 0.066 0.040 TP(23)0.943* 0.087 -0.042 -0.006 0.101 0.161-0.483* DIP(22) -0.020 0.034 -0.057 0.193 0.650* -0.348 TN(23)-0.167 -0.091 -0.182 -0.115 0.241 NO3-N(23)0.040 0.378 0.436 -0.119 NH3-N(23)-0.339 0.252 -0.241 NO2-N(10)0.205 -0.407 SIO2(14)-0.351 TN/TP(23) 1. Sample number is given in small bracket 2. *Significant correlation coefficients is 0.05, **Significant correlation coefficients is 0.01
Eastern coastal lagoons have shallow depths and sometimes exchange occur with seawater and freshwater. So, for the living organism it’s diffi- cult to survive (Pyen, 1984). Also, net-planktons were found to be simple because of unstable brackish water condition (Cho et al., 1975). In the lagoon, fresh water species should adapt in high salinity and marine species should adopt in lower salinity. So, species diversity is generally low but due to the high nutrient content, bloom of some species occurs resulting in higher pri- mary productivity (Kim, 1997). In this study, the correlation coefficients were calculated between the biomass of phytoplankton and environmental factors. Chl. a, pH, and turbidity was proven to be the better indicators of environmental chang- es as they showed stronger correlation coefficient values of 0.659, 0.571, and 0.792 respectively (Table 4). Phytoplankton communities showed no significant correlation coefficient with other envi- ronmental gradients except a positive value of 0.525 with silicate. So, silicate is thought to be the limiting factor in the growth of diatom.
CONCLUSION
To manage the water quality of Lake Songji and to increase its limnological value, the chemo- cline should be destroyed so that the turnovers can occur more frequently which will supply the benthic reason with higher DO concentrations.
The decomposition of the organic carbon in the sediment will help in enhancing the water qua- lity of the Lake Sonji.
The response of plankton biomass and struc- ture to changing water chemistry, which might be either due to the changes in meteorological and inflow conditions or human induced changes such as reduction in the lake level, will continue.
To slow down the eutrophication rate of Lake Songji and to maintain a well-oxygenated moni- molimnion, the seawater intrusion should be con- trolled by artificially constructing a more effec- tive dike which facilitates the constant exchange of sea water and fresh water. The experiences from other lagoons in Korea teach us that the watershed area should be properly managed to reduce the ever-increasing concentrations of the allochthonous materials, especially anthropogenic inflows. Also, the storm-water should be con- trolled by constructing either a settling pond with
fully developed macrophytes on the littoral regi- ons or a diversion for storm-water in the upstr- eam area. But, any future advances must be con- ditioned by an awareness of current deficiencies.
LITERATURE CITED
Arfi. R., D. Guiral and M. Bouvy. 1993. Wind Induc- ed Resuspension in a Shallow Tropical Lagoon.
Estuarine, coastal and shelf science 36: 587-604.
APHA. 1992. Standard methods for the examination of water and wastewater. 18th Ed., American Public Health Association, Washington. DC., 1801 pp.
Carlson, R.E. 1977. A trophic state index for lakes.
Limnol. Oceanogr. 22: 361-369.
Arfi. R., D. Guiral and M. Bouvy. 1993. Wind Induced Resuspension in a Shallow Tropical Lagoon. Estu- arine, coastal and shelf science 36: 587-604.
Cho, K.S., S.U. Hong and K.H. RA. 1975. The Com- parative Study of Limnological Conditions and Plankton Fauna of Brackish Water in the East Coast of Korea. Kor. J. Limnol. 8: 25-37.
Forsberg, C. and S.O. Ryding, 1980. Eutrophication parameters and trophic state indices in 30 swe- dish waste receving lake, Arch Fur Hydrobiol. 89:
189-207.
Heo, W.M., B. Kim and M.S. Jun. 1999. Evaluation of Eutrophication of Lagoons in the Eastern Coast.
Kor. J. Limnol. 32(2): 141-151.
Heo, W.M., S.Y. Kwon, B. Kim and J.H. Park. 2000.
Long-term variation of water quality in Lake An- dong. Kor. J. Limnol. 33(3): 260-266.
Heo, W.M., S.K. Lee, S.Y. Kwon, D.J. Kim and B.
Kim. 2001. The Limnological Survey of Lagoons in the Eastern Coast of Korea (1): Lake Chungcho.
Kor. J. Limnol. 34(3): 206-214.
Heo, W.M., S.Y. Kwon, J. Lee, D.J. Kim and B. Kim.
2004a. The limnological survey of a coastal lagoon in Korea (2): Lake Hyangho. Kor. J. Limnol. 37(1):
1-11.
Heo, W.M., S.Y. Kwon, J. Lee, D.J. Kim and B. Kim.
2004b. The limnological survey of a coastal lagoon in Korea (2): Lake Hwajinpo. Kor. J. Limnol.
37(1): 12-25.
Heo, W.M., S.Y. Kwon and B. Kim. 2004c. The Limnological Survey and Phosphorus Loading of Lake Hoengsung. Kor. J. Limnol. 37(4): 411-422.
Heo, W.M. and B. Kim. 2004. The effect of artificial destratification on phytoplankton in a reservoir.
Hydrobiologia, 524(1): 229-239.
Hirose, H. and T. Yamagishi. 1977. Illustration of the Japanese fresh-water algae. Uchidarokakuno Pu- blishing Co.
Hong, S.U., K.S. Cho and K.H. RA. 1962. Studies on the Chemical Conditions and Plankton in the Hwajin-po lake. Kor. J. Limnol. 2: 35-42.
Horne, A.J. and C.R. Goldman. 1994. Limnology, 2nd ed. MaGraw-Hill, New York, etc., 576 pp.
Hung, J.J. and P.Y. Hung. 2003. Carbon and nutrient dynamics in a hypertrophic lagoon in southwes- tern Taiwan. Journal of Marine Systems 42: 97- 114.
IUCN. 2005. Red list category.
Kim, J.M., S.K. Yi, S.B. Hue and D.Y. Kim. 1981.
Marine Ecological Study on Three Brackish Lakes along the East Coast of Korea. Bulletin of KORDI.
3: 29-37.
Kim, I.H. 1997. Fauna of Coastal Lagoons on the Eastern Coast of Korea. Proceedings of the First Korea-Japan Joint Symposium on the Lake En- vironments in the Coastal Region of the East Sea.
pp 33-47.
Kim, B., J.H. Park, B.J. Lim, W.M. Heo, G. Hwang, K. Choi and K.S. Chae. 1998. The limnological survey of major lakes in Korea (2): Lake Hapchon.
Kwon, S.Y. 2002. Limnoecological Study of Lake Hwajinpo. Graduate School thesis. Samcheok Na- tional University.
Lorenzen, C.J. 1967. Determination of chlorophyll and pheo-pigments: Spectrophotometric equa- tion. Limnol. Ocenogr. 12: 343-346.
Ministry of Environment. 2002. Natural environmen- tal research of wetland in Korea (In Korean).
Mizuno, T. 1964. Illustrations of the freshwater plankton of Japan. Hoikusa publishing co., LTD.
OECD. 1980. OECD Eutrophication programme-re- gional project alpine lakes, Swiss Federal Board
for Environmental Protection OECD.
Pretus, J.L. 1989. Limnologia de la Albufera de Me- norca Menorca, Espana. Limntica 5, 69-81. In P.
Lopez. 2003. Effect of changes in water salinity on ammonium, calcium, dissolved inorganic carbon and influence on water/sediment dynamics. Estu- arine, coastal and shelf science. 56: 943-956.
Pyen, C.K. 1984. Environmental and Biological Sur- vey at the Five Brackish Lakes in Kang won-do.
Cheju National University Journal. 18: 93-105.
Sawyer, C.N. 1947. Fertilisation of lakes by agricul- tural and industrial drainage. New England Wa- ter Works Association. 61: 109-27.
Smith, N.P. 1990. Wind domination of residual tidal transport in a coastal lagoon. In: Cheng. R.T.
(ed.), Residual Currents and Longterm Transport.
New York: Springer-Verlag. pp 123-133.
Uncles, R.J., J.E., Ong and W.K. Gong. 1990. Obser- vations and analysis of a stratification-destratifi- cation event in a tropical estuary. Estuarine, coa- stal and shelf science 31: 651-665.
U.S. EPA. 1976. Water Quality Criteria Research of the U. S. Environmental Protection Agency, Pro- ceeding of and EPA Sponsord Symposium, EPA- 600 (3-76-079): 185.
Wonju Regional Environmental Office. 1997. Impro- vement countermeasure for the water quality management of lagoons in the East Sea. 145p.
(Manuscript received 4 November 2005, Revision accepted 10 December 2005)
⁄ ¤
동해안 석호의 육수학적 조사
(4);
송지호권상용∙허우명1∙이상하1∙김동진2∙김범철 (강원대학교 자연과학대학 환경과학과
1삼척대학교 환경공학과, 2국립환경과학원)
송지호 표층의 평균 수온은 겨울 결빙기를 제외하고는 7.4-28.2�C로 최저 7.3�C 및 최고 28.7�C 이였다. 표층의 염분은 0.1-13.3‰의 범위로 분포하였으며, 중층 부근에서 화학성층이 형성되었다. 화학성층이 강하게 나타났던1999년 11월 표층의 용존산소는 11.8-12.3 mgO2∙L-1이었으나, 심층 에서는 0.7-1.9 mgO2∙L-1으로 매우 낮았다. 표층의 총인과 용존무기인의 농도는 각각 0.005- 0.396 mgP∙L-1및 0.000-0.319 mgP∙L-1의 범위이였으며, 북호와 남호의 대표 정점으로 볼 수 있는 정점2와 3에서의 평균농도는 각각0.061 및 0.045 mgP∙L-1로 북호쪽의 농도가 더 높았다. 표층의 총질소(TN)는 0.223-3.521 mgN∙L-1로 분포하였으며, 북호와 남호의 평균농도는 각각 0.883 및0.794 mgN∙L-1로 총인과 마찬가지로 북호쪽에서 높았다. 질산성질소(NO3-N) 및 암모니 아성질소(NH3-N)의 농도는 각각0.000-1.000 mgN∙L-1및 0.000-0.804 mgN∙L-1이였다. 규소농 도는0.0-6.2 mgSi∙L-1의 범위로3-5월에 매우 낮았으며, 계절적인 변화가 뚜렷히 나타났다. 저질 의 입자는 0-125인 silt 및 coarse silt로 이루어져 있으며, COD는 51.4-116.9 mgO2∙gdw-1로 평 균 93.0 mgO2∙gdw-1이였다. 저질내의TP 및 TN의 농도는 각각0.04-1.46 mgP∙gdw-1및 0.12- 1.03 mgN∙gdw-1이었다. 표층의 엽록소 a의 정점별 평균값은 정점 1, 2 및 3에서 각각 15.6, 15.2 및 16.0 mg∙m-3으로 유사하였다. 식물플랑크톤은 총 49종이 출현하였으며, 생물량은 50-23,350 cells∙mL-1로 2001년 9월에 가장 많았다. 이 시기의 우점종은 녹조류인 Schroederia judayi이였 으며, 생물량은20,417 cells∙mL-1이였다.
송지호의 수질을 개선하기 위해서는 인위적으로 화학성층을 파괴시켜 심층에 용존산소를 공급시 켜야 할 것으로 판단되며, 모래톱으로 인해 막혀져 있는 해수교환을 항상 원할 하게 유지될 수 있 도록 하는 것이 필요할 것으로 판단된다.