INTRODUCTION
Coastal aquatic environments are disturbed by nutrient enrichment from inland waters (Bishop
et al., 2006; Paerl, 2006; Martins et al., 2007): (1)the accumulations of biomass and oxygen deple- tion in bottom water, (2) the outbreak of toxic phy- toplankton (dinoflagellate), (3) changes in the pl- ankton community and size structure, (4) changes in macroalgae productivity, (5) changes in the benthic organism structure.
Total nitrogen and total phosphorus loadings
are influenced by their geographic locations rele- vant to discharge, watershed land use and water runoff (Caccia and Boyer, 2007; Hyfield et al. 2008).
The control of nutrient loading from point and non- point sources have been implemented in North America and Europe coasts (Whitall et al., 2004;
Kronvang et al., 2005). A study on estuarine tro- phic state may be important since nutrient load- ing and coastal estuarine water quality change by freshwater input in Korea. Understanding the linkage between nutrient loading and coastal water quality is required to manage the water quality and ecosystem. The trophic index (TRIX)
─
─ 337 ──
* Corresponding author: Tel: 061) 240-7312, Fax: 061) 240-7301, E-mail: [email protected]
Estimation of Nutrient Loading and Trophic States in a Coastal Estuary
Bach, Quang-Dung and Yongsik Shin*
(Division of Ocean System Engineering, Mokpo National Maritime University, Mokpo 530-729, Korea)
We investigated nutrient loading and trophic states in a coastal estuarine system in the Asan estuary by assessing phytoplankton biomass and using the trophic index (TRIX). The monthly and yearly nutrient loading (TN, TP) from freshwater discharge from the Asan and Sapgyo reservoirs into the estuary were estimated and analyzed with related factors. Monitoring data (physio-chemical and biological variables) col- lected at five estuary stations were used to assess trophic states. Descriptive statistics of total phytoplankton cells, chl a concentrations and primary productivity were also used to assess seasonal trophic status. N loading from freshwater ranged 1.0~1.3×10⁴ ton yearly. The yearly P loading ranged between 350 and 400 ton during 2004~2006, increasing to 570 ton in 2007. Regression results suggest that DIN and DSi were corre- lated with freshwater discharge at the upper region. Based on phytoplankton biomass and total cell abundance, the trophic state of the estuary was found to be eutrophic during spring due to phytoplankton bloom. Primary productivity level was remarkably high, especially in summer coinciding with high nutrient loading. Pheopigments increased during warm seasons, i.e. summer and fall. Trophic index results indicate that the trophic state varied between mesotrophic and eutrophic in the estuary water body, especially in the upper region. The results suggest that phytoplankton produc- tion was regulated by nutrient loading from freshwater whereas biomass was affected by other properties than nutrient loading in the Asan Estuary ecosystem.
Key words : coastal estuary, nutrient loading, trophic states, phytoplankton
was introduced by Vollenweider et al. (1998) to evaluate the trophic condition of seawater. The TRIX index has been applied to characterize coas- tal waters in Europe (Giovanardi and Vollenwei- der, 2004; Pettine et al., 2007; Luˇsi´c et al., 2008).
The index was used in this study since it is a com- posite index including four state variables (Chl-a, DIN, TP and oxygen) that represent stressor, bio- logical response and environmental disturbance in water column.
The study site, Asan estuary is under influence of monsoonal force and also experiencing environ- mental disturbance from the construction of em- bankments (reservoirs) in its coastal regions. The trophic state of the estuary based on phytoplank- ton community and trophic index, however, has not been documented especially related to nutrient loadings. The aim of this study is to evaluate the trophic state of Asan Estuary receiving freshwater inputs from lakes by assessing phytoplankton biomass, phytoplankton cells, primary productivity and trophic index.
MATERIALS AND METHODS
1. Study site and sample collection
Sapgyo, Asan, Daeho, Seokmoon and Namyang embankments were constructed in the upper region of the Asan estuary since 1970s (Fig. 1).
The large scaled national industrial complex was constructed along the coastal of the Asan estuary.
The freshwater from embankments interacts with seawater when the gates of embankments are opened. Five stations were selected along the axis of the Asan Estuary from February 2004 to November 2007. Water samples were collected monthly or seasonally 0.5 m below surface by using Niskin water sampler.
2. Environmental variables
Salinity and DO were measured by YSI
®Model 6600 multiparameter probe. Ambient nutrients (NO
2-, NO
3-, NH
4+
+
, PO
43-, DSi) were analyzed by using Bran Luebbe autoanalyzer (Parsons et al., 1984). Monthly data TN, TP concentrations from freshwater in Asan and Sapgyo lakes were obtain- ed from the water quality monitoring program (Korea Ministry of Environment). Precipitation data were collected by Korea Meteorological Ad- ministration. Data for freshwater discharge from the embankment were collected by Korean Agricul- tural Administration. Nutrient loadings from fresh- water were estimated by multiply of monthly nu- trient concentrations at the stations near dikes of Asan and Sapgyo lakes with monthly freshwater discharge of each lake through the gates of dikes.
3. Biological variables
For determination of chl a, 200 mL of sampled water was filtered through Whatman
®25 mm GF/
F glass microfibre filters (0.7 μm) under minimal vacuum (⁄100 mm Hg). The filters were placed in dark test tubes pre-filled with 8 mL extraction solution (90% acetone and 10% distilled water).
After storage for 12 h at 4� C, chl a was measured on a Turner Designs
®10-AU Fluorometer. The determinations of pheopigments were applied by acidification method (adding two drops of HCl (2N)). Pheopigments can be detected in egested fecal materials of grazers or during senescence as a result of poor growth environments or pro- longed exposure to the dark due to converted chl
a. The ratio of chl a and pheopigments (Chl : Pheoratio) (the lower the ratio, the higher the grazing rates or senescence) is an indirect measure of gaz- ing activity or poor condition for phytoplankton growth (Welschmeyer and Lorenzen, 1985).
Phytoplankton samples for each station were dispensed into 1 L in the bottle with 5 mL Lugols solution (I
2final concentration: 250 mg L
-1). After sampling, the samples were kept in the laboratory for at least 48 h to allow phytoplankton to settle
N
5 km
Sapkyo
As Daeho
Namyang
St.1 Seokmoon
N
5 km
Sapkyo
As Daeho
Namyang
Seokmoon
N
5 km
Sapkyo
Asan Daeho
Namyang
Seokmoon St.2 St.3 St.5
St.4 37.1
36.9
36.7
36.5
Latitude(�N)
Longitude (�W)
126.3 126.4 126.5 126.6
Fig. 1. Field study stations and embankments in the Asan Estuary upper region (South Korea).
down. After the storage, 800 mL surface water of the samples were slowly decanted. The remaining 200 mL sample was mixed and 1 mL of it was examined under Sedgwick-Rafter counting cham- ber (50×20×1 mm). Phytoplankton cells were counted in 200 chambers using Axioskop
®2 MAT (ZEISS).
Primary productivity was conducted by Kwangju University using
14C-uptake technique. Surface water samples at noontime were dispensed into 250 mL polycarbonate bottles. Samples were then inoculated with 0.5 mL
14C-NaHCO
3solution and incubated for 3 h. After the in situ incubation, unincorporated
14C was filtered through GF/F fil- ters. Each filter was fumed overnight in 0.25 mL 0.5N HCl to remove residual
14C activity.
14C ra- dioactivity was determined using liquid scintilla- tion counter after inserting 10 mL of scintillation cocktail. Primary productivity was integrated by radioactivity, total C and incubation time.
4. Trophic index and statistic analysis
The trophic status classification of coastal water in Asan Estuary was evaluated using trophic status index (TRIX) developed by Vollenweider et
al. (1998).TRIX= =(Log
10[Chl-
a *a%DO*N*P]++1.5)/1.2 (1) The trophic index (TRIX, Eq. 1) is a linear com- bination of the logarithms of four state variables (Chl a, N, P and the absolute percentage deviation of oxygen saturation from 100% (a%DO)). We used DIN for N and DIP for P in this study. The index is scaled from 0 to 10 for oligotrophy-hypertrophy, wide range of trophic conditions and divided into four classes: 2⁄TRIX⁄4 (high), 4⁄TRIX⁄5 (good), 5⁄TRIX⁄6 (moderate), 6⁄TRIX⁄8 (poor). Exces- sive 5 TRIX units of water body are considered as not good state.
Simple linear regression analysis was applied
0 300 600 900
0 200 400 600
Jan-04 Jul-04 Jan-05 Jul-05 Jan-06 Ju1-06 Jan-07 Jul-07
0 1 2 3
(A)
(B)
(C)
Monthly discharge (103km3 month-1)Yearly discharge (106 km3 year-1)Monthly precipitation (mm month-1)
2004 2005 2006 2007
Fig. 2. Monthly (A) and yearly (C) freshwater discharge (Asan and Sapgyo dikes) into the Asan Estuary between 2004 and 2007, monthly precipitation (B) in the upper area.
to investigate correlation between salinity versus concentrations of NO
2-++NO
3-, NH
4+
+
, DIN, PO
43-, DSi. Descriptive statistics were applied to explore the seasonal and spatial variations of chl a con- centrations, total phytoplankton cells, primary productivity, Chl : Pheo ratio and TRIX index using box and whisker plots. ANOVA analysis was used for statistical significance of spatial variations during each season.
RESULTS 1. Nutrient loading
Water discharge and precipitation peaked from July to September (Fig. 2A, 2B). Monthly TN, TP loadings were shown in Fig. 3A, 3B. The loadings were generally high during the wet season (July
0 2000 4000 6000
Jan-04 Jul-04 Jan-05 Jul-05 Jan-06 Jul-06 Jan-07 Jul-07 0
100 200
0 4000 8000 16000
12000
2004 2005 2006 2007
0 200 400 600
TN loading (ton month-1)TP loading (ton month-1)Yearly TP loading (ton year-1)Yearly TN loading (ton year-1)
(A)
(B)
(C)
(D)
Fig. 3. Monthly and yearly TN, TP loading from freshwater discharge (Asan and Sapgyo dikes) into the Asan Estuary between 2004 and 2007.
~September) coinciding with increase of discharge as well as high precipitation (Fig. 2A, 2B). Similar pattern was observed between yearly discharge and TP loading (Fig. 2C, 3D). Yearly TP loading dramatically increased to ~570 (ton year
-1) in 2007 from 350~400 (ton year
-1) in 2004~2006.
However, TN loading in 2007 decreased despite that the discharge had increased (Fig. 2C, 3C).
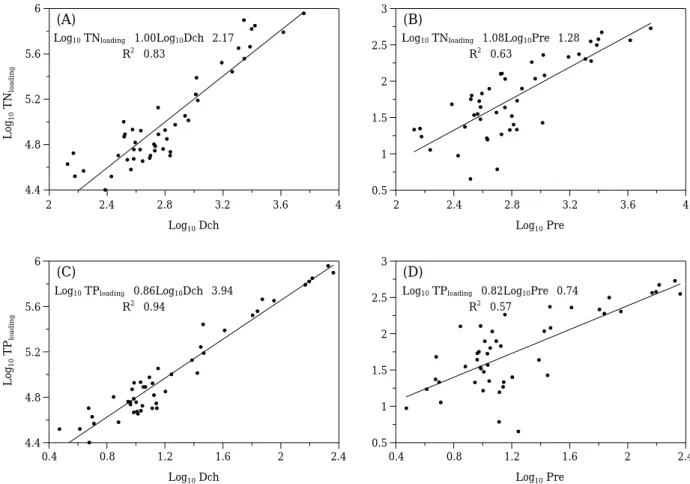
The relationships of TN, TP loading with discharge and precipitation were shown in Fig. 4. The effect of discharge on TN loading (r
2= =0.83) was more significant than that of precipitation (r
2= =0.63) in the watershed area (Fig. 4A, 4B). The difference between the effect of discharge and precipitation on TP loading was presented in Fig. 4C and Fig.
4D. Table 1 shows correlation between salinity (hydrodynamic variable) versus ambient nutrients.
Nitrite
++nitrate was negatively and significantly correlated with salinity at the upper region (r
2= = 0.37~0.44, P⁄0.01). Ammonium was also corre- lated in this region (r
2= =0.28~0.34, P⁄0.01). DIN
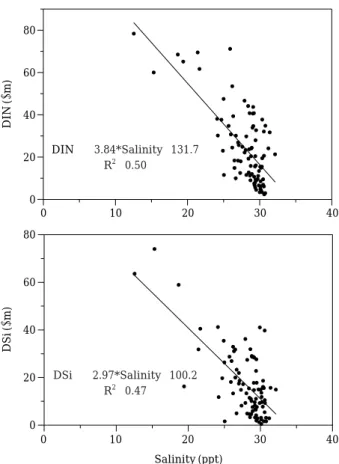
(nitrite, nitrate and ammonium) also had a signi- ficant correlation with salinity. Orthophosphate was not correlated with salinity. However, dis- solved silicate was evidently affected by dilution at upper region (r
2= =0.26~0.54, P⁄0.01). DIN and DSi concentrations in Stations 1, 2, 3 were nega- tively correlated with salinity (Fig. 5).
2. Trophic characteristics
Phytoplankton cells were higher during spring (February~May) and decreased during summer (June~August) and fall (September~November) (Fig. 6). Based on total cells and trophic criteria for phytoplankton cells (Fig. 6), the trophic state of the Asan Estuary was mesotrophic or eutrophic.
Median values reached over eutrophic/mesotrophic level (1.9×10
5cells L
-1). Maxima of total phyto- plankton cells at the upper region were 7.0~7.5
×10
5cells L
-1in spring. Chl a concentrations were high during spring (up to 44 μg L
-1) (Fig. 7).
4.4 4.8 5.2 5.6
6 (A)
2 2.4 2.8 3.2 3.6 4
Log10 Dch Log10 TNloading
4.4 4.8 5.2 5.6
6 (C)
0.4 0.8 1.2 1.6 2 2.4
Log10 Dch Log10 TPloading
(B)
2 2.4 2.8 3.2 3.6 4
Log10 Pre 1
2 3
0.5 1.5 2.5
(D)
0.4 0.8 1.2 1.6 2 2.4
Log10 Pre 1
2 3
0.5 1.5 2.5
Fig. 4. Monthly relationship of log-transformed TN, TP loading (ton) versus log-transformed discharge (Dch, ×1,000 m3) and precipitation (Pre, mL).
Log10TNloading==1.00Log10Dch++2.17 R2==0.83
Log10TNloading==1.08Log10Pre++1.28 R2==0.63
Log10TPloading==0.86Log10Dch++3.94 R2==0.94
Log10TPloading==0.82Log10Pre++0.74 R2==0.57
The concentrations reached to eutrophic level (¤7 μg L
-1) at the upper region. In summer, chl
a concentrations decreased to mesotrophic level(¤2 and⁄7 μg L
-1). In fall, chl a concentrations futher decreased to oligotrophic level. Surface pri- mary productivities were high at Station 1 during spring whereas the values increased during sum- mer and fall, especially at the lower region (Fig.
8). Fig. 9 showed that the Chl : Pheo ratios were lower during summer and fall than spring at all stations.
The surface TRIX values in the Asan Estuary were presented in Fig. 10. The TRIX values were general higher than 6 (reaching up to 7.2 in spring) at the upper region. TRIX values were higher in spring than in summer and fall. TRIX values were low at the lower region. At station 5, TRIX values were generally within the range of 5~6 (Fig. 10).
The results from ANOVA analyses shows that chl a concentrations were significantly different
between stations during spring and all seasons and TRIX values were significantly different dur- ing spring, summer, fall and all seasons (Table 2).
DISCUSSION
Nutrient loading from freshwater is considered as one of the main sources of eutrophication in estuary coasts (Fisher et al., 2006; Clarke et al., 2006). Increase in nutrient loading to coastal waters is related to rapid increase in the total and urban population (Billen et al., 2007) and to
(A) Spring
(B) Summer
(C) Fall Total phytoplankton cells(cells L-1)
106
105
104
103
106
105
104
103
106
105
104
103
Station 1 Station 2 Station 3 Station 4 Station 5 Eutrophic
Mesotrophic
Oligotrophic Eutrophic
Mesotrophic
Oligotrophic Eutrophic
Mesotrophic
Oligotrophic
Fig. 6. Box and whisker plots of seasonal total phytoplank- ton cells (2004~2007) in surface water from five stations in the Asan Estuary (upper and low dashed line are phytoplankton cell numbers for Eutrophic/
Mesotrophic (188,334 cells L-1) and Mesotrophic/
Oligotrophic (4,160 cells L-1) levels in ecological indices (Kitsiou and Karydis, 2000)).
0 10 20 30 40
0 10 20 30 40
0 20 40 60 80
DIN(μm)DSi(μm)
0 20 40 60 80
Salinity (ppt) DIN==-- 3.84*Salinity++131.7
R2==0.50
DSi==-- 2.97*Salinity++100.2 R2==0.47
Fig. 5. Relationship between ambient DIN, DSi concentra- tions versus hydrodynamic variable (surface salinity) at the upper region (station 1, 2, 3), monitored bet- ween 2004 and 2007 in the Asan Estuary.
the increase of atmospheric nitrogen deposition rate (Scudlark et al., 2005), frequency and inten- sity of precipitation (Yin and Harrison, 2008). In this study, TN and TP loadings were more closely related to the discharge from Asan and Sapgyo lakes. The relationship between ambient nutrients and salinity in Fig. 5 and Table 1 suggests that freshwater discharge directly affected nutrient enrichments in the Asan Estuary. The discharge was related with precipitation in watershed area.
Wen et al. (2008) also documented that nitrogen and phosphorus come mainly from urban discharge but silicate is produced from erosion of rocks in
watersheds.
In the Asan Estuary, nutrient loading was high during June-September whereas total phytoplank- ton cells and chl a concentrations were high during spring from February to May. The chl a concent- rations spatially, varied (Table 2) suggesting that upper regions have a better condition for phyto- plankton growth than lower regions. No direct effect of nutrient loading on phytoplankton bio- mass has been detected in the Asan Estuary water.
This pattern is different from other estuaries where phytoplankton responded to nitrogen and phosphorus enrichment (e.g. Smith, 2006). How- ever, the loading may be an important mechanism to increase primary productivity. In this study, primary productivity was significantly high (up to 344 mg C m
-3h
-1) in summer (June~August),
1
1
(A) Spring
(B) Summer
(C) Fall
Station 1 Station 2 Station 3 Station 4 Station 5 10
1 10
10 Total chlorophyll a(μg L-1)
Eutrophic
Mesotrophic
Oligotrophic
Eutrophic
Mesotrophic
Oligotrophic
Eutrophic
Mesotrophic
Oligotrophic
(A) Spring
(B) Summer
(C) Fall
Station 1 Station 2 Station 3 Station 4 Station 5 100
10
1
100
10
1
100
10
1 Primary productivity(mgC m-3 h-1)
Fig. 7. Box and whisker plots of seasonal total phytoplank- ton biomass (chlorophyll a) (2004~2007) in surface water from five stations in the Asan Estuary (upper and low dashed line are chlorophyll a concentrations for Eutrophic/Mesotrophic (7μg L-1) and Mesotro- phic/Oligotrophic (2μg L-1) levels (Molvaer et al., 1997)).
Fig. 8. Box and whisker plots of seasonal primary produc- tivity (2004~2007 measurements) in surface water from five Asan Estuary stations.
especially at the lower region. The results suggest that nutrient loading from freshwater may cause the increase of phytoplankton productivity at the lower region where turbidity and flushing rates are lower than the upper region turbidity and flushing rates are high. The low Chl : Pheo ratios during summer and fall suggest that rapid changes of water properties or enhanced grazing activities limit the increase of phytoplankton biomass dur- ing the warmer season. Especially high flushing rate may induce the decrease of phytoplankton biomass at the upper region during the wet season.
Assessment of trophic states to define eutrophi- cation of coastal estuarine systems is important for coastal environmental management and pro- tection. Assessment of trophic conditions of coas- tal waters is based on: (1) the biochemical composi-
tion of sediment organic matter, (2) chl a and pri- mary productivity scales, (3) ecological indices, (4) implement of estuarine trophic status model (ASSETS), (5) log-transformation of chl a, oxygen
(A) Spring
(B) Summer
(C) Fall
Station 1 Station 2 Station 3 Station 4 Station 5 2
1.6
1.2
2
1.6
1.2
2
1.6
1.2
Chl:Pheo
(A) Spring
(B) Summer
(C) Fall
Station 1 Station 2 Station 3 Station 4 Station 5
TRIX scale
8 7 6 5 4 3 8 7 6 5 4 3 8 7 6 5 4 3
Poor
Moderate Good High
Poor
Moderate Good High
Poor
Moderate Good High
Fig. 9. Box and whisker plots of seasonal Chl a: Pheopig- ments ratios (2004~2007 measurements) in surface water from five Asan Estuary stations.
Fig. 10. Box and whisker plots of seasonal TRIX (2004~
2007) in surface water from five Asan Estuary stations.
Table 1. Results (r2) of linear regression analysis of surface salinity (ppt) versus ambient nutrients, includ- ing NH4
+
+(μM), NO2-
+ NO3-
(μM), DIN (μM), PO43-
(μM), and dissolved Si (μM) in the Asan Estuary, monitored between 2004 and 2007 monitoring period. “-” denotes a negative relationship.
Station NO2-++NO3-
NH4 +
+ DIN PO43-
DSi Station 1 -0.44b -0.34b -0.51b - -0.54b Station 2 -0.37b -0.28b -0.42b - -0.49b Station 3 -0.41b -0.28b -0.44b - -0.26b Station 4 -0.18a -0.21a -0.21a - -
Station 5 - - - 0.10 -
aP⁄0.05; bP⁄0.01.
saturation, nitrogen and phosphorus integration (TRIX index) (Vollenweider et al., 1998; Kitsiou and Karydis, 2000; Ignatiades, 2005). In this study, we assessed trophic condition along axis of the Asan Estuary using chl a, total phytoplankton cell, primary productivity and TRIX index. In spring, the chl a level was eutrophic, especially at the upper region compared with eutrophic/mesotrophic level (7 μg L
-1) in seawater (Molvaer et al., 1997).
Total phytoplankton cell abundance was also high in spring. Ignatiades (2005) reported that primary productivity for eutrophic range of seawater was 3.51~5.55 mg C m
-3h
-1. In the Asan Estuary with freshwater inputs, the range of primary produc- tivity was 2.1~344 mg C m
-3h
-1in the surface water indicating that eutrophication was severe in the Asan Estuary. According to Vollenweider
et al. (1998), Giovanardi and Vollenweider (2004),TRIX values range from 0 to 10 for the trophic scale and a system with TRIX value higher than 6 is highly productive. Asan Estuary is evidently productive at the upper region since TRIX values were generally higher than 6 (Fig. 10). The TRIX values probably need to be compared with TBRIX including water transparency to explore the effect of freshwater input further since turbidity is ex- pected to increase in the estuary during the mon- soon.
In summary, phytoplankton biomass and cell abundance were high and the water body was eutrophic in spring although small volumes of freshwater was introduced at the upper region.
Nutrient loadings were significantly increased during the wet season by freshwater discharge from lakes suggesting that freshwater input enri- ched ambient nutrients in the Asan Estuary. In the lower region, primary productivity was high when nutrient inputs increased during the wet season (summer and fall) whereas chlorophyll a
concentrations were not increased probably beca- use the change of hydrologic conditions and graz- ing of consumers might cause the decrease of phy- toplankton biomass in Asan Estuary.
LITERATURE CITED
Billen, G., J. Garnier, J. Némery, M. Sebilo, A. Sfer- ratore, S. Barles, P. Benoit and M. Benoît. 2007.
A long-term view of nutrient transfers through the Seine river continuum. Science of the Total Environment 375: 80-97.
Bishop, M.J., S.P. Powers, H.J. Porter and C.H. Peter- son. 2006. Benthic biological effects of seasonal hypoxia in a eutrophic estuary predate rapid coas- tal development. Estuarine, Coastal and Shelf Science 70: 415-422.
Caccia, V.G. and J.N. Boyer. 2007. A nutrient loading budget for Biscayne Bay, Florida. Marine Pollution Bulletin 54: 994-1008.
Clarke, A.L., K. Weckstrom, D.J. Conley, N.J. Ander- son, F. Ads er, E. Andrén, D.V.N. De Jonge, M.
Ellegaard, S. Juggins, P. Kauppila, A. Korhola, N.
Reuss, R.J. Telford and S. Vaalgamaa. 2006. Long- term trends in eutrophication and nutrients in the coastal zone. Limnology and Oceanography 51: 385- 397.
Fisher, T.R., J.D. Hagy III, W.R. Boynton and M.R.
Williams. 2006. Cultural eutrophication in the Choptank and Patuxent estuaries of Chesapeake Bay. Limnology and Oceanography 51: 435-447.
Giovanardi, F. and R.A. Vollenweider. 2004. Trophic conditions of marine coastal water: experience in applying the Trophic Index TRIX to two areas of the Adriatic and Tyrrhenian seas. Journal of Lim- nology 63: 199-218.
Hyfield, E.C.G., J.W. Day, J.E. Cable and D. Justic.
2008. The impacts of re-introducing Mississippi River water on the hydrologic budget and nutri- ent inputs of a deltaic estuary. Ecological Engine- ering 32: 347-359.
Ignatiades, L. 2005. Scaling the trophic status of the Aegean Sea, eastern Mediterranean. Journal of Sea Research 54: 51-57.
Kitsiou, D. and M. Karydis. 2000. Categorical map- ping of marine eutrophiccation based on ecological indices. Science of the Total Environment 255: 113- 127.
Kronvang, B., E. Jeppesen, D.J. Conley, M. Sønder- gaard, S.E. Larsen, N.B. Ovesen and J. Carstensen.
2005. Nutrient pressures and ecological responses to nutrient loading reductions in Danish streams, lakes and coastal waters. Journal of Hydrology 304: 274-288.
Luˇsi´c, D.V., V. Perˇsi´c, J. Horvati´c, D. Viliˇci´c, L. Traven, T. akovac and V. Mi´covi´c. 2008. Assessment of Table 2. Results (P values) of ANOVA analysis of data
sourced from stations measured seasonally thro- ughout 2004~2007.
Season Parameters
Spring Summer Fall All
Cell abundance 0.261 0.565 0.930 0.476
Chl a 0.001 0.621 0.961 0.010
Primary
0.524 0.432 0.288 0.427 production
TRIX 0.008 0.002 0.030 ⁄0.001
Chl : Pheo 0.885 0.156 0.263 0.253
nutrient limitation in Rijeka Bay, NE Adriatic Sea, using miniaturized bioassay. Journal of Experi- mental Marine Biology and Ecology 358: 46-56.
Martins, I., R.J. Lopes, A.I. Lillebø, J.M. Neto, M.A.
Pardal, J.G. Ferreira and J.C. Marques. 2007. Sig- nificant variations in the productivity of green macroalgae in a mesotidal estuary: Implications to the nutrient loading of the system and the adja- cent coastal area. Marine Pollution Bulletin 54:
678-690.
Molvaer, J., J. Knutzen, J. Magnusson, B. Rygg, J.
Skei and J. Sorensen. 1997. Environmental quality classification in fjords and coastal areas. Statens Forurensningstilsyn TA-1467, Norway, 36 pp.
Paerl, H.W. 2006. Assessing and managing nutrient- enhanced eutrophication in estuarine and coastal waters: Interactive effects of human and climatic perturbations. Ecological Engineering 26: 40-54.
Parsons, T.R., Y. Maita and C.M. Lalli (Editors). 1984.
A manual of chemical and biological methods for seawater analysis. Pergamon Press, New York, pp. 22-25.
Pettine, M., B. Casentini, S. Fazi, F. Giovanardi and R. Pagnotta. 2007. A revisitation of TRIX for trophic status assessment in the light of the European Water Framework Directive: Application to Italian coastal waters. Marine Pollution Bulletin 54: 1413- 1426.
Scudlark, J.R., J.A. Jennings, M.J. Roadman, K.B.
Savidge and W.J. Ullman. 2005. Atmospheric nitro- gen inputs to the Delaware Inland Bays: the role of ammonia. Environmental Pollution 135: 433- 443.
Smith, V.H. 2006. Responses of estuarine and coastal marine phytoplankton to nitrogen and phosphorus enrichment. Limnology and Oceanography 51: 377- 384.
Vollenweider, R.A., F. Giovanardi, G. Montanari and A. Rinaldi. 1998. Characterization of the trophic conditions of marine coastal waters with special reference to the NW Adriatic Sea: proposal for a trophic scale, turbidity and generalized water qual- ity index. Envirometrics 9: 329-357.
Welschmeyer, N.A. and C.J. Lorenzen. 1985. Chloro- phyll budgets: Zooplankton grazing and phytoplank- ton growth in a temperate fjord and the Central Pacific Gyres. Limnology and Oceanography 30:
1-21.
Wen, L.S., K.T. Jiann and K.K. Liu. 2008. Seasonal variation and flux of dissolved nutrients in the Danshuei Estuary, Taiwan: A hypoxic subtropical mountain river. Estuarine, Coastal and Shelf Sci- ence 78: 694-704.
Whitall, D., M. Castro and C. Driscoll. 2004. Evaluation of management strategies for reducing nitrogen loadings to four US estuaries. Science of the Total Environment 333: 25-36.
Yin, K. and P.J. Harrison. 2008. Nitrogen over enrich- ment in subtropical Pearl River estuarine coastal waters: Possible causes and consequences. Conti- nental Shelf Research 28: 1435-1442.
(Manuscript received 23 November 2011, Revised 14 December 2011,
Revision accepted 21 December 2011)