ISSN 1229-2427 (Print) ISSN 2288-646X (Online) https://doi.org/10.7843/kgs.2021.37.7.35 한국지반공학회논문집 제37권 7호 2021년 7월 pp. 35 ~ 42
JOURNAL OF THE KOREAN GEOTECHNICAL SOCIETY Vol.37, No.7, July 2021 pp. 35 ~ 42
저소성 세립분 함량이 카올리나이트-모래 혼합토의 공학적 특성에 미치는 영향
Effect of Low-Plastic Fine Content on the Engineering Properties of Kaolinite-Sand Mixture
판야봇 카오톤1 Kaothon, Panyabot 이 수 형2 Lee, Su-Hyung
최 영 태3 Choi, Yeong-Tae 윤 찬 영4 Yune, Chan-Young
Abstract
An experimental study was carried out on kaolinite-sand mixtures with various proportions of kaolinite content. To investigate physical behaviour of mixtures, index properties and compaction test results were analysed in various aspects.
Moreover, to clearly see the interaction between kaolinite and sand particles, the observational analysis through microscopic image analysis device was conducted. The test results showed that an increase in the amount of kaolinite could create a strong bonding structure which resulted in higher specific surface available for activities of kaolinite particles. Also, an increase in the amount of the kaolinite resulted in an increase in the percentage of water sorption.
Then it could accelerate the occupation rate of water which tended to take up the space that would have been occupied by solid particles, and accordingly, resulted in the decreased maximum dry unit weight and increased initial void ratio.
Based on the microscopic image analysis, the samples were individually classified into three types of mixture such as sand dominant, intermediate fine content, and fine dominant. In addition, the fine and coarse grains seem to interact well in the mixtures with the fine content ranging from 25 to 40%.
요 지
본 연구에서는 다양한 카올리나이트 혼합비에 따른 카올리나이트-모래 혼합토의 특성을 실험적으로 분석하였다.
이를 위하여 기본물성실험과 다짐시험을 실시하고 그 결과를 분석하였으며, 카올리나이트와 모래입자 간의 상호 구조 를 더욱 자세히 분석하기 위하여 현미경 사진을 이용한 관측을 추가적으로 수행하였다. 실험결과, 카올리나이트 혼합 비가 증가할수록 비표면적의 증가에 따른 함수비의 증가 및 모래입자와의 강한 결합구조를 형성하는 것으로 나타났으 며, 최대 건조밀도는 감소하고 초기간극비는 증가하는 것으로 나타났다. 현미경 사진 분석 결과, 세립분 함량의 증가에 따라 모래의 특성이 지배적인 비율, 중간 비율, 세립분의 특성이 지배적인 비율을 확인할 수 있었으며, 세립분의 함량 이 25-40% 정도인 경우에 입자간 상호작용이 잘 이루어지는 것을 관측할 수 있었다.
Keywords : Index properties, Microscopic image, Void ratio, Sand dominant, Intermediate fine content, Fine dominant
1 비회원, MSc Student, Dept. of Civil Engrg., Gangneung-Wonju National Univ.
2 정회원, Member, Principal Researcher, Advanced Railroad Vehicle Division, Korea Railroad Research Institute 3 정회원, Member, Senior Researcher, Advanced Railroad Civil Engrg. Division, Korea Railroad Research Institute
4 정회원, Member, Prof., Dept. of Civil Engrg., Gangneung-Wonju National Univ., Tel: +82-33-640-2423, [email protected], Corresponding author, 교신저자
* 본 논문에 대한 토의를 원하는 회원은 2022년 1월 31일까지 그 내용을 학회로 보내주시기 바랍니다. 저자의 검토 내용과 함께 논문집에 게재하여 드립니다.
Copyright © 2021 by the Korean Geotechnical Society
This is an Open-Access article distributed under the terms of the Creative Commons Attribution Non-Commercial License (http://creativecommons.org/licenses/by-nc/3.0) which permits unrestricted non-commercial use, distribution, and reproduction in any medium, provided the original work is properly cited.
1. Introduction
The embankment materials for railways or roads con- structions in Korea habitually contain silty and clayey soils which are found near the construction site. The fine particles in the embankment material considerably affects the physical and mechanical properties of the soil itself.
Silt consists of small particles or grain of soil and minerals that easily carried and deposited by water. With the vertical load by trains on the embankment, soils with high silt contents tend to experience plastic deformation. Also, the soil in plastic state becomes weak and can lose its stiffness, and accordingly, long-term settlement will be occurred. So, to avoid these problems, the behavioural analysis on the low-plastic fine clay mixing with sand is very necessary.
The study on the stress-strain behaviour and the strength of clayey soil have been conducted by many researchers.
Monkul and Ozden (2007) performed the oedometer tests on kaolinite-sand mixtures in different proportion to observe the overall stress-strain behaviour based on transition fine content. The results indicated that when the amount of fine exceeds the transition fines content, kaolinite controlled the compressive behaviour and resulted in high granular compression index. Arifina and Schanzb (2011) observed the microstructure of compacted bentonite-sand mixtures in both dry and wet conditions. The results showed that 100% of bentonite in the mixture with dry condition has a greater volume of macro-pore compared to the wet condition. For the case of 50% in both bentonite and sand, the volume of macro-pores was mostly the same in both dry and wet conditions. Benahmed et al. (2015) estimated the impact of the low plastic fines content on the mechanical behaviour regarding instability phenomena which conducted both drained and undrained triaxial compression tests. The experimental results showed that fines content had a significant effect on both resistance at the onset of instability and on the critical state position of silty sands. Chemmam et al. (2016) examined the effect of silts (low-plastic fine clay) and confining stress on the undrained shear strength in triaxial compression. The results showed that the presence of low plastic fines in
sand-silt mixture leads to a more compressible soil, and consequently to a significant loss in the soil strength.
Proia et al. (2016) conducted an experimental study on the compacted sand-bentonite mixtures. The results showed that the mixtures with a low percentage of bentonite showed a behaviour of granular soils and a higher content of bentonite resulted in a behaviour of plastic clays. Elgendy et al. (2019) investigated the influence of low-plastic fines content on the properties of clean sand. Their result revealed that an increase of fine content caused a decrease of the shear strength. The void ratio also decreased as fines content increased up to 15%, and then gradually increased with further percentage of fines content. Jyothi et al. (2020) classified the behaviour of the mixture of sand with both low-plastic fines (kaolinite and bentonite) based on specific gravity, and Atterberg limit test. The data indicated that an increase in percentage of kaolinite and bentonite caused an increase in value of specific gravity (Gs), Liquid limit (LL) and Plastic limit (PL). In addition, those values of LL and PL in case of bentonite are higher than kaolinite in mixtures.
Based on forementioned studies, the effect of low- plastic fines on the strength of soil has been well studied.
However, the behavioural analysis and the bonding structure according to the percentage of fine content in the mixture have not been enlightened. Therefore, this paper presents the investigation on kaolinite-sand mixtures with various fine clay proportions (10, 25, 30, 40, 60, 70% of the host material) through the index properties results. Moreover, to provide a better comprehend on the behaviour of mixtures for the in-situ placement method utilized for earth em- bankments and landfills base layers, the mixtures were compacted by Standard Proctor test with method D. Also, to analyse the bonding structure of mixtures, the micro- mechanics of fine particles was investigated based on the microscopic image analysis.
2. Material properties
The host material in this study is CEN standard sand also named as ISO sand (TSI, 2002). Its specific grain size distribution ranges between 0.08 and 2.00 mm and
Table 1. The grain size distribution according to EN 196-1 Sieve interval
(mm)
Cumulative sieve remaining amount (%)
2.00 0
1.60 7 ± 5
1.00 33 ± 5
0.50 67 ± 5
0.16 87 ± 5
0.08 99 ± 5
Table 2. Chemical composition of kaolinite
Constituents SiO2 Al2O3 Fe2O3 MgO CaO Na2O K2O Kaolinite
(% by weight) 49.28 35.69 0.97 0.07 0.05 0.28 0.42
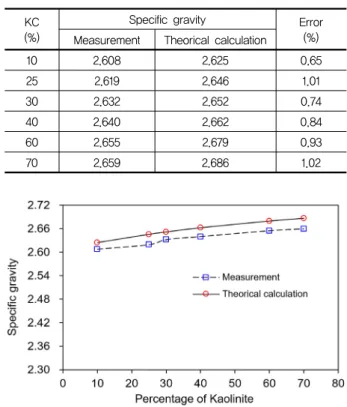
Table 3. Comparison between measurement and theorical calculation KC
(%)
Specific gravity Error
Measurement Theorical calculation (%)
10 2.608 2.625 0.65
25 2.619 2.646 1.01
30 2.632 2.652 0.74
40 2.640 2.662 0.84
60 2.655 2.679 0.93
70 2.659 2.686 1.02
Fig. 1. The value of specific gravity on six different mixtures
the grain size distributions are summarized in Table 1.
The uniformity coefficient (Cu) and coefficient of gradation (Cc) equal to 2.14 and 1.49, respectively. Also, its specific gravity (Gs,CEN) is 2.61. The second material is kaolinite (KC) w hich has the chemical formula of Al2[Si2O5](OH)4
and the specific gravity (Gs,KC) is 2.80. Each percentage of chemical composition was detailed in Table 2.
3. Experimental program
The mixtures of CEN standard sand and kaolinite were mixed with six different ratios of kaolinite. To evaluate both physical properties of those mixtures, six mixing ratios (10, 25, 30, 40, and 70% KC of the CEN standard sand weight) were chosen to perform the index properties tests. Moreover, to observe the packing structure of the mixtures, the representative samples (all cases of mixture) were examined by microscopic image analysis device (HF-MAC01) with x125 magnification.
4. Results and discussion 4.1 Specific gravity test
The specific gravity test was carried out according to ASTM D-854. Figure 1 shows the results of specific gravity values in six mixtures (10, 25, 30, 40, 60 and 70% KC of the CEN weight). The overall results indicated that the increase in percentage of KC caused the increase
in value of Gs. This was due to the fine content of kaolinite leading to subtraction of the voids in the mixture.
Mathematically, The specific gravity (Gs) of the mixture could also be simply calculated in function of Gs,CEN and Gs,KC as Equation 1. The error values between the measure- ment data and the theorical calculation were mostly less than 1% as detailed in Table 3.
, (%) ,
/ 1 (%)s s CEN s KC
G G KC G KC (1)
4.2 Sieve analysis
The sieve analysis was conducted based on ASTM D-2487. After the dry sieving, wet sieving was performed for a considerable amount of soil retained on the No.
200 sieve. The grain size distributions for six mixtures were shown in Figure 2. The percentage of fine grains passing through No. 200 sieve were mostly the same to the percentage of kaolinite (KC) contents. As a result, the percentage of fine in the mixtures were 10.38, 26.33, 31.81, 41.31, 60.49, and 71.95 %. Mathematically, The percentage finer than No. 200 sieve of the mixture (fc)
Table 4. Comparison between measurement and theorical calculation KC
(%)
Percentage finer than No. 200 sieve (%) Error Measurement Theorical calculation (%)
0 0.35 0.35 0.00
10 10.38 10.35 0.28
25 26.33 25.35 1.86
30 31.81 30.35 4.19
40 41.31 40.35 2.33
60 60.49 60.35 0.15
70 71.95 70.35 2.22
Fig. 2. The grain size distribution on six different mixtures
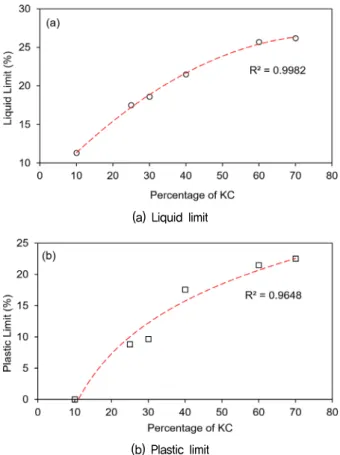
(a) Liquid limit
(b) Plastic limit
Fig. 3. Atterberg limit test on Kaolinite-Sand mixtures
Fig. 4. Compaction test results on different mixtures
could also be calculated since the percentage finer than No. 200 of CEN (fc,CEN) is approximately 0.35%. The formula in function of percentage finer than No. 200 sieve of CEN (fc,CEN) and Kaolinite (fc,KC) and the calculation results are shown in Equation 2 and Table 4.
, ,
c c CEN c KC
f f f (2)
4.3 Atterberg limit
The Atterberg limit was measured on the prepared kaolinite-sand mixtures and the tests were based on ASTM D-4318. Figure 3 shows the experimental results of different mixtures in liquid limit and plastic limit test. It was observed that small amount of kaolinite (10%) could produce liquidity (LL = 11.3%) but was not enough to have a plasticity (PL = 0%). In overall, the values of LL and PL increased with the increase in percentage of KC because the higher amount of KC enabled the creation of a strong bonding structure which resulted in higher specific surface available for activities of kaolinite particles (Warkentin, 1972; Jyothi et al., 2019).
4.4 Compaction test
To observe the effect of fine content on the optimal water content (wopt) and the maximum dry unit weight (ɣd,max) of the mixtures, compaction tests were performed according to ASTM D-698 & D-1557 with method D.
Figure 4 presents compaction curves of mixtures in terms of dry unit weight and water content. In overall, the experimental results showed that the curves move down- ward and right side with the increasing kaolinite content
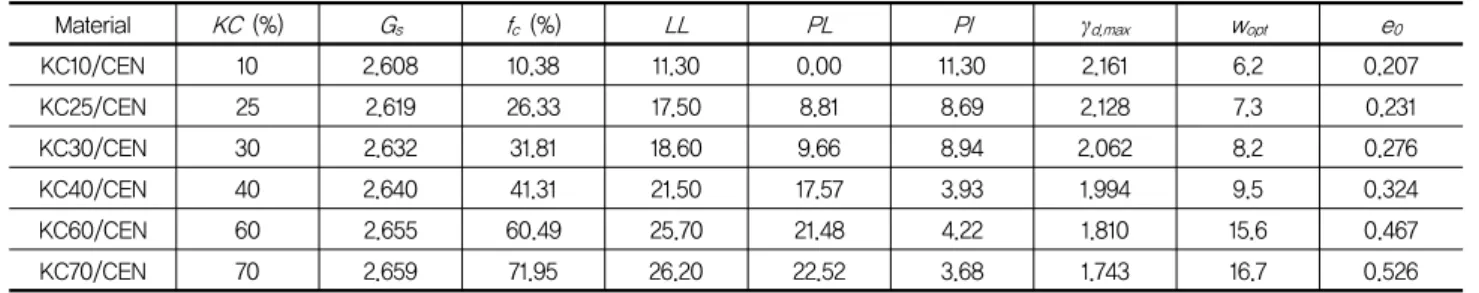
Table 5. Index properties of kaolinite-sand mixtures form fitting curves
Material KC (%) Gs fc(%) LL PL PI γd,max wopt e0
KC10/CEN 10 2.608 10.38 11.30 0.00 11.30 2.161 6.2 0.207
KC25/CEN 25 2.619 26.33 17.50 8.81 8.69 2.128 7.3 0.231
KC30/CEN 30 2.632 31.81 18.60 9.66 8.94 2.062 8.2 0.276
KC40/CEN 40 2.640 41.31 21.50 17.57 3.93 1.994 9.5 0.324
KC60/CEN 60 2.655 60.49 25.70 21.48 4.22 1.810 15.6 0.467
KC70/CEN 70 2.659 71.95 26.20 22.52 3.68 1.743 16.7 0.526
Table 6. Group symbol and name of all mixtures
Material Group symbol Group name
KC10/CEN SW-SC Well-graded sand with clay
KC25/CEN
CL Lean clay with sand
KC30/CEN Sandy lean clay
KC40/CEN
CL-ML Sandy silty clay
KC60/CEN
KC70/CEN ML Sandy silt
Fig. 5. Casagrande chart
from 10 to 70%. In general, beyond a certain moisture content, any increase in the moisture content tends to reduce the dry unit weight. This is because the water takes up the space that would have been occupied by solid particles. Moreover, an increase in the amount of KC caused an increase in the percentage of water sorption (White and Pichler, 1959). Thus, the value of ɣd,max w as found to decrease with the increase in the percentage of KC w hile the wopt increased with fine content. The global void ratio considering both granular and fine particles also increased with the increase of fine content because the value of void ratio was inversely proportional to the dry unit weight and the sand particles were regarded as the void when the coarse grains floating in fine grain network.
The results of index properties for all mixtures (10, 25,
30, 40, 60, 70% KC of CEN weight) were summarised as show n in Table 5.
Both results of plasticity index (PI) and liquid limit (LL) were used to categorize each mixtures according to the Casagrande chart (Figure 5) and the categorized result were summarized in Table 6.
4.5 Microscopic image analysis
The observation of microscopic images on all cases of mixtures (Figure 7) clearly illustrated the micromechanical effect of kaolinite clay even for a low percentage of KC.
The blue solid line and the red dashed line represent the kaolinite and CEN standard sand, respectively.
Figure 6a shows the microstructure of KC10/CEN mixture which was categorized as a type of low fine content or sand dominant because there were no kaolinite particles surrounding sand particles. As the fine content increases up to 25% (KC25/CEN), the presence of kaolinite was started to surround sand particles (Figure 6b). In case of KC30/CEN (Figure 6c), the micromechanics was not much different from KC25/CEN. Surprisingly, by adding more 10% of kaolinite (KC40/CEN), fine sand particles started to be surrounded by the KC, but the coarse- grained sand particles (Figure 6d) were not surrounded yet. With 60% of KC (KC60/CEN), the present of KC
Fig. 6. Micro-photographs with x125 magnification of mixtures: (a) KC10/CEN, (b) KC25/CEN, (c) KC30/CEN, (d) KC40/CEN, (e) KC60/CEN, (f) KC70/CEN
Fig. 7. Types of the mixtures with six various proportion of kaolinite
was found all over the small and large particles of CEN standard sand (Figure 6e). Moreover, in case of KC70/
CEN (Figure 6f), it had high fine content and could be categorized as the fine dominant mixture. In this mixture,
it was difficult to identify particles from CEN sand particles.
Figure 7 shows the types of the mixture based on various proportion of kaolinite. The first mixture having the lowest fine content (KC10/CEN) could be classified as sand
dominant mixture. In this mixture, the KC particles were still floating in the void and the movement (e.g., defor- mation and settlement) of mixture under the pressure was dominated by sand particles (Chang and Meidani, 2013).
With increasing fine content, the next three mixtures (KC25/CEN, KC30/CEN, and KC40/CEN) could be ca- tegorized as intermediate fine content mixtures. At this percentage of fine content, the KC particles partially interacted with sand particles and the transition fine content could be found within this range (Monkul and Ozden, 2005). Moreover, the deformation of mixture was controlled by both KC and sand particles (Chang and Meidani, 2013). The high fine content mixtures (KC60/
CEN and KC70/CEN) were fine dominant mixtures. In this type of mixture, the high amount of fine particles were dominant in the grain network. The deformation was also large compared to the other mixtures since the behaviour of mixture is fully controlled by fine particles of kaolinite (Chang and Meidani, 2013).
Based on the image analysis of the microphotographs, the fine and coarse grains seemed to interact well in the range from 25 to 40% of fine content. Also, it was consistent with many previous studies (Vaid, 1994; Pitman et al., 1994; Lade and Yamamuro, 1997; Amini and Qi, 2000; Chien et al., 2002; Monkul and Ozden, 2007) which mentioned that these percentage of KC could stabilize the soil and control the overall engineering behaviour of soil.
5. Conclusions
The effects of fine content on physical properties of sand and clay mixtures were studied for various propor- tions of kaolinite clay by basic property test, compaction test, and microscopic image analysis. With the increase of fine content from 10 to 70%, liquid limit, plastic limit and wopt increased whereas ɣd,max decreased. Based on the microscopic image analysis, the transition from sand dominant mixture to fine dominant mixture could be clearly observed. The findings in the current study can be useful in various geotechnical engineering problems, especially, when it is inevitable to use natural sandy soils
with high fine content, in order to predict whether the finer or coarser grain matrix controls the overall engineering behaviour.
Acknowledgment
This research was supported by a grant from R&D Program (PK2103A3 ) of the Korea Railroad Research Institute, Republic of Korea.
References
1. Amini, F. and Qi, G.Z. (2000), “Liquefaction Testing of Stratified Silty Sands”, Journal of Geotechnical and Geoenvironmental Engineering, Vol.126, No.3, pp.208-217.
2. Arifina, Y.F. and Schanzb, T. (2011), “Microstructure of Compacted Calcium Bentonite-sand Mixture”, In Proc. the 12th Int. Conf. on Quality in Research (QIR).
3. ASTM D-854 (2002), Standard Test Methods for Specific Gravity of Soil Solids by Water Pycnometer, American Society for Testing and Materials.
4. ASTM D-2487 (2000), Standard Practice for Classification of Soils for Engineering Purposes (Unified Soil Classification System), American Society for Testing and Materials.
5. ASTM D-698 (2000), Standard test method for laboratory com- paction characteristics of soil using standard effort. Annual Book of AS TM S tandards. Easton, PA: American S ociety for Testing and Materials.
6. ASTM D-1557 (2000), Standard Test Method for Laboratory Com- paction Characteristics of Soil Using Modified Effort (56,000 ft-lbf/ft3 (2,700 kN-m/m3)). Annu. B. Stand., 4.
7. ASTM D-4318 (2017), Standard test methods for liquid limit, plastic limit, and shrinkage limit of soils. West Conshohocken, PA:
American Society for Testing and Materials.
8. Benahmed, N., Nguyen, T.K., Hicher, P.Y., and Nicolas, M. (2015),
“An Experimental Investigation into the Effects of Low Plastic Fines Content on the behaviour of Sand/silt Mixtures”, European Journal of Environmental and Civil Engineering, Vol.19, No.1, pp.109-128.
9. Chang, C.S. and Meidani, M. (2013), “Dominant Grains Network and behaviour of Sand-silt Mixtures: Stress-strain Modelling”, International Journal for Numerical and Analytical Methods in Geomechanics, Vol.37, No.15, pp.2563-2589.
10. Chemmam, M., Arab, A., Belkhatir, M., and Bouferra, R. (2016),
“Behaviour of Loose Silty Sand of Chlef River: Effect of Low Plastic Fine Contents and Other Parameters”, Marine Georesources
& Geotechnology, Vol.34, No.4, pp.384-394.
11. Chien, L.K., Oh, Y.N., and Chang, C.H. (2002), “Effects of Fines Content on Liquefaction Strength and Dynamic Settlement of Reclaimed Soil”, Canadian Geotechnical Journal, Vol.39, No 1, pp.254-265.
12. Elgendy, A.I., Agaiby, S.S., and Salem, M.A. (2019), “Effect of Low-Plastic Fines Content on the Properties of Clean Sand”,
International Congress and Exhibition”, Sustainable Civil Infrastructures, pp.29-40. Springer.
13. Jyothi, D.N., Prasanna, H.S., and Vishwanath, C. (2020), “A Sudy on Index Properties of Kaolinite and Bentonite Sand Mixtures”, AIP Conference Proceedings (Vol. 2204, No. 1, p. 020009). AIP Publishing LLC.
14. Lade, P.V., Liggio, C.D., and Yamamuro, J.A. (1998), “Effects of Non-plastic Fines on Minimum and Maximum Void Ratios of Sand”, Geotechnical Testing Journal, Vol.21, pp.336-347.
15. Monkul, M.M. and Ozden, G. (2005), “Effect of Intergranular Void Ratio on One-dimensional Compression behaviour”, Proceedings of International Conference on Problematic Soils, Vol.25, p.27, International Society of Soil Mechanics and Geotechnical Engineering Famagusta, Turkish Republic of Northern Cyprus, Vol.3.
16. Monkul, M.M. and Ozden, G. (2007), “Compressional behaviour of Clayey Sand and Transition Fines Content”, Engineering Geology, Vol.89, No.3-4, pp.195-205.
17. Pitman, T.D., Robertson, P.K., and Sego, D.C. (1994), “Influence of Fines on the Collapse of Loose Sands”, Canadian Geotechnical
Journal, Vol.31, No.5, pp.728-739.
18. Proia, R., Croce, P., and Modoni, G. (2016), “Experimental Investi- gation of Compacted Sand-bentonite Mixtures”, Procedia Engineering, Vol.158, pp.51-56.
19. Turkish Standard Institute (2002), Methods of testing cement—Part 1: Determination of strength.
20. Vaid, Y.P., Sivathayalan, S., and Stedman, D. (1999), “Influence of Specimen-reconstituting Method on the Undrained Response of Sand”, Geotechnical Testing Journal, Vol.22, No.3, pp.187-195.
21. Warkentin, B.P. (1972), “Use of the Liquid Limit in Characterizing Clay Soils”, Canadian Journal of Soil Science, Vol.52, No.3, pp.457-464.
22. White, W.A. and Pichler, E. (1959), Water-sorption characteristics of clay minerals, Circular no. 266.
Received : June 14th, 2021 Revised : July 21st, 2021 Accepted : July 21st, 2021