제
13
권,
제1
호(2014
년2
월) pp.75~85
Development of the Multi-mobility Sharing Service Management System
- A Case Study of Kashiwa City, Japan -
김 재 열* 츠보우치 코우타 ** 야마토 히로유키***
(Jae-youl Kim) (Kota Tsubouchi) (Hiroyuki Yamato)
요 약
기존 카쉐어링 시스템은 원웨이 트립 수요에 대한 대응과 타 쉐어링 시스템과의 연계가 어려운 문제점이 있다. 이에 본 연구에서는 원웨이와 라운드웨이 트립에 대응이 가능하며, 자동차(전기/가솔린), 전기오토바이, 자전거 등의 다양한 교통수단을 공유할 수 있는 멀티모빌리티 쉐어링 서비스 메니지먼트 시스템을 개발하여 일본 치바현 카시와시 카시와노 하지역과 나가레야마시에 모의실험을 실시하였다. 모의실험 결과, 이 시스템을 통해 전체 자동차 트립 중 54.9%의 원웨 이 트립 수요가 충족되었으며, 전체 이용자 중 43.9%가 공통 인터페이스를 통해 복수의 교통수단을 이용한 것이 확인되 었다. 또한, 차량의 공동이용과 친환경 차량 이용을 통해 이산화탄소 배출량도 삭감에도 공헌하였다. 개발된 쉐어링 시스 템은 기존 카쉐어링 시스템 보다 다양한 교통수요에 대응하면서 이동성을 향상 시킬 것으로 기대된다.
핵심어: 공통인터페이스, 친환경차량, 전기자동차, 통합 데이터베이스, 멀티 모빌리티 쉐어링 서비스
ABSTRACT
Existing car-sharing systems have difficulty meeting the demands of one-way trips and connecting to other sharing systems.
Therefore, in this study, a multi-mobility sharing service management system that was able to meet the demands of the one-way and round-way trips and shared diverse transportation modes such as cars (electric car/gasoline car), electric motorcycles and bicycles was developed, and a field study was conducted in Kashiwa-no-ha, Kashiwa City and Nagareyama City, Chiba Prefecture, Japan. As a result of the field test, it was confirmed that this system supplied the one-way demands for 54.9% of total car trips and 43.9% of the user used multiple transportation modes by the common interface. In addition, this system contributed to reduce carbon dioxide emissions by sharing vehicles and using eco-friendly vehicles. The developed sharing system is expected to improve mobility by meeting more various types of traffic demand than existing car sharing systems.
Key words : common interface, eco-friendly vehicle, electric vehicle, integrated database, multi-mobility sharing service
†
본 연구의 모의실험은2010
년도 일본 총무성 지역ICT
이·
활용광역연계사업과2012
년도 일본 내각부 환경미래도시 선도적 모 델사업의 재정지원을 받아 수행하였습니다.
*
주저자:
일본 도쿄대학 신영역창성과학연구과 박사과정**
공저자:
일본Yahoo! JAPAN
연구소 전임연구원**
공저자 및 교신저자:
일본 도쿄대학 신영역창성과학연구과 교수†
논문접수일: 2013
년11
월21
일†
논문심사일: 2014
년02
월06
일†
게재확정일: 2014
년02
월13
일Ⅰ. Introduction
Car sharing allows users to by-pass maintenance costs such as purchase cost, car tax, auto insurance, etc. without having to own a car [1]. In addition to direct benefits to individuals, vehicle-sharing services offer a number of environmental and social benefits.
However, the problem with car sharing services is the high running cost, such as maintenance cost, system cost and the price of land for parking [2]. On the other hand, from the users’
view point, it costs comparatively high to use the service to go to nearby places. This is because most car sharing services are provided only in round-trips. This means users must return cars to their starting station and need to pay a rental fee during the entire rental time.
Users thus have to pay a large fee even if they drive very little [3].
To offer even more convenience to users, some car sharing operators allow users even more flexibility in return times and stations [4].
Users can return vehicles whenever and wherever they like. However, this model faces complex management problems, especially in relocation [5]. Moreover, users can only choose one mode of transportation in car sharing services. When driving short distances alone, due to lower costs, many users prefer motorcycles and bicycles over cars.
In order to resolve these problems, the multi-mobility sharing service management system was developed. This paper describes the development of the multi-mobility sharing service management system. The developed system is evaluated by field tests conducted in Kashiwa City and Nagareyama City, Chiba Prefecture, Japan.
Ⅱ. Development of the Multi-mobility sharing service
management system
1. Overview of the developed system
Figure 1 shows an overview of the developed system. The developed system consists of two core modules : integrated database and common interface.
This system combines with other mobility services and allows users to have access to many services through a single ID and membership card via a common interface. Users can choose other transportation modes when the desired vehicles have all been rented out by other users. The log data of these services are stored in an integrated database, making it possible to reproduce detailed movement in the areas. Accumulated data can be utilized for city planning, etc.
2. Overview of the providing system
First, users register their personal information such as name, address, contact number, e-mail address, driver’s license number and credit card number to the system and obtain an ID-number and membership card with an IC chip. When they want to use this system, all they have to do is access the web site and input their demand information. Demand information consists of four items: 1) ID and password, 2) vehicle, 3) origin sharing port and 4) destination sharing port. The reservation is valid for 15 minutes after the reservation confirmation.
Users go to the parking area, “Sharing Port”,
after their reservation and touch the membership
card to the control box. The control box then
<그림 1> 개발한 시스템의 개요
<Fig. 1> Overview of the developed system
<그림 2> 쉐어링 서비스를 제공하는 쉐어링 포트의 시설 (도쿄대학 카시와캠퍼스)
<Fig. 2> Equipment in sharing port of providing sharing service (Kashiwa campus,the Univ. of Tokyo)
gives users the key and helmet (only in the case of motorcycles) for their reservation. Figure 2 shows the vehicles and the equipment at the sharing port. Users can return vehicles to other sharing ports. Therefore, this sharing system provides round-way services as well as one-way services.
When there are no vehicles due to concentration at another sharing port, users are able to select other transportation modes. In this system, concentrating of vehicles at one sharing
port does not occur. The number of vehicles to park at the all designated sharing port is set on the system.
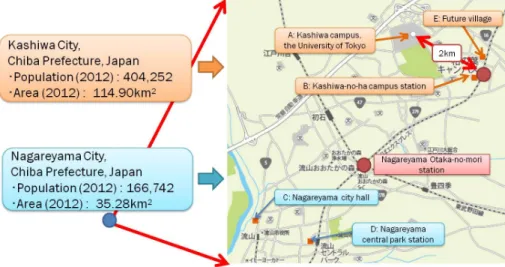
Ⅲ. Field Test in Kashiwa-no-ha and Nagareyama area
The field test was implemented in Kashiwa
City and Nagareyama City, Chiba Prefecture,
Japan. The details of the test and results are
shown in this section.
<그림 3> 모의실험 대상지역의 개요 (쉐어링 포트 분포)
<Fig. 3> Test Area Map (Sharing port distribution)
1. Characteristics of the field test area
Test areas were located in Kashiwa-no-ha, Kashiwa City and Nagareyama City, Chiba Prefecture, Japan. The main stations were Kashiwa-no-ha campus station and Nagareyama Otaka-no-mori station in this area. These areas were developed with the cooperation of universities, companies and governments. The surrounding area has the Univ. of Tokyo, Chiba Univ., Edogawa Univ., national cancer centre, Tokatsu-Techno Plaza, public offices, Kashiwa-no-ha Park, commercial buildings and apartments, and thus, by connecting these facilities, we aim for sustainable development.
Therefore, instead of the existing transportation systems only around the train stations, we needed a new transportation system that could be used to visit each facility. At the beginning of the field test, five sharing ports (A to E) were set up in this area. Kashiwa-no-ha future village (E) was only used as a parking lot during off-service time, just for administrators.
From the 1st of Oct. 2011, two sharing ports
(C, D) in Nagareyama City were put out of service due to contract termination. Figure 3 shows the location of these sharing ports and the area.
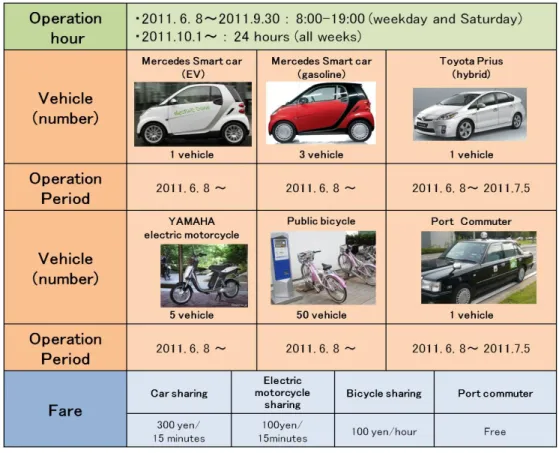
2. Details of the field test
Figure 4 shows the outline of the field test.
The field test has been implemented since 8th June 2011. At the beginning of the field test, sharing ports operated for 11 hours a day with no service on Sundays and holidays. Since 1st October 2011, operation hours were changed to 24 hours a day. 61 vehicles (5 cars, 5 electric motorcycles, 50 bicycles, 1 port commuter) were in service and users needed to pay a fare. Fares were based on travel times and covered maintenance, insurance, registration, and fuel.
It costs a lot to increase the number of
sharing ports within a reasonable walking
distance to users’ residence or workplace. To
deal with this issue, a porter commuter was
introduced to transport users for free to sharing
ports from 8th June to 5th July, 2011. Users
<그림 4> 모의실험의 개요
<Fig. 4> Outline of the experiment
can reserve it via a common interface. The main administrator was the Kashiwa-no-ha campus city IT consortium. Two types of analysis were held: log data analysis and questionnaire analysis.
3. Analysis of the log data
We analyzed the log data accumulated in the database from 8th June, 2011 to 31th Jan., 2012.
Figure 5 shows the number of the registrants and the usage frequency by transportation modes. The number of registrants was 208 and 59.1% of them have used this service more than once by January 2012. In this service area, the
users of this service depended on the schedule of Kashiwa campus, the University of Tokyo.
Registration numbers have increased continuously.
However, the usage frequency has changed according to seasons and vacations. The usage frequency during winter (Dec.~Jan.) and vacations (Aug.~Sep.) were decreased.
Figure 6 shows the gender, age, address, and frequency of usage of 123 users from log data.
The majority was male and in the 20-29 age group (30.1%) and 30-39 age group (34.1%).
The percentage of 30-39 age group is relatively
high, because Kashiwa campus is mainly
composed of the graduate school and research
institutes.
<그림 5> 등록자수와 교통수단별 이용 빈도의 추이
<Fig. 5> Number of the registrants and usage frequency by transportation modes
107, 87.0%
13.0% 16,
Male Female Gender
(n=123)
37 , 30.1%
13.0% 16, 27 ,
22.0%
13 ,
10.6% 4 , 3.3%
21-30 31-40 41-50 51-60 61-70 (n=123)Age
79 , 64.2%
13.0% 16, 15 , 12.2%
4 , 3.3% 3 , 2.4% 3 , 2.4% 1 , 0.8%
1 , 0.8%
1-5 times6-10 times 11-20 times 21-30 times 31-40 times 41-50 times 51-60 times 61-70 times Frequency of usage(n=123)
67, 54.5%
13.0% 16, 37, 30.1%
Kashiwa city Ngareyama city Address Etc.
(n=123)
<그림 6> 성별, 연령별, 주소지, 이용 빈도의 구성비
<Fig. 6> Proportion of the users by gender, age, address, frequency of usage 22.0% of all users had used this service over
10 times. However, 40.9% of all have registrants had never used the system. When they register for this service, they do not need to pay an initial enrollment deposit. Therefore, they do not feel obligated to use this service and many registrants have never used this system.
Half of the users lived in Kashiwa City, because the main area of this field test was Kashiwa-no-ha, Kashiwa City. There were many
users who lived outside Kashiwa City and Nagareyama City that used this system for commuting.
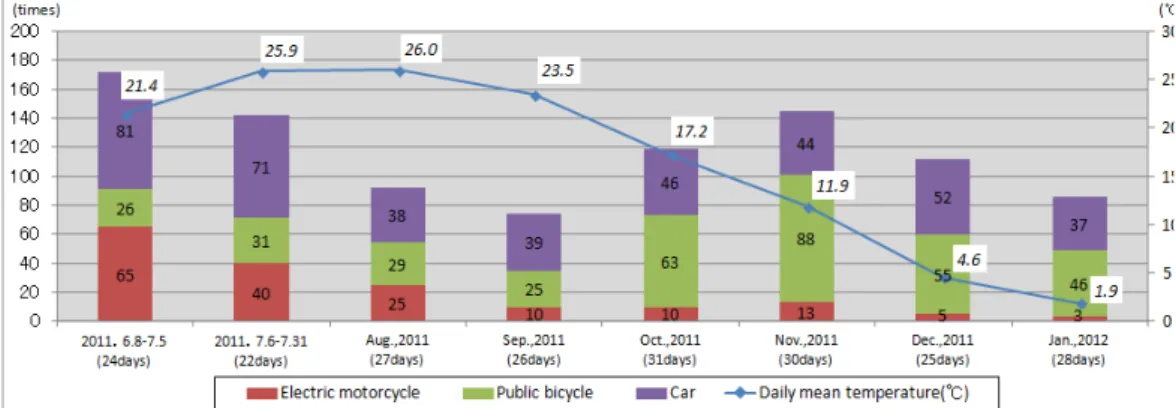
By analyzing the log data, the tendency of
usage was made clear. Figure 7 and Figure 8
show the frequency of usage and monthly mean
temperature and hour. According to Figure 7,
when the temperature dropped below 5 degrees
Celsius (from December 2011 to January 2012),
the usage frequency of electric motorcycles
decreased greater compared to public bicycles
<그림 7> 일평균기온변화에 따른 월별 이용 빈도
<Fig. 7> Usage frequency by daily mean temperature
<그림 8> 시간대별 이용 빈도
<Fig. 8> Usage frequency by hour
and cars. The monthly mean temperature data was taken from the meteorological observatory in Abiko city, Chiba Prefecture, Japan [7]. The temperature is important for users in choosing their optimal vehicle. In this study, however, the period of data is too short for an analysis on the effect of the temperature.
Figure 8 shows the usage frequency by hour.
The major demand of this service is for commuting between Kashiwa-no-ha campus station and Kashiwa campus, the University of Tokyo. However, the peak time of this service for commuting is not typical. Because the main users of this service are graduate students of the
University of Tokyo, their commuting times are not fixed. The majority of car trips took place from 11:00 to 15:00, and the majority of electric motorcycle trips occurred during 11:00 to 15:00. In the case of public bicycles, the majority of trips took place at 8:00. The peak time is different for each vehicle.
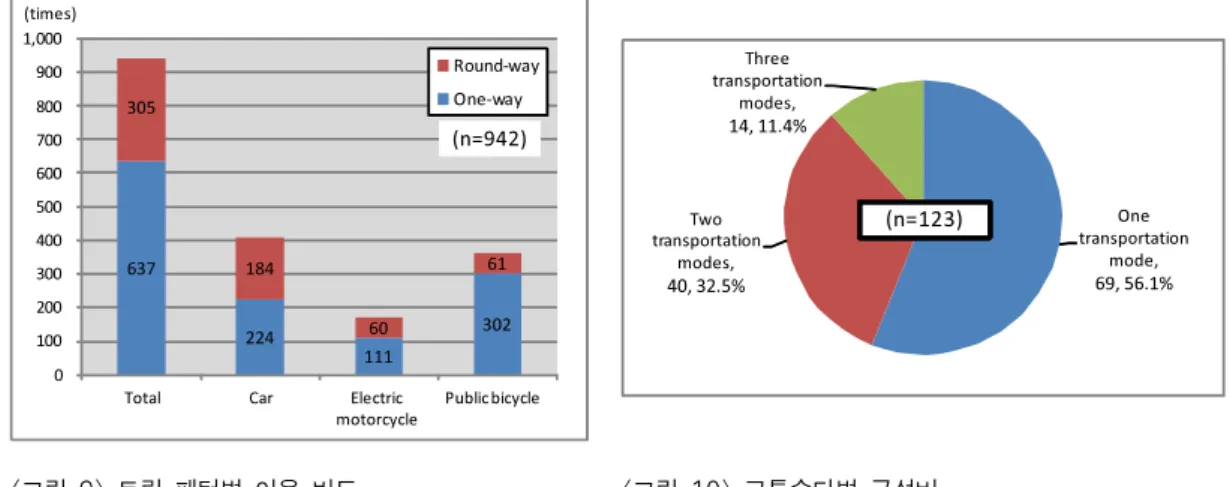
Figure 9 shows the usage frequency by trip
patterns in the field test period. According to
Figure 9, more than half of the users drove
one-way trips. Only 45.7% of users would be
able to use this service if it only serviced
round-trips, like existing car and electric
motorcycle sharing service. The public bicycle
637
224 111
302 305
184
60
61
0 100 200 300 400 500 600 700 800 900 1,000
Total Car Electric
motorcycle Public bicycle Round-way One-way (times)
(n=942)
transportation One mode, 69, 56.1%
transportation Two modes, 40, 32.5%
Three transportation
modes, 14, 11.4%
(n=123)
<그림 9> 트립 패턴별 이용 빈도
<Fig. 9> Usage frequency by trip patterns
<그림 10> 교통수단별 구성비
<Fig. 10> Proportion of transportation modes and electric motorcycle were used most for
commuting, and the proportion of one-way trips was higher compared to cars. Cars were primarily used for shopping compared to other vehicles, and the proportion of round-trips for cars was higher than other vehicles. In addition, mode choice is determined by several factors such as trip distance, trip purpose, economic ability, weather, etc.
Figure 10 shows the usage frequency by transportation mode. 43.9% of users used multi-transportation modes and can share various vehicles easily by this system. Through this system, users are able to select many transportation modes and this system can analyze the data in the integrated database.
4. Analysis of questionnaire
The questionnaire was held before and after the first test period(2011.6.8〜7.5) and asked all the monitors about the image transformation of this system. When users registered in the system, we distributed two questionnaires. One questionnaire is submitted at that time and
another questionnaire is submitted by users only via post after the first test period.
Figure 11 shows the result. The collecting ratio was 61.5% (64 respondents) before the first test period and 43.6% (24 respondents) after the first test period. Figure 11 indicates that the image transformation of the fare, usability, vehicle cleanliness, way of use and the time restriction became negative as a whole. In terms of fare (①), for example, 34.6% of users replied that it seemed expensive for a multi-mobility sharing system; however, 24.2%
of users indicated that it looked expensive before they had used the service. In terms of usability and way of use (②, ④), most users were unfamiliar with a vehicle sharing system, so we needed to improve the system.
The system manager maintains vehicles every
week, so the image transformation of vehicle
cleanliness (③) is not bad. Time restrictions
(⑤) were operation hours (8:00~19:00), business
holiday (Sunday) and valid reservation times (15
minutes). Users felt uncomfortable about this
system and operation hours and days changed to
24 hours a day on 1st October 2011.
<그림 11> 서비스 이용 전후 이미지 변화
<Fig. 11> Image transformation of the service before / after
Case. 1
Using only gasoline carsCase. 2
Current SystemCase. 3
Using only electronic vehicles Case1Gasoline car (Ministry of Economy, Trade
and Industry, Japan) 193.0g/km
Case 2,3
Toyota
Prius Hybrid 65.0g/km Mercedes-Benz
Smart Gasoline car 89.0g/km Mercedes-Benz
Electronic Vehicle 46.1g/km Yamaha
Electric Motorcycle 8.7g/km
※Carbon Dioxide Emission Units
1,472.6
286.3 117.8
351.9 26.312.6
0.0 500.0 1,000.0 1,500.0
Case. 1 Case. 2 Case. 3
Electric Motorcycle Prius Hybrid Electronic Vehicle Smart Gasoline car
Gasoline cars (kg/km)
-73.5%
-76.1%