• 검색 결과가 없습니다.

Reliability and validity of rehabilitative ultrasound images obtained using a hands-free fixed probe in measuring the muscle structures of the tibialis anterior and the gastrocnemius

N/A
N/A
Protected

Academic year: 2021

Share "Reliability and validity of rehabilitative ultrasound images obtained using a hands-free fixed probe in measuring the muscle structures of the tibialis anterior and the gastrocnemius"

Copied!
8
0
0

로드 중.... (전체 텍스트 보기)

전체 글

(1)

http://crossmark.crossref.org/dialog/?doi=10.14474/ptrs.2019.8.4.194&domain=pdf&date_stamp=2019-12-25

Received: 28 November, 2019 Revised: 10 December, 2019 Accepted: 12 December, 2019 Corresponding author: Wan-Hee Lee (ORCID https://orcid.org/0000-0001-8030-4853)

Department of Physical Therapy, College of Health Science, Sahmyook University, 815 Hwarang-ro, Nowon-gu, Seoul 01795, Republic of Korea Tel: 82-2-3399-1633 Fax: 82-2-3399-1639 E-mail: [email protected]

This is an Open-Access article distributed under the terms of the Creative Commons Attribution Non-Commercial License (http://creativecommons.org/licenses/

by-nc/4.0) which permits unrestricted non-commercial use, distribution, and reproduction in any medium, provided the original work is properly cited.

Copyright © 2019 Korean Academy of Physical Therapy Rehabilitation Science

https://doi.org/10.14474/ptrs.2019.8.4.194

pISSN 2287-7576 eISSN 2287-7584

Phys Ther Rehabil Sci 2019, 8 (4), 194-201 www.jptrs.org

Reliability and validity of rehabilitative ultrasound images obtained using a hands-free fixed probe in measuring the muscle structures of the tibialis anterior and the

gastrocnemius

Mun-Sang Choi

a

, Jang-Hoon Shin

b

, Hye-Kang Park

b

, Wan-Hee Lee

c

a

Team of Physical Therapy, National Traffic Rehabilitation Hospital, Yangpyeong, Republic of Korea

b

Department of Physical Therapy, The Graduate School, Sahmyook University, Seoul, Republic of Korea

c

Department of Physical Therapy, College of Health Science and Social Welfare, Sahmyook University, Seoul, Republic of Korea

Objective: This study aimed to investigate the reliability and validity of muscle thickness (MT) and pennation angle (PA) meas- urements of the ankle muscle, including the tibialis anterior (TA) and the medial gastrocnemius (MGCM), using a hands-free fixed probe and to compare it with the conventional linear probe.

Design: Observational inter-rater reliability study.

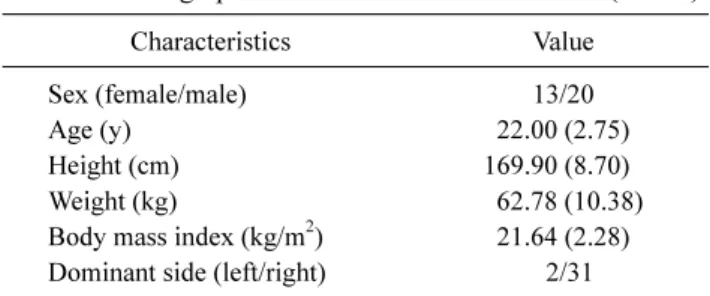
Methods: Thirty-three healthy subjects (20 male, 13 female) were included. In all subjects, ultrasound images were acquired from the TA and MGCM using a hands-free fixed probe and a conventional linear probe in random sequence by two examiners at two time-points within a 7-day interval. MT and PA were calculated on the taken images. Intra-class correlation coefficients (ICC), 95% confidence intervals, standard error of measurement and the Pearson’s correlation coefficient were used to estimate reliability and validity. And also, Bland-Altman plots were generated for a visual representation of MT and PA at the TA and MGCM.

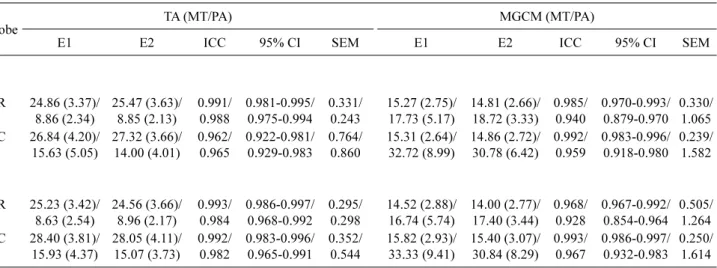
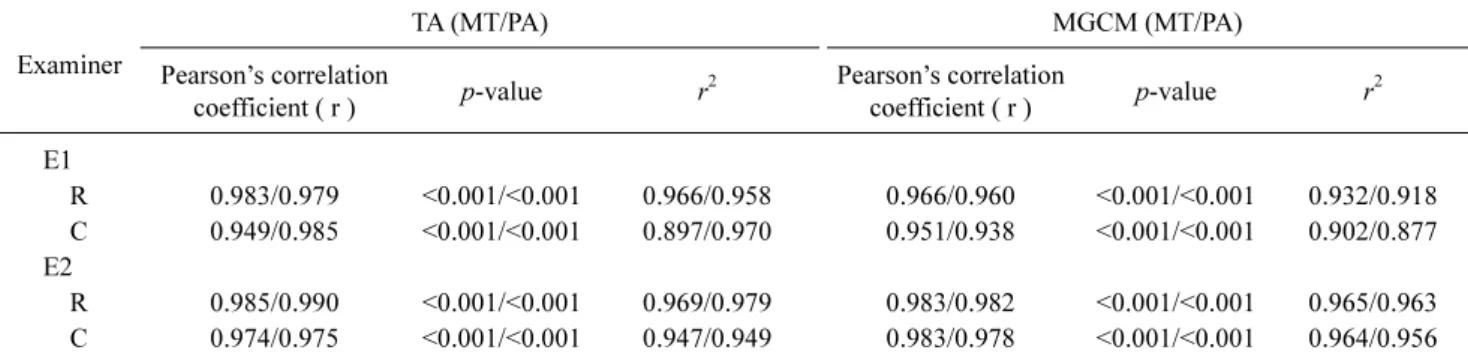
Results: The ICC for all intra-rater reliability was 0.943 to 0.995 and that for all inter-rater reliability was 0.928 to 0.993, indicat- ing excellent reliability. A significantly high correlation was observed between MT and PA at the TA and MGCM with use of the hands-free fixed probe and the conventional linear probe (r>0.938; p<0.001).

Conclusions: The hands-free fixed probe provided excellent images for measurement of the MT and PA of the TA and MGCM and is a useful device for making clinical measurements of muscle structure without grasping of the probe.

Key Words: Ankle, Muscle structure, Reliability, Ultrasonography, Ultrasound probe

Introduction

Excessive muscle co-contraction between the tibialis an- terior (TA) and the gastrocnemius (GCM) causes stiffness in the ankle joint and limits postural control [1]. The TA pro- vides a peripheral feedback mechanism modulating agonists such as the GCM in maintaining human upright posture and activates reciprocal inhibition that is more likely to be effec- tive for ankle strategy [2]. Young age and healthy status of individuals increases the frequency of using the ankle strat-

egy to maintain posture stability [3,4]. This means they use more reciprocal inhibition by the TA on the GCM, which produces less muscle co-contraction in the ankle joint.

Ankle movement is the primary maneuver after perturbation

in which muscle contraction at the ankle produces a torque

that rotates the body toward the support surface [5]. The lo-

cation of the center of pressure under each foot provides

neutral control of the ankle muscles, including the dorsi-

flexors and plantarflexors that regulate the body’s center of

gravity, which controls inverted pendulum during static

(2)

standing or anterior-posterior small perturbation [6].

Therefore, having control of the ankle muscles is important when implementing the ankle strategy.

Studies have reported that strengthening exercises of the ankle muscles or training can improve or reinforce ankle strategy, and evaluation methods such as magnetic reso- nance image (MRI) or ultrasound imaging system are useful in assessing changes in muscle function [7-9]. In functional movement of the human body, the structure-function rela- tionship of the muscle is an influencing factor of its function [10], and evaluation of muscle structure is useful to confirm if ankle strategy is appropriate or effective in postural con- trol during standing. As compared to MRI, ultrasound imag- ing is more convenient, cost-effective, and easy to use in evaluation of muscle function, and physical therapists con- sider it to be more user friendly. In addition, MRI can’t be applied during more dynamic situations such as movement by muscle contraction. Ultrasound imaging system provides high quality images of muscle structure including variables of muscle thickness (MT), pennation angle (PA), fascicle length and cross-sectional area [11-13], and can be used dur- ing clinical intervention for visual feedback to improve per- formance [14-16]. Recently introduced personal computer- based ultrasonography devices have promoted lower-cost ultrasound imaging [17,18].

For measurement or intervention with ultrasound imag- ing system, examiners commonly use the conventional line- ar probe but need to grasp the probe continuously during im- age acquisition; moreover, majority of subjects undergoing ultrasound imaging need to maintain in static positions dur- ing the examination period. Due to these limiting factors, ex- aminers face difficulty in obtaining measurement values and visual feedback under dynamic functional movements of the patient such as reaching, sit-to-stand position, and walking, and generally have to fix the probe to the limbs and trunk based on arbitrary estimation. Previous reports have in- dicated a method of using tape or a device to fix the conven- tional linear probe to the body for a hands-free approach [19-21]; however, to equip or fit the device to the conven- tional linear probe requires added time and higher cost.

Recently, in order to address the disadvantages of the con- ventional linear probe, a hands-free fixed probe was devel- oped with hooks attached on the posterior part that can be linked to a strap for fixation to the body, a design that is dif- ferent from the hands-free probe. As compared to the hands- free probe, the hands-free fixed probe has the advantage of allowing the examiner to perform the imaging technique

without having to hold the probe and to obtain constant ul- trasound image with less effort despite the patient’s dynamic movement. This study aimed to investigate the reliability and validity of the MT and PA measurements of the ankle muscles, including the TA and medial gastrocnemius (MGCM), by use of a hands-free fixed probe and to compare with the conventional linear probe.

Methods Participants

In this study, 33 healthy individuals (20 male, 13 female) were recruited. The sample size of the study was calculated by G*Power for Windows software (Free download version 3.1.9.4, Universitat Kiel, Kiel, Germany) with effect size 0.5 and power 0.8. The selection criterion for the subjects was no presence of musculoskeletal pain and having normal range of motion in the lower limbs. The exclusion criteria in- cluded musculoskeletal pain, limitation of motion in the lower limbs, and neuromuscular dysfunction due to damage of the central or peripheral nerve system. The study was ap- proved by the Institutional Review Board of Sahmyook University, Seoul (IRB No. SYUIRB 2-7001793- AB-N- 012019049HR).

Procedures

MT and PA were measured by using a hands-free fixed probe and conventional linear probe with a personal com- puter-based muscle viewer (PC-BMW) (MicrUs EXT-1H;

TELEMED, Vilnius, Lithuania) [13,17]. Images were ac-

quired with both a hands-free fixed probe and a conventional

linear probe at 12 MHz. The hands-free fixed probe is de-

signed with hooks that can link to the strap that wraps around

the limbs; the strap allows the probe to be attached to the

body and prevents movement during the measurement proc-

ess (Figure 1). The location of the probe was standardized in

all measurements as follows: the location for the TA was

marked at 1/3rd of the distance from the inferior border of

the patella to the lateral malleolus (Figure 1B) [22]; the loca-

tion for the MGCM was marked at 30% of the distance from

the popliteal crease to the midpoint of the lateral malleolus

(Figure 1C) [23]. For assessment of the TA, the subject was

placed in supine position on a table with the feet hanging

over the edge and neutral position of the hip joint with knee

extension. For image acquisition under rest and muscle con-

traction, subjects were asked to relax their ankle and then

perform maximal voluntary contraction. All measurements

(3)

Figure 2. Ultrasound image of muscle thickness (MT) and pennation angle (PA) at (A) tibialis anterior and (B) medial gastrocnemius.

Figure 1. (A) Measuring muscle struc- ture using a hands-free fixed probe linked to PC-BMW. The location of the hands-free fixed probe for (B) tibialis anterior and (C) medial gastrocne- mius.

were performed three times with each condition. For assess- ment of the MGCM, the subject was placed in prone posi- tion, and the same protocol as in the TA was applied.

The image was captured when muscle architecture such as the aponeuroses or the PA was clearly distinguishable on the monitor. To calculate the muscle structure of the TA, MT was measured between the superficial and deep aponeu- roses, and PA was measured between the muscle fascicles and middle aponeurosis (Figure 2A) [22]. In addition, at the MGCM, MT was measured between the superficial and deep aponeuroses, and PA was measured between the mus- cle fascicles and the deep aponeurosis (Figure 2B) [23].

Image calculation including MT and PA was performed us-

ing the PC-BMW with a proprietary software (Echo wave II ver. 3.7.1). All measurements were performed by two exam- iners with two probes on 2 separate days at an interval of 7 days.

Statistical analysis

For descriptive statistics, all demographic data were ana-

lyzed. To describe the intra- and inter-rater reliability of the

MT and PA of the TA and MGCM during rest and contrac-

tion, intra-class correlation coefficients (ICC) and 95% con-

fidence intervals (CI) were calculated. ICC of <0.50 was con-

sidered as poor, 0.50 to 0.75 as moderate to good, and >0.75

as excellent reliability [24]. The standard error of measure-

(4)

Table 2. Intra-rater reliability between repeated measures on the conventional linear probe and hands-free fixed probe for TA &

GCM MT and PA (2 days unit: mm/°) (N =33)

Examiner TA (MT/PA) MGCM (MT/PA)

CP HP ICC 95% CI SEM CP HP ICC 95% CI SEM

1st day E1

R 25.23 (3.42)/

8.63 (2.54) 24.86 (3.37)/

8.86 (2.34) 0.991/

0.988 0.983-0.996/

0.976-0.994 0.320/

0.266 14.52 (2.88)/

16.74 (5.74) 15.27 (2.75)/

17.73 (5.17) 0.982/

0.977 0.964-0.983/

0.953-0.988 0.379/

0.826 C 28.40 (3.81)/

15.93 (4.37) 26.84 (4.20)/

15.69 (5.05) 0.971/

0.988 0.942-0.986/

0.975-0.994 0.691/

0.545 15.82 (2.93)/

33.33 (9.41) 15.31 (2.64)/

32.72 (8.99) 0.972/

0.968 0.944-0.986/

0.935-0.984 0.466/

1.634 E2 R 24.56 (3.66)/

8.96 (2.17) 25.47 (3.63)/

8.85 (2.13) 0.992/

0.995 0.985-0.996/

0.989-0.997 0.326/

0.151 14.00 (2.77)/

17.40 (3.44) 14.81 (2.66)/

18.72 (3.33) 0.991/

0.991 0.982-0.996/

0.981-0.995 0.259/

0.325 C 28.05 (4.11)/

15.07 (3.73) 27.32 (3.66)/

14.00 (4.01) 0.984/

0.986 0.967-0.992/

0.971-0.993 0.490/

0.459 15.40 (3.07)/

30.84 (8.29) 14.86 (2.72)/

30.78 (6.42) 0.988/

0.973 0.975-0.994/

0.945-0.987 0.917/

1.209 2nd day

E1

R 25.48 (4.09)/

8.88 (2.73) 26.14 (3.57)/

8.67 (2.21) 0.990/

0.973 0.980-0.995/

0.945-0.987 0.383/

0.405 14.89 (2.90)/

18.29 (3.62) 14.84 (2.77)/

18.05 (4.67) 0.981/

0.979 0.961-0.991/

0.957-0.989 0.388/

0.602 C 28.63 (3.92)/

16.59 (5.10) 26.99 (3.69)/

16.43 (4.93) 0.995/

0.982 0.989-0.997/

0.963-0.991 0.273/

0.668 15.72 (3.40)/

33.76 (8.93) 15.19 (3.85)/

31.79 (9.66) 0.943/

0.994 0.885-0.972/

0.988-0.997 0.498/

0.719 E2

R 24.83 (4.16)/

8.62 (2.45) 25.84 (4.00)/

8.87 (2.32) 0.994/

0.975 0.989-0.997/

0.950-0.988 0.316/

0.375 13.45 (2.69)/

15.75 (3.65) 14.60 (2.91)/

17.16 (4.68) 0.984/

0.981 0.967-0.992/

0.961-0.990 0.360/

0.567 C 27.63 (4.33)/

15.39 (3.67) 27.42 (3.68)/

14.44 (3.32) 0.984/

0.982 0.968-0.992/

0.963-0.991 0.504/

0.470 14.88 (3.07)/

28.39 (7.11) 15.15 (3.20)/

29.50 (6.64) 0.992/

0.994 0.984-0.996/

0.988-0.997 0.279/

0.530 Values are presented as mean (SD).

TA: tibialis anterior, MGCM: medial gastrocnemius, MT: muscle thickness, PA: pennation angle, CP: conventional linear probe, HP: hands-free fixed probe, ICC: intra-class correlation coefficient, CI: confidence interval, SEM: standard error of the mean, E1: examiner 1, E2: examiner 2, R: rest, C: contraction.

Table 1. Demographic characteristics (N =33)

Characteristics Value

Sex (female/male) 13/20

Age (y) 22.00 (2.75)

Height (cm) 169.90 (8.70)

Weight (kg) 62.78 (10.38)

Body mass index (kg/m

2

) 21.64 (2.28)

Dominant side (left/right) 2/31

Values are presented as number only or mean (SD).

ment (SEM) was calculated using the formula: standard de- viation ×    based on the reliability coefficients.

Bland-Altman plots were generated for visual representa- tion of the MT and PA at the TA and MGCM. To investigate the linear relationship between the hands-free fixed probe and conventional linear probe, the Pearson’s correlation co- efficient (r) and r

2

were used. Statistical analysis was per- formed using the IBM SPSS Statistics for Windows, Version 21.0 (IBM Co., Armonk, NY, USA).

Results

Demographic characteristics

Participant characteristics were as follows: Thirty-tree healthy participants (20 male individuals and 13 female in- dividuals) with mean age of 22.00±2.75 years were noted;

the mean height was 169.90±8.70 cm; the mean weight was 62.78±10.38 kg; the mean body mass index was 21.64±2.28 kg/m

2

(Table 1).

Intra-rater reliability analysis

Intra-rater reliability data of the MT and PA for the TA and MGCM by two raters at two sessions is shown in Table 2.

For the TA, the ICC (95% CI) of MT was 0.991-0.995 (0.942-

0.997), and that of PA was 0.973-0.995 (0.945-0.997). For

the MGCM, ICC (95% CI) of MT was 0.943-0.992 (0.885-

0.996), and that of PA was 0.968-0.994 (0.935-0.0.997).

(5)

Table 3. Inter-rater reliability between repeated measures on hands-free fixed probe and the conventional linear probe for TA &

GCM MT and PA (unit: mm/°) (N =33)

Probe TA (MT/PA) MGCM (MT/PA)

E1 E2 ICC 95% CI SEM E1 E2 ICC 95% CI SEM

HP

R 24.86 (3.37)/

8.86 (2.34) 25.47 (3.63)/

8.85 (2.13) 0.991/

0.988 0.981-0.995/

0.975-0.994 0.331/

0.243 15.27 (2.75)/

17.73 (5.17) 14.81 (2.66)/

18.72 (3.33) 0.985/

0.940 0.970-0.993/

0.879-0.970 0.330/

1.065 C 26.84 (4.20)/

15.63 (5.05) 27.32 (3.66)/

14.00 (4.01) 0.962/

0.965 0.922-0.981/

0.929-0.983 0.764/

0.860 15.31 (2.64)/

32.72 (8.99) 14.86 (2.72)/

30.78 (6.42) 0.992/

0.959 0.983-0.996/

0.918-0.980 0.239/

1.582 CP

R 25.23 (3.42)/

8.63 (2.54) 24.56 (3.66)/

8.96 (2.17) 0.993/

0.984 0.986-0.997/

0.968-0.992 0.295/

0.298 14.52 (2.88)/

16.74 (5.74) 14.00 (2.77)/

17.40 (3.44) 0.968/

0.928 0.967-0.992/

0.854-0.964 0.505/

1.264 C 28.40 (3.81)/

15.93 (4.37) 28.05 (4.11)/

15.07 (3.73) 0.992/

0.982 0.983-0.996/

0.965-0.991 0.352/

0.544 15.82 (2.93)/

33.33 (9.41) 15.40 (3.07)/

30.84 (8.29) 0.993/

0.967 0.986-0.997/

0.932-0.983 0.250/

1.614 Values are presented as mean (SD).

TA: tibialis anterior, MGCM: medial gastrocnemius, MT: muscle thickness, PA: pennation angle, E1: examiner 1, E2: examiner 2, ICC:

intra-class correlation coefficient, CI: confidence interval, SEM: standard error of the mean, HP: hands-free fixed probe, CP: conventional linear probe, R: rest, C: contraction.

SEM of the TA was 0.151-0.691, and that of the MGCM was 0.259-1.634.

Inter-rater reliability analysis

For the TA, ICC (95% CI) for all measures was 0.952- 0.997 (0.922-0.997), and SEM was 0.243-0.860. For the MGCM, ICC (95% CI) was 0.928-0.993 (0.879-0.996), and SEM was 0.239-1.614 (Table 3). Bland-Altman plots for in- ter-rater reliability between the two examiners (E1 and E2) are shown in Figure 3.

Correlation between MT and PA taken from two probes Good correlation was observed among the hands-free fixed probe and conventional linear probe measurement values of MT and PA (r>0.938; p<0.001) by E1 and E2 (Table 4).

Discussion

In ultrasound imaging to assess muscle structure or pro- vide visual feedback, examiners usually use a hand-held conventional linear probe with continuous manual grasp to obtain consistent images during the measurement period, which is a disadvantage that limits functional evaluation of the muscle during dynamic performance or voluntary move- ment; the hands-free fixed probe was developed to over- come this limitation. As compared to the hands-free probe, the special design of the hands-free fixed probe contributes

to rapid and cost-effective equipping of the device or fitting to the conventional linear probe. Therefore, in this study, we determined the reliability and validity of the measurements made by use of a hands-free fixed probe versus a conven- tional linear probe. Our results showed that the ICC for all intra-rater reliability of 0.943 to 0.995 was obtained and that for all inter-rater reliability of 0.928 to 0.993 were obtained, indicating excellent reliability. A significantly high correla- tion was observed between MT and PA of the TA and MGCM assessed by the hands-free fixed probe and conven- tional linear probe (r>0.938; p<0.001).

In this study, MT and PA measurements of the TA as- sessed by the hands-free fixed probe achieved excellent in- tra-rater reliability (ICC of TA MT: E1=0.990-0.995 and E2=0.984-0.994; ICC of PA: E1=0.973-0.988 and E2=0.975- 0.995; SEM range: 0.273-0.691 mm and 0.151o-0.668o, re- spectively) and inter-rater reliability (ICC of MT: 0.962- 0.992; ICC of PA: 0.965-0.988). McCreesh and Egan [25]

reported that with ultrasound, the TA MT using a conven-

tional linear probe achieved excellent inter-rater reliability

(ICC [95% CI]: 0.992-0.997 [0.981-0.998]), with no differ-

ence between longitudinal and transverse measurement

values. In our study, we obtained longitudinal measurement

values of the TA because those images clearly differentiate

the landmarks of the aponeuroses in the image analysis,

which enabled calculation of both PA and MT and excellent

reliability of both MT and PA at the TA.

(6)

Figure 3. Bland-Altman plots illus- trating the difference of ultrasound im- age for tibialis anterior (A-D) and me- dial gastrocnemius (E-H) between ex- aminers 1 and 2 for inter-rater reli- ability.

Moreover, MT and PA at the MGCM assessed with the hands-free fixed probe showed excellent intra-rater reli- ability (ICC of MGCM MT: E1=0.943-0.982 and E2=0.984- 0.992; ICC of PA: E1=0.968-0.994 and E2=0.973-0.994;

SEM range: 0.259-0.498 mm and 0.325o-1.634o, respec- tively) and inter-rater reliability (ICC of MT: 0.968-0.993;

ICC of PA: 0.928-0.967). The results of our study are com-

parable to those of excellent reliability of the MGCM meas-

urement values using the developed probe (ICC: 0.988-0.997)

in Barber et al. [26,27] and other studies on the MGCM mus-

cle structure using a similar method [13]. However, our re-

sults indicated higher SEM for PA compared to that for MT,

(7)

Table 4. Correlations between TA & GCM MT and PA measurements taken from hands-free fixed probe and the conventional linear probe (N =33)

Examiner

TA (MT/PA) MGCM (MT/PA)

Pearson’s correlation

coefficient ( r ) p-value r

2

Pearson’s correlation

coefficient ( r ) p-value r

2

E1

R 0.983/0.979 <0.001/<0.001 0.966/0.958 0.966/0.960 <0.001/<0.001 0.932/0.918 C 0.949/0.985 <0.001/<0.001 0.897/0.970 0.951/0.938 <0.001/<0.001 0.902/0.877 E2 R 0.985/0.990 <0.001/<0.001 0.969/0.979 0.983/0.982 <0.001/<0.001 0.965/0.963

C 0.974/0.975 <0.001/<0.001 0.947/0.949 0.983/0.978 <0.001/<0.001 0.964/0.956 TA: tibialis anterior, MGCM: medial gastrocnemius, MT: muscle thickness, PA: pennation angle, E1: examiner 1, E2: examiner 2, R: rest, C: contraction.

and under contraction as compared to rest, which may be due to the higher standard deviation of PA at the MGCM under contraction.

We compared the validity of measurement of MT and PA at the TA and MGCM between the hands-free fixed probe and the conventional linear probe; our results indicated high correlation among TA measurement values by the two probes (MT: E1=0.983 and E2=0.985 at rest; E1=0.949 and E2=

0.974 at contraction; PA: E1=0.979 and E2=0.990 at rest;

E1=0.985 and E2=0.975 at contraction) and among those at the MGCM by the two probes (MT: E1=0.966 and E2=0.983 at rest; E1=0.951 and E2=0.983 at contraction; PA: E1=

0.960 and E2=0.982 at rest; E1=0.938 and E2=0.978 at con- traction). The results of our study are comparable to those of other studies assessing validity between newly developed ultrasound devices or methods and conventional devices or methods [13,17,26,27].

The hands-free fixed probe eliminates the need to hold the probe during the measurement process by the ultrasound imaging system, and the data obtained are submitted to an built-in PC-BMW software with the capability of simulta- neous measurement and image analysis. Reports have in- dicated that PC-BMW has excellent reliability [13,17], and PC-BMW connected to a hands-free fixed probe provides added advantage. Our study has the limitation of not con- ducting the measurements under dynamic conditions or ac- tivities; further study is needed to assess muscle structure in situations including dynamic performance or functional movement. Our finding suggests that the hands-free fixed probe provides excellent images for measurement of MT and PA of the TA and MGCM and is a potentially useful clin- ical device for measurement of muscle structure without having to hold onto the probe.

Acknowledgements

This work was supported by the National Research Foun- dation (NRF) grant funded by Korea government (No. NRF- 2018R1D1A1B07042870).

Conflict of Interest

The authors declared no potential conflicts of interest with respect to the authorship and/or publication of this article.

References

1. Iwamoto Y, Takahashi M, Shinkoda K. Differences of muscle co- contraction of the ankle joint between young and elderly adults during dynamic postural control at different speeds. J Physiol Anthropol 2017;36:32.

2. Di Giulio I, Maganaris CN, Baltzopoulos V, Loram ID. The pro- prioceptive and agonist roles of gastrocnemius, soleus and tibia- lis anterior muscles in maintaining human upright posture. J Physiol 2009;587(Pt 10):2399-416.

3. Maki BE, Edmondstone MA, McIlroy WE. Age-related differ- ences in laterally directed compensatory stepping behavior. J Gerontol A Biol Sci Med Sci 2000;55:M270-7.

4. Mueller MJ, Minor SD, Sahrmann SA, Schaaf JA, Strube MJ.

Differences in the gait characteristics of patients with diabetes and peripheral neuropathy compared with age-matched controls.

Phys Ther 1994;74:299-308; discussion 309-13.

5. Hertel J. Functional instability following lateral ankle sprain.

Sports Med 2000;29:361-71.

6. Winter DA. Human balance and posture control during standing and walking. Gait Posture 1995;3:193-214.

7. Robinovitch SN, Heller B, Lui A, Cortez J. Effect of strength and speed of torque development on balance recovery with the ankle strategy. J Neurophysiol 2002;88:613-20.

8. de Jesus JO, Parker L, Frangos AJ, Nazarian LN. Accuracy of

MRI, MR arthrography, and ultrasound in the diagnosis of rota-

(8)

tor cuff tears: a meta-analysis. AJR Am J Roentgenol 2009;192:

1701-7.

9. Pillen S, van Alfen N. Skeletal muscle ultrasound. Neurol Res 2011;33:1016-24.

10. Neumann DA, Kelly ER, Kiefer CL, Martens K, Grosz CM.

Kinesiology of the musculoskeletal system: foundations for re- habilitation. 3rd ed. St. Louis: Elsevier; 2017.

11. Scott JM, Martin DS, Ploutz-Snyder R, Caine T, Matz T, Arzeno NM, et al. Reliability and validity of panoramic ultrasound for muscle quantification. Ultrasound Med Biol 2012;38:1656-61.

12. Whittaker JL, Stokes M. Ultrasound imaging and muscle func- tion. J Orthop Sports Phys Ther 2011;41:572-80.

13. Cho JE, Cho KH, Yoo JS, Lee SJ, Lee WH. Reliability and val- idity of a dual-probe personal computer-based muscle viewer for measuring the pennation angle of the medial gastrocnemius mus- cle in patients who have had a stroke. Top Stroke Rehabil 2018;

25:6-12.

14. Van K, Hides JA, Richardson CA. The use of real-time ultra- sound imaging for biofeedback of lumbar multifidus muscle con- traction in healthy subjects. J Orthop Sports Phys Ther 2006;36:

920-5.

15. Yoo JS, Ha HG, Jeong JR, Ko YJ, Lee W. Physical therapist per- ception survey for muscle re-education through visual feedback obtained from rehabilitative ultrasound imaging. Phys Ther Re- habil Sci 2016;5:47-52.

16. Cho JE, Hwang DY, Hahn J, Lee WH. Use of real-time ultra- sound imaging for biofeedback of diaphragm motion during nor- mal breathing in healthy subjects. Phys Ther Rehabil Sci 2018;

7:95-101.

17. Jeong JR, Han JH, Cho JE, Lee W. Reliability and validity of a personal computer based muscle viewer for measuring upper tra- pezius and transverses abdominis muscle thickness. Phys Ther

Rehabil Sci 2016;5:155-61.

18. Hahn J, Ha HG, Lee HJ, Lim S, Lee W. The reliability of dual re- habilitative ultrasound imaging measurements for muscle co-activation. Phys Ther Rehabil Sci 2017;6:152-7.

19. DeJong AF, Mangum LC, Resch JE, Saliba SA. Detection of glu- teal changes using ultrasound imaging during phases of gait in individuals with medial knee displacement. J Sport Rehabil 2018;28:494-504.

20. Arya S. Ultrasound-guided vascular access - a hands-free option.

J Intensive Care Soc 2015;16:360.

21. Chandraratna PA, Vijayasekaran S, Brar P, Tzeng J. "Hands- Free" continuous transthoracic monitoring of pericardiocentesis using a novel ultrasound transducer. Echocardiography 2003;20:

491-4.

22. Mah JK, van Alfen N. Neuromuscular ultrasound: clinical appli- cations and diagnostic values. Can J Neurol Sci 2018;45:605-19.

23. Cho KH, Lee HJ, Lee WH. Reliability of rehabilitative ultra- sound imaging for the medial gastrocnemius muscle in post- stroke patients. Clin Physiol Funct Imaging 2014;34:26-31.

24. Mota P, Pascoal AG, Sancho F, Bø K. Test-retest and intrarater reliability of 2-dimensional ultrasound measurements of dis- tance between rectus abdominis in women. J Orthop Sports Phys Ther 2012;42:940-6.

25. McCreesh K, Egan S. Ultrasound measurement of the size of the anterior tibial muscle group: the effect of exercise and leg do- minance. Sports Med Arthrosc Rehabil Ther Technol 2011;3:18.

26. Barber L, Barrett R, Lichtwark G. Validation of a freehand 3D ul- trasound system for morphological measures of the medial gas- trocnemius muscle. J Biomech 2009;42:1313-9.

27. Barber L, Barrett R, Lichtwark G. Validity and reliability of a

simple ultrasound approach to measure medial gastrocnemius

muscle length. J Anat 2011;218:637-42.

수치

Figure 2. Ultrasound image of muscle thickness  (MT)  and  pennation  angle  (PA)  at  (A)  tibialis  anterior  and  (B)  medial gastrocnemius.
Table  2. Intra-rater reliability between repeated measures on the conventional linear probe and hands-free fixed probe for TA &amp;
Table  3. Inter-rater reliability between repeated measures on hands-free fixed probe and the conventional linear probe for TA &amp;
Figure 3.  Bland-Altman  plots  illus- illus-trating the difference of ultrasound  im-age for tibialis anterior (A-D) and  me-dial gastrocnemius (E-H) between  ex-aminers  1  and  2  for  inter-rater   reli-ability.
+2

참조

관련 문서

1 John Owen, Justification by Faith Alone, in The Works of John Owen, ed. John Bolt, trans. Scott Clark, &#34;Do This and Live: Christ's Active Obedience as the

Injury is a burden on athletes, but the rehabilitation exercise of this study suggests that the improvement of knee muscle function and knee function

In the change of physical strength, The exercise group showed statistically significant differences in muscle strength(right), muscle strength(left),

Objectives: This study aimed to investigate the relationship between job stress and turnover intention of employed opticians and to investigate the mediating effect of burnout

Second, exploratory factor analysis and Cronbach's α were conducted to analyze the validity and reliability of the questionnaire regarding participation

This study has the purpose to investigate the applicability of different thickness aluminium alloys by friction stir welding to vehicle body and to

This study was to do a comparative analysis on kinematic differences and differences in muscle activity between the skilled and the unskilled in windsurfing

Greco-Roman wrestlers of high school, college, and the professionals players showed significant differences depending on their performance when measuring the maximum muscle