- 91 - https://doi.org/10.38121/kpea.2021.06.37.2.91
지중해 컨테이너항만의 효율성 분석에 관한 연구
오사마 이브라힘 * ․ 김현덕 **
A Study on the Efficiency of Container Ports in the Mediterranean Sea
Ousama Ibrahim Hassan Ibrahim ․ Kim, Hyun Deok
Abstract
The current increasing size of container vessels affects the container port’s situation. The contain- erization has changed the inter-modal handling process, which brought more flexibility and comfort- ableness in the shipping industry sector. Thus, it is very crucial to analyze the efficiency of con- tainer ports in the regional sphere. Such kind of efficiency analysis provide a powerful manage- ment tool for port operators and shipping managers in the Mediterranean market, and it also helps to form an information for planning new regional and national port operations.
This paper aims to analyze the ports' technical efficiency of Mediterranean major container ports.
It is conducted to establish the model of port performance and efficiency through the empirical test of the various factors. Regarding to the panel data collected from the 48 DMUs (decision making units), this study attempts to provide the empirical basis of the port efficiency relative to another factors in the total port performance.
Due to the complexity of the various activities carried out at container ports, the study focuses only on the technical efficiency at the level of the Mediterranean container port. Unlike the prac- tice of cross-sectional data analysis, originally established by Charnes et al. (1985), the panel data in DEA window analysis applications are used.
The main focus of this study is the relative technical efficiency of 12 container ports from 7 countries in the Mediterranean market. The selection of ports under study is based on their high handling capability and rankings in World Top 100 (Containerization International, 2018).
Key words: Port efficiency, Mediterranean seaport, Technical efficiency, Al locative efficiency, Sensitivity analysis, DEA-CCR, DEA-BCC
▷ 논문접수: 2021. 05. 31. ▷ 심사완료: 2021. 07. 04. ▷ 게재확정: 2021. 07. 04.
* 순천대학교 물류학과 박사, 제1저자, [email protected]
** 순천대학교 물류학과, 교수, 교신저자, [email protected]
Ⅰ. Introduction
The Mediterranean major ports are seeking for the new challenging roles such as being hubs and local gates in the market. Thus, it is very important to analyze the efficiency of container ports in the regional sphere(Cullinane et al, 2006). Such kind of efficiency analysis can not only provide a powerful management tool for port operators and shipping managers in the Mediterranean market, but it also helps to form an information for planning new regional and national port operations(Adler and Golany, 2001).
The containerization has significantly improved the maritime trade by reduction of handling time, labor and operation costs, and also packing costs. It has also allowed the high combination between shipping and multi-modal transportation through providing a flexibility and comfort- ableness to loading & unloading movements (Rodrigue et al, 2013). Thus, the containerization has changed the inter-modal handling process, which brought more flexibility and comfort- ableness in the shipping industry sector.
The trade routes within the Mediterranean Sea have played an important role in connecting East Asian and European trade. In last two decades, the Mediterranean container ports have adapted to the new changes such as creating the new transshipment and logistics centers. In the begin- ning of 2000s, the Mediterranean container ports also started to develop the logistic strategies in connecting Southern Europe and Northern Africa markets(Schinas & Papadimitriou, 2001).
Major hub ports in the Mediterranean Region (Eastern and Central Mediterranean) are compet-
ing for more market shares from the containers at the Eastern Mediterranean, Black Sea, Adriatic Sea, and Balkan countries(Yetkeli et al., 2016).
Marsaxlokk on Malta, Gioia Tauro in Italy and Algeciras in Spain play as platform in a raising sea-sea transshipment business in the region.
These platforms were selected to serve continent for transshipping in the mid-points of trade lanes, and for the potential productivity and the cost control(Rodrigue (2017).
According to the Clarkson Database (2019), Far East, Europe and North America market’ import and export have gradually increased in last 10 years. While Far East imported 46.7 million tons of cargo, followed by Europe (27.1 million tons) and North America 18 million of tons) in 2009;
the cargo quantity in Far East’s import has slight- ly doubled by 81.4 millions of ton (85.2% of change in 10 years) in 2018, Europe has in- creased by 38.3 million of tons (51% of change), and North America reached 28 million tons of cargo (56.7% of change).
The Mediterranean Sea region geographically grouped coastal countries and several ports around its shores. The Mediterranean region is the area around the Mediterranean Sea connect- ing three continent: Southern Europe, Asia (Middle East) and Northern Africa (Notteboom, 2012).
The reasons for the focus in the Mediterranean are multiple:
First, the Mediterranean has a strategic geo-
graphical location that makes it one of the pref-
erable transshipment areas in the world. It is lo-
cated along one of the major shipping trade
routes: from Southeast Asia to Northern Europe
and to America’s West coast(Elsayeh, 2015).
Second, there is a significant increase in local origin and destination (OD) traffic. Currently, around the Mediterranean there are significant and growing origin and destination markets in Southern Europe, North Africa and Middle East.
The growth of container traffic was particularly high, expanding by over 10% a year(Gouvernail et al, 2005).
Third, the Mediterranean container market structure is changing. In order to accommodate the increasing local and transshipment demand, a large hub and feeder container system and short sea shipping network has developed in the Mediterranean region(Elsayeh, 2015).
Finally, China OBOR effects to this region enormously recent years. Robust volume growth across China, backed by other strong regional performances, beefed up global throughput fig- ures in 2018. Volumes among the top 100 ports rose by an average of 4.8% last year(Nightingale, 2019).
The main goal of this paper is to analyze the impact of ports' technical efficiency of Mediterranean major container ports and to pro- vide the empirical basis of the port efficiency relative to another factors in the total port performance. This study will also contribute to help port and shipping operators to optimize their resources in efficient way and set strategic plans that enable to satisfy their customers' needs. Thus, the research objectives are to ana- lyze the Mediterranean container ports com- petitiveness through studying the dynamics of the Mediterranean container port market.
Recently the relationship between port oper-
ators and shipping alliances has taken central stage in determining the port efficiency and port competitiveness. This relationship allows port op- erators, and port users to be able to optimize their customs needs(Notteboom, 2012).
The Mediterranean major ports are seeking for the new challenging roles such as being hubs and local gates in the market. Thus, it is very important to analyze the efficiency of container ports in the regional sphere(Cullinane et al, 2006). Such kind of efficiency analysis can not only provide a powerful management tool for port operators and shipping managers in the Mediterranean market, but it also helps to form an information for planning new regional and national port operations(Adler and Golany, 2001).
Due to the complexity of the various activities carried out at container ports, this research fo- cuses only on the technical efficiency at the lev- el of the Mediterranean container port. Unlike the practice of cross-sectional data analysis, origi- nally established by Charnes et al.(1985), the panel data in DEA window analysis applications are used. They do not only benchmark the effi- ciency of DMUs (each panel data container ports in the relevant years), but also identify the changes of the DMUs' efficiency scores over a specified time period(Cullinane & Wang, 2010).
A set of panel data for the given observations subsets is used in order to evaluate the effi- ciency of an individual DMU(Tulkens and van den Eeckaut, 1995).Data are mainly collected from different issues of the Containerization International Yearbooks.
This research focuses on studying the relative
technical efficiency of 12 container ports from
seven countries in the Mediterranean market.
These ports are Valencia, Algeciras, Barcelona from Spain; Gioia Tauro, Genoa from Italy;
Ambarli, Mersin from Turkey; Piraeus from Greece; Marsaxlokk from Malta; Port Said, Alexandria from Egypt; and Tanger Med from Morocco. The selection of ports under study is based on their high handling capability and rank- ings in World Top 100 (Containerization International, 2018). The research assesses the port technical efficiency in the Mediterranean container ports for four time periods, such as 1999, 2004, 2009 and 2017.
II. Literature Review
The efficiency is a basic concept in the field of economics and it is focused on the economic utilization of the resources for pro- duction(Cullinane & Wang, 2007).
Significant achievements have been done in examining the productivity and the efficiency in the port market. The methods commonly used on the port efficiency are Data Envelopment Analysis(DEA) and Stochastic Frontier Analysis(SFA) in the port industry. Roll and Hayuth(1993) in- troduced the DEA-CCR model in the port industry for the first time. Later researchers have attempted to study the relation between the port size and the port efficiency(Liu, 1995; Cullinane et al, 2002;
Martinez-Budria et al, 1999).
They suggested that the larger port could be- come the more efficiency port. Martinez-Budria et al.(1999) classified the Spanish port authorities in- to three correspond groups by applying complex-
ity criteria. They examined the efficiency of these ports by using DEA-BCC model. Notteboom et al.(2000) compared the technical efficiency of European container terminal companies with the four major container terminals in Asia.
Tongzon(2001) got the same results and af- firmed that port size is not the main factor in the port efficiency. He used the DEA-CCR model to evaluate the efficiency of 4 Australian and 12 other international container ports for the year 1996. Tongzon and Heng(2005) used the SFA, the Stochastic Cobb-Douglas model, and the competitiveness regression to estimate the effi- ciency and competitiveness of the top 25 con- tainer ports introducing a relationship between technical efficiency and port size. Cullinane and Song (2006) used the SFA for estimating the technical efficiency among European container terminals. They estimated the relative technical efficiency using the cross-sectional version of the stochastic frontier model.
Al-Eraqi et al. (2010) used the DEA window analysis model providing information based on the analysis input and outputs of 22 ports in the Middle East and the Eastern Africa. They found that the small ports are more efficient than the large ports in the region. Valentine and Gray(2001) used the DEA-CCR model to 31 con- tainer ports from the World top 100 container ports in 1998. Barros(2003) used the DEA-CCR/BCC and allocative efficiency models to assess the efficiency for the Portuguese ports.
Barros and Athanassiou(2004) recognized the same
problem in their research when they employed the
DEA-CCR/BCC models to evaluate the efficiency of
two Greek and four Portuguese ports. Cullinane et
al.(2006) applied DEA and SFS on the world ma- jor container ports to analyze the impact of privatization.
Wang et al.(2003) and later Cullinane et al.(2005) compared the analysis results taken by the DEA-CCR / BCC models. Lin and Tseng(2007) also compared among the efficiency scores taken from the DEA-CCR, and DEA-BCC models. So et al.(2007) applied the output ori- ented DEA-CCR / BCC models to analyze the container port efficiency of 19 major container ports in the Northeast Asia region. Gao et al.(2010) employed DEA-CCR model to evaluate the scale efficiency of Shenzhen port. Choi (2011) analyzed the efficiency of 13 container ports in the Northeast Asia region from 2005 to 2007.
Wanke et al.(2011) reported on the use of various models for evaluating the efficiency of main Brazilian ports. They performed two ap- proaches, DEA and SFA, on data gathered from 25 ports in 2008. Lu et al. (2015) applied the DEA models to benchmark the technical effi- ciency of the Top 20 world major container ports in 2009. Niavis and Tsekeris (2012) identi- fied major causal factors to the technical effi- ciency of container ports in the South-Eastern Europe region.
The previous studies on port efficiency illus- trates different aspects. The researchers focused on ports in different container markets such as North Europe, Northeast Asia, North America and Latin America. However, the studies on the Mediterranean container ports are limited in scope due to the difficulty of data accessibility;
they use the secondary data from only a single
country, comparing ports in two or more coun- tries, or use only the Mediterranean regional ports not in total.
Growth in the West Med increased significantly in the three largest markets, Spain, Italy, and France(Clarkson, 2018) (Figure 2). Container ship ca- pacity in the westbound Asia to Mediterranean route continues to rise sharply, driven by the cascade of bigger ships into the market (Drewry, 2018).
Constantly increase of trade volumes in Far east and North Europe in last decade has brought new opportunity to the Mediterranean region. Cargo volumes across the region grew by an impressive 7.1% in 2018.
Valencia still held its rank as the Mediterranean region’s top container port. It achieved 7.3%
growth in 2018 and increased their record, the 5 million TEU for the first time. Valencia port has in inter-port competition with another Spanish domestic Algeciras port. Despite of 8.7% growth, Algeria went lost its 2nd position to Greece’s fast growing Piraeus. Piraeus operates about 90% of throughput in Greece. Container volumes at the east Mediterranean port, Piraeus, increased 18.4%
to move a few hundred thousand TEU behind Valencia in 2018.
The big ship issue will remain a characteristic in
2019 for the Asia-Europe trade with yet more ultra
large container ships. The challenge for deep sea
carriers will be to sustain a head-haul transpacific
market to equalize. The liner industry is braced to
receive around 400,000TEU of mega vessel capacity
which is destined for the Asia-Europe trade in 2019,
and a further 600,000TEU in 2020. This growth also
effects the Mediterranean region market.
This study utilizes DEA to analyze the effi- ciency of ports located on the Mediterranean coast through the problem of cost minimization.
The DEA approach suitable for multiple inputs and outputs and it is not necessary to specify specific functions and probability distributions rel- ative to the SFA.
DEA is a linear program that builds a non-parametric frontier calculated from a given data, and the efficiency is estimated by compar- ing the calculated frontier with the actual data.
The DEA does not need to assume a particular function and can address the relationship of mul- tiple inputs and outputs.
DEA approach is widely used in the analysis of the efficiency of industrial infrastructure such as ports because it does not need to assume specific function types and probability dis- tributions, but can analysis multiple inputs and outputs.
To measure efficiency, it is important to the choice of models and the definition of efficiency.
The study uses cost minimization problem such as input-oriented model. DEA Model divides by the input-oriented models and output-oriented model. Input-oriented model is fixed the quantity of output and input can increase proportionally to a certain ratio analysis. Output-oriented model is fixed the quantity of input and output can in- crease proportionally to a certain ratio analysis.
The cost-efficiency of a port can be seen as a matter of proportionately reducing the input un- der a given output or of finding the minimum cost by changing the inputs combination.
Therefore, it can be called an input-oriented
model. Among the DEA models, the CCR model (Charles et al. 1978) and the BCC model (Banker et al. 1984) are the most widely used models. Technical efficiency is the ability to find the minimum amount of input to produce a giv- en output, and distribution efficiency is the abil- ity to determine the optimum input combination under a given component price. Cost efficiency is divided into technical efficiency and allocation efficiency in the CCR model.
The performance of ports tends to be speci- fied exogenously by the benefit of users, so it is important to reduce the budget by proportionally reducing the amount of inputs or adjusting the input combination ratio under a given output.
Although the CCR model is appropriate when all ports are operating at optimal scale, it is likely that the optimal size will not be achieved for ports that are realistically planned to investment.
The BCC model developed to compensate for the disadvantages of the CCR model takes into account the importance of scale by assuming var- iable return to scale. Scale efficiency can be measured as a percentage of the technology effi- ciency of the CCR model to the pure technical efficiency of the BCC model. The cost mini- mization problem of ports can be expressed as follows.
N = = ∈
n
N n
n
X W X X X X V Y
n
1
0 1 ,..., ) ( ) (
: min
In the expression, X = ( X 1 ,..., X N ) represents the input factor, W = ( W 1 ,..., W N ) represents the input factor price, Y
0represents the output and
) ( Y 0
V represents the input combination set. In
the problem of cost minimization, the minimum cost can be expressed as
= =
= N
n
n n
n
w x WX
C
n1
*
*
*
if the optimal solution of the input factor is assumed as * ( * ,..., * )
1
X
NX
X n = . If a particular port pro- duces yield Y 0 using input factor
) ,...,
( 0 0
0
1
X
NX
X n = , the cost is C
0= WX
0. By
definition, c
*is smaller than c
0, X 0 is an element of V ( Y 0 ) set, which is expressed as following equation.
0 0
*
*
WX C WX
C = ≤ = , ) ( ) ,...,
(
0 0 00
1
X V Y
X
X =
N∈
If the cost efficiency is broken down into technical efficiency and allocation efficiency, the following formula is as follows.
( )( )
* 0 0
*
T T
C C C C
C C =
In the expression, C
0is the actual cost of port service, C
*is the optimal cost of port service through cost minimizing, and C T is the cost of being located in the frontier where the technical inefficiency is excluded. Cost efficiency
0
*
C C
is the ratio of the minimum cost to the ac- tual cost of port, and technical efficiency C
TC
*is the ratio of the minimum cost to the cost lo- cated in the production frontier. The following
figure illustrates the process of breaking down the cost efficiency into technical efficiency and allocation efficiency.
For simplicity, two inputs X = ( X 1 , X 2 ) , two factor prices W = ( W 1 , W 2 ) , and one output ( Y ) is assumed to be a cost minimization problem. Because this is the input space with the output fixed in unit 1, revenue uncertainty is assumed for the size. It is assumed to constant return to scale, because of the input space with the output fixed in unit one. The decomposition of cost efficiency for these cost minimization problems is as following equation.
PO RO QO
RO PO TE QO AE
CE = × = × = In the equation, PO
CE = RO is the cost efficiency,
QO
TE = RO is the technical efficiency, and PO AE
=QO is the allocative efficiency.
The result of cost minimization reduces the in- put factor to the constant ratio when iso-quant curve is given, thereby eliminating the in- efficiency of the production factor. It means that the optimal cost can be achieved by changing the allocative of inputs.
The CCR model overlooks scale efficiency and
makes an error in overestimating technology effi-
ciency in situations in which ports are not oper-
ating at optimal scale. This is because the tech-
nology efficiency and scale efficiency cannot be
distinguished. The BCC model was developed in
a way that considered variable return to scale to
compensate for these shortcomings. Scale effi-
ciency is the ratio of the technology efficiency of the CCR model to the (pure) technical efficiency of the BCC model, as following equation.
BCC CCR
TE SE = TE
In the expression, SE is the scale efficiency,
TE CCR is the technical efficiency of the CCR model, and TE BCC is the (pure) technical effi- ciency of the BCC model. Therefore, cost effi- ciency can be measured by dividing into alloca- tive efficiency, technical efficiency and scale efficiency.
The technical efficiency is calculated based on fixed and variable inputs. The total area and berth length are set as fixed inputs, and berth cranes and yard equipment are set as a variable input. Additionally, three cost factor variables (average terminal yard cost, average berth crane cost and average yard equipment cost) are set based on the real prices of ship-shore gantry cranes, and yard equipment such as yard cranes, reachstackers, top lifters, straddle carriers, tractors, forklifts, front-end handlers. The prices are based on worldwide famous e-trade market, named Alibaba (www.alibaba.com). We employed a unique output, annual container throughput, is set. Thus, four inputs, three cost factors and one output are set for estimation the port efficiency in the Mediterranean region.
The first fixed input, total area, is the total area of container yard, excluding of the storage area. As much the container yard is larger is be- lieved the port can handle and operate easily without delaying. The second fixed input is the
berth length, which represents the total length of container berth in the port, excluding berth length of general cargo and ro-ro. The berth length is crucial to the efficiency of the ports to receive the different types of vessels. These vari- ables are used as fixed because once the port is built, these inputs couldn’t be easily changed for the long time-period.
The variable inputs, berth cranes and yard equipment, are easily changed annually. The berth cranes are the number of ship-shore gantry cranes such as Panamax, Post Panamax, Super Panamax models with differentiated carrying ca- pability of 35-65 tons of container. The port service rate significantly depends on the number of quay cranes. The flexibility of the port to work with many vessels depend on the crane availability. The yard equipment is the total num- ber of equipment in container yard area, includ- ing number of yard gantry cranes, straddle car- riers, front-end handlers, top-lifters, reachstackers, forklifts, and yard tractors. As most of the Mediterranean region ports are different due to their cargo handling, they are having differ- entiated number of yard equipment.
We also employed cost factor variables to
evaluate the port efficiency according to the cost
minimization model. As the accessibility of the
real data is limited, we assumed the average cost
value for container area, berth cranes, and yard
equipment based on their current prices in the
e-trade market Alibaba (www.alibaba.com). The
main reason using the cost minimization model
is to check the effect of the price effect in the
efficiency of the port. In technical efficiency
model, we cannot see the actuality comparing
the number of container handling facilities, yard equipment and yard area. For, example, the number of berth cranes absolutely less than number of yard equipment. Here, the effect of yard equipment to the annual throughput seems more important rather than handling facilities.
Hence, modifying the actual prices of market price gives us the real effect of container port facilities to the annual container throughput. In the modification of the numbers from real data to cost value, we multiplied the container yard area with $3,490,000 per m2, the ship-shore cranes with $4,950,000,000 per a unit, as well as yard equipment with $202,125,000 per unit.
Data are mainly collected from 3 different is- sues of the Containerization International Yearbooks(2002, 2006, 2012) and World Top 100 Ports(2018). To analyze the dynamics of the Mediterranean container port market, and to esti- mate the efficiency of the 12 major ports, the panel data from 4 years such as 1999, 2004, 2009 and 2017, are employed.
Ⅲ. Empirical Analysis and Research Findings
This research study aims to analyze the effi- ciency of major ports in the Mediterranean re- gion using three different DEA models. The sup- ply and demand of ports is a decision criterion for port efficiency to the ability to handle the adequate throughput within a given supply size.
The equation of cost minimization for adjusting variable inputs under the given input price is as follows:
= M
m
j j X
m m
n
W X
1
min
J = ≤ =
j
m j m
j X X m
t s
1
) 2 , 1 (
; .
. λ
=
=
J ≤
j j f
j K K f
1 λ 0 ; ( 1 , 2 )
=J ≤j j
j
Y Y
1 0
λ 1
, λ j ≥ 0 ; ( j = 1 ,..., 48 )
where, J is the j th DMU, which a DMU is considered a given port in a given year; X
mis the m variable input, K
fis the f fixed input, Y
1is the output, W m is the price with the m
cost factor, as well as K 0 & Y
0are the quan- tity of given fixed input and output. If the sum of weights λ j equals 1, a constraint is added, which is a BCC model that assumes variable scale returns. The equation becomes as follows:
=
=
≥
J =
j
j
j j
1
) 48 ,..., 1 (
; 0 : 1 λ
λ
On the other hand, when the fixed input ele-
ment takes a long time period to change, so that
the fixed input takes the same characteristics as
the variable input. In order to reduce in-
efficiency, such as variable input, we assumed as
variable input and put into the model on the
same line.
j M
m
j j
X W
mX
mV K
n
1 1
1
min +
=
=
=
J ≤
j
m j m
j X X m
t s
1
) 2 , 1 (
; .
. λ
= J ≤
j j f
j K K
1
λ 0
,
= J ≤
j j j Y Y
1 λ 1 0
) 48 ,..., 1 (
;
0 =
≥ j
λ j .
If the optimal input X
mjof the port is found, the minimum cost of j port becomes
= M
m j m j m
X
1λ
and the ratio of the minimum cost to the actual cost becomes the total cost efficiency.
Through the CCR model and the BCC model, the cost efficiency can be separated into techni- cal efficiency and allocative efficiency, and scale efficiency can be calculated as the ratio of the technical efficiency of the CCR model to the technical efficiency of the BCC model.
Based on the CCR model, the cost-effective average was estimated at 0.4950 (Table -1). In year 2017 was the highest at 0.6531 and 1999 was the lowest at 0.3402. The average technical efficiency was estimated at 0.6438. By year, 2017 was the highest at 0.8547 and 1999 was the lowest at 0.4671.
The yearly trend shows that technical effi- ciency is higher on average than in the past. On the other hand, cost efficiency was highest in 2017, but 2004 was higher than in 2009. Perhaps in 2009, the impact of a decline in trade volume due to the global economic downturn appears to be the impact.
Based on the efficiency score, there were six
technically efficient ports, one in 1999, two in 2004, and three in 2017. In 2009, there were no ports that were considered effective ports due to the recession. The cost-effective port also ap- peared in 2004 as Gioia Tauro Port. The port is believed to have played an important role in the 2017 efficiency average. The results of estimating cost efficiency using the DEA Solver program are summarized in Table 1.
Table 1. Result of Cost Efficiency in CCR Model
Year
Average by years Efficient Ports
TE AE CE Cost
efficient
Technical efficient
1999 0.4671 0.7436 0.3402 0 1
2004 0.6168 0.8176 0.5071 1 2
2009 0.6364 0.7643 0.4795 0 0
2017 0.8547 0.7712 0.6531 0 3
Average 0.6438 0.7742 0.4950 Total 1 Total 6
Note : TE(Technical Efficiency), AE(Allocative Efficiency),CE(Cost Efficiency).
Based on the BCC model, the cost-effective average was estimated at 0.5588. By year, 2017 was the highest at 0.6932 and 1999 was the lowest at 0.4341. The average technical efficiency was estimated at 0.7392. By year, 2017 was the highest at 0.8768 and 1999 was the lowest at 0.6563 as shown in Table 2.
The yearly trend shows that technology effi-
ciency is higher on average than in the past. In
other words, the cost efficiency was a highest
score in 2017. Additionally, the cost efficiency in
2004 was higher than one in 2009. It is assumed
that the impact of a decline in trade volume in 2009 came through the global economic downturn.
In terms of efficiency scores, there are 10 technically efficient ports; two from 1999, four from 2004 and other five from 2017. In 2009, there were no ports that were considered effec- tive ports due to the recession. Cost-effective ports are identified as Gioia Tauro Port and Ambarli Port in same year(2004). These two ports are considered that they played an im- portant role in the 2017 efficiency average score.
Table 2. Result of the Cost Efficiency in BBC Model
Year
Average by years Efficient Ports
TE AE CE Cost
efficient
Technical efficient
1999 0.6563 0.6822 0.4341 0 2
2004 0.7363 0.8295 0.6079 2 4
2009 0.6871 0.7414 0.5001 0 0
2017 0.8768 0.7926 0.6932 2 5
Average 0.7392 0.7614 0.5588 Total 4 Total 11
Note : TE(Technical Efficiency), AE(Allocative Efficiency),CE(Cost Efficiency).
Table 3 shows the results of the efficiency by DEA-CCR for short-term period (by ports). The most cost-effective port in terms of efficiency score was Gioia Tauro, with an average effi- ciency of 0.7670. The lowest cost-effectiveness was Mersin at 0.2889. Gioia Tauro was the most cost-effective port, especially in 2004.
Meanwhile, in technically efficient ports, Gioia Tauro (0.8783) also took the highest position,
followed by Algeciras(0.8523) with a slight difference.
Table 3. Results of the Efficiency by DEA-CCR
Year
Average by port Efficient Ports
TE AE CE Cost
efficient
Technical efficient
Port 1 0.8171 0.7891 0.6247 1
Port 2 0.8523 0.7990 0.6855 1
Port 3 0.5703 0.8762 0.4667 1
Port 4 0.4779 0.7715 0.3631 1
Port 5 0.6951 0.7181 0.4875
Port 6 0.6878 0.7656 0.5497 1
Port 7 0.6301 0.6968 0.4367 Port 8 0.6338 0.8189 0.4969 Port 9 0.4640 0.9156 0.4252
Port 10 0.8783 0.8675 0.7670 1 1 Port 11 0.5933 0.4657 0.2889
Port 12 0.4253 0.8058 0.3474
Port 13 0.6438 0.7742 0.4950 Total 1 Total 6
Note : Port 1(Valencia), Port 2(Algeciras), Port 3(Piraeus),Port 4(Tangier), Port 5(Marsaxlokk), Port 6(Ambarli), Port 7(Barcelona), Port 8(Port Said), Port 9(Genoa), Port 10(Gioia Tauro), Port 11(Mersin), Port 12(Alexandria).
The port with the lowest technical efficiency
was Alexandria at 0.4253. Although the differ-
ence in the absolute values of the efficiency
scores does not directly explain the difference in
efficiency, the difference in the efficiency scores
by about two times indicates that there is a sig-
nificant difference in the efficiency.
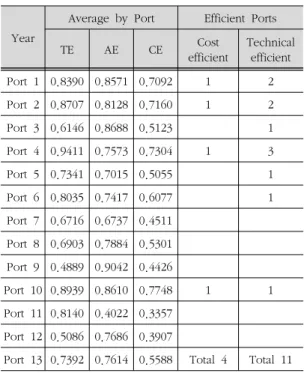
Table 4. Results of Cost Efficiency on BCC model
Year
Average by Port Efficient Ports
TE AE CE Cost
efficient
Technical efficient Port 1 0.8390 0.8571 0.7092 1 2 Port 2 0.8707 0.8128 0.7160 1 2
Port 3 0.6146 0.8688 0.5123 1
Port 4 0.9411 0.7573 0.7304 1 3
Port 5 0.7341 0.7015 0.5055 1
Port 6 0.8035 0.7417 0.6077 1
Port 7 0.6716 0.6737 0.4511 Port 8 0.6903 0.7884 0.5301 Port 9 0.4889 0.9042 0.4426
Port 10 0.8939 0.8610 0.7748 1 1 Port 11 0.8140 0.4022 0.3357
Port 12 0.5086 0.7686 0.3907
Port 13 0.7392 0.7614 0.5588 Total 4 Total 11
Note : Port 1(Valencia), Port 2(Algeciras), Port 3(Piraeus),Port 4(Tangier), Port 5(Marsaxlokk), Port 6(Ambarli), Port 7(Barcelona), Port 8(Port Said), Port 9(Genoa), Port 10(Gioia Tauro), Port 11(Mersin), Port 12(Alexandria).
Results of Cost efficiency on BCC model at short-term (by ports) are shown in Table 4.
The most cost-effective port based on the BCC model was Gioia Tauro, with an average effi- ciency of 0.7748. The lowest cost-effective was Mersin at 0.3357. In terms of technical-efficient ports, Gioia Tauro was also the highest with 0.8939, followed by Algeciras with 0.8707. On the other hand, unlike the CCR model, the port with the lowest technical efficiency appeared as Genoa Port, and the efficiency score was only 0.4889.
Ⅳ. Conclusion and Recommendations
The efficiency of Mediterranean ports through the DEA cost minimization problem has been evaluated. The cost efficiency was measured by using the CCR model and the BCC model, and the main causes of cost inefficiency were ana- lyzed by dividing into technical efficiency, scale efficiency, and allocation efficiency. Unlike the existing research on port efficiency, this study is the first empirical study to estimate the cost effi- ciency of a port through DEA cost minimization and to analyze the specific causes of efficiency by dividing it into technology efficiency, allocate efficiency, and scale efficiency, which is also meaningful.
As a result, in the short-term period scenario,
the cost efficiency of the CCR model was 0.495
in average, the allocation efficiency was 0.774 in
average, and the technical efficiency was 0.644
in average. In the case of the BCC model, the
cost efficiency was 0.559 in average, the alloca-
tion efficiency was 0.761 in average, the pure
technical efficiency was 0.739 in average, and
the scale efficiency was 0.870 in average. By im-
proving the efficiency, the relative ports can save
50.5% of costs in average; however, by reducing
the proportion of input, they can reduce the
35.6% cost in average and adjust the allocation
ratio of input factors to achieve 22.6% of cost
reduction in average. The main reason of port
cost inefficiency comes out from technical in-
efficiency, and the main reason of technical in-
efficiency comes from the pure technical in-
efficiency, as indicated by the average value of
scale efficiency scores.
From the empirical results, the policy im- plications for improving cost inefficiency are sug- gested to be as follows.
First, relatively cost-effective ports among Mediterranean ports should be approached in terms of improving allocation inefficiency and need to be improved by adjusting allocation ratios. On the other hand, relatively cost-effective ports should improve their cost efficiency by eliminating waste of input, considering that the main reason of cost inefficiency is technical inefficiency.
Second, the Mediterranean ports have been used the scale efficiently based on the high scale effi- ciency score compared with other efficiency scores.
Thus, it is more effective to reduce the inefficiency by eliminating the waste of input or adjusting the allocation ratio than using the scale in proper.
Finally, since the main reasons of inefficiency of individual ports may be varied, it is necessary to find the causes and problems of inefficiency of individual ports and find the better solutions to improve the efficiency of the individual ports.
References
Adler, N., and Golany, B.(2001), Evaluation of Deregulated Airline Networks Using Data Envelopment Analysis Combined with Principal Component Analysis with an Application to Western Europe, European Journal of Operational Research, 132 (2), 18–31.
Al-Eraqi, A.S., Mustaffa, A., Khader, A.T., and Barros, C.P.(2008), Efficiency of middle Eastern and East African seaports: application of DEA using Window analysis. European Journal of Scientific Research, 23 (4), 597–612.
Alphaliner(2019). Alphaliner Public Top 10. Statistics.
Retreived on December 7, 2019. See on : https://alphaliner.axsmarine.com/PublicTop100/
Barros, C.P, and Athanassiou, M.(2004), Efficiency in European Seaports with DEA: Evidence from Greece and Portugal. Maritime Economics &
Logistics, 6 (2), 122–140.
Castillo-Manzano, J.I., Mercedes, C.N., Gonzalez Laxe, F., Lopez-Valpuesta, L. and Arevalo-Quijada, M.T.(2009), Low-cost port competitiveness in- dex: Implementation in the Spanish port sys- tem, Marine Policy, 33, 591-598.
Containerisation International(2018), Top 100 container ports 2018. London: Informa.
Containerisation Yearbook, 2002, 2006, and 2012.
Edited by Degerlund, J. London: Informa.
Cullinane, K. and Khanna, M.(1999), ‘Economies of scale in large container ships’, Journal of Transport Economics and Policy, Vol. 33, No.
2, pp.185–207.
Cullinane, K.P.B., and Wang, T.F.(2010), The effi- ciency analysis of container port production using DEA panel data approaches. Operational Research Spectrum, 32, 717-738.
Cullinane, K.P.B., Song, D.-W., and Wang, T.A.(2006),
‘Comparison of mathematical programming ap- proaches to estimating container port pro- duction efficiency’. Journal of Productivity Analysis, (24), 73–92.
Cullinane, K.P.B., Song, D-W., Ji, P., and Wang, T-F(2004), An Application of DEA Windows Analysis to Container Port Production Efficiency, Review of Network Economics, 3 (2), 186–208.
D’Agostini, E. Ryoo, D.K., Jo, S.H.(2015), Comparative Port Performance Analysis of Italian Ports.
Journal of Navigation and Port Research, 39(5), 393-399.
Demirel, B., Cullinane K. & Haralambides H.(2012), Container terminal efficiency and private sector participation.
Ducruet, C. and Notteboom, T.(2012), ‘The worldwide maritime network of container shipping: spatial structure and regional dynamics’, Global Networks, Vol. 12 No. 3, pp. 395–423.
Gouvernal, E., Debrie, J., and Slack, B.(2005),
Dynamics of change in the port system of the Western Mediterranean. Maritime Policy and Management, 32 (2), 107–121.
Musso, A., Piccioni, C., and Van de Voorde, E.(2013), Italian seaports’ competition policies: Facts and figures. Transport Policy. 25, 198-209.
Notteboom, T.E.(2012), Dynamics in port competition in Europe: implications for North Italian ports.
Position paper, Workshop, Milan, Italy.
Rodrigue J. P.(2017), The Geography of Transport Systems. 4th eds. New York: Routledge.
Rodrigue, J-P., Comtois, C., Slack, B.(2013), The geog- raphy of transport systems. 3rd eds. Routledge, New York, USA.
Said, G. A.N. and El-Horbaty, E-S.M.(2015), A simu-
lation modeling approach for optimization of
storage space allocation in container terminal.
지중해 컨테이너항만의 효율성 분석에 관한 연구