1. Introduction
The piled raft minimizes both total and differential settle- ments, improves the bearing capacity of a shallow foundation, and reduces the internal stress levels and bending moments within the raft in an efficient and economical way. This concept of piled raft combines the load-bearing elements of piles, the raft and soil in a composite structure. The behavior of piled raft is determined by complex soil-structure interac- tion effects, and the understanding of these effects is indispensable for the reliable design of such foundations.
Our knowledge of the friction pile behavior in non-cohesive soil has greatly widened during the last decade. Many experimental studies have been performed on the behavior of single piles and free-standing pile groups (Phung, 1993;
Akinmusuru, 1980; Garg, 1979; Liu et al., 1985; Kwon et
al., 2005; Lee, 2003; Shin et al., 2000). However, there have been very few studies on the behavior of the pile raft with raft being in contact with soils. The effects of the contact between the raft and the soil on the bearing capacity and the load-displacement behavior of a piled raft are consider- able, but these effects have not been well documented. The mechanism of load transfer in a piled raft involves a very complex overall interaction between piles, raft and surrounding soils. The load-displacement behavior of the piled raft is affected by many factors such as soil properties, group geometry, pile spacing, pile length and pile installation method etc. Due to the uncertainties or difficulties in determining the effects of such factors, there is no available analysis method capable of including them all (Phung, 1993).
Generally, the current design method of piled raft is based on the assumption that the piles are under free-standing
Load Sharing Ratio of Raft in Piled Raft on Granular Soils by Model Test
모형실험에 의한 조립토 지반에 설치된 말뚝지지 전면기초에서 래프트의 하중분담률
Kwon, Ohkyun† 권 오 균
ABSTRACT :This study was undertaken in order to investigate the load bearing capacity of raft in a piled raft through the laboratory model tests, the numerical and analytical analyses. The model tests were conducted about a piled raft, the free-standing pile group, a single pile, as well as a shallow foundation under equal conditions. The pile spacing and length, group type and soil conditions were varied in the laboratory model tests. The experimental results were compared with those by the commercial program, DEFPIG, conventional methods and Phung’s method. According to this study, the behavior of piled raft was affected by pile spacing, length and soil conditions. Phung’s method proved to be reliable for estimating the experimental results.
Keywords : Piled raft, Load sharing ratio, Raft, Model test, Free-standing pile group
요 지 : 본 연구에서는 말뚝지지 전면기초의 거동특성을 파악하기 위하여 사질토 지반에서 실내 모형실험을 실시하였으며 그 결,
과를 수치해석 및 해석적 방법과 비교 검토하는 연구를 수행하였다 실내 모형실험에서는 동일한 지반조건 말뚝조건 및 하중조건에. ,
서 말뚝지지 전면기초와 비접촉 무리말뚝에 대한 모형실험을 수행하였으며 단말뚝과 래프트에 대해서도 동일한 조건으로 모형실험,
을 실시하였다 그리고 말뚝간격과 길이 말뚝배열 및 지반조건을 변화시켜 래프트의 하중부담률을 조사하였다 모형실험 결과들은. , .
말뚝지지 전면기초의 해석프로그램인DEFPIG,해석적 방법과Phung방법의 결과들과 비교 및 검토하였다 본 연구 결과에 의하면. ,
래프트의 하중분담률은 말뚝간격과 길이 및 지반의 상대밀도에 따라 변화하며, Phung방법의 결과가 모형실험 결과와 가장 유사한
것으로 평가되었다.
주요어 : 말뚝지지 전면기초 하중분담률 래프트 모형실험 비접촉 무리말뚝, , , ,
† Member, Associate Professor, Dept. of Civil Engrg., Keimyung University(E-mail : [email protected]) 한국지반환경공학회 논문집
제 권 제 호8 3 2007년 월6 pp. 67~75
conditions, and all the external load is carried by only those piles, ignoring any contribution of the raft. This method can underestimate the bearing capacity of the piled raft.
This approach is unreasonable, because raft itself is actually in direct contact with the soil, and thus carries some fraction of the external loads. And the bearing capacity of a piled raft is not just the algebraic sum of the bearing capacities of the component group piles and raft (Akinmusuru, 1980;
Prakash and Sharma, 1989; Lee, 2003). In sand, it was found to exceed the sum of those of raft and piles; this was ascribed to the increased load bearing capabilities of both raft and piles caused by mutual interaction (Akinmusuru, 1980).
In this paper, the model tests were conducted about piled raft, free-standing pile groups, single piles, as well as shallow foundation under equal conditions to investigate the factors influencing the behaviors of a piled raft. They were also evaluated with varying pile spacing, pile lengths, group type sand soil conditions. And the behaviors of the piled raft was evaluated by Phung’s method (Phung, 1993), the conventional method and the commercial program DEFPIG, presented by Poulos (1980), which is one of the most commonly used computer programs for analyzing pile groups and piled raft. These experimental results were compared with those done by analytical and numerical analyses.
2. Parameters Effecting on the Behavior of the Piled Footing
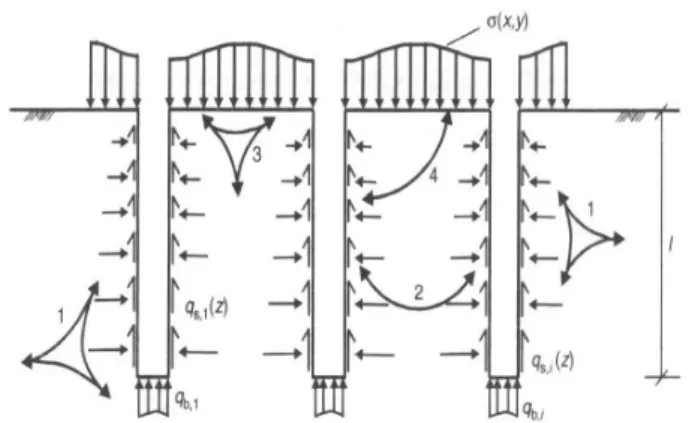
The piled raft is composed of many piles and the raft, so its behavior is affected by many parameters. The load-bearing behaviors of that are characterized by very complex soil- structure interaction between the elements of the foundation and the subsoil. Therefore, there are many difficulties in forecasting the load-bearing behaviors of a piled raft. Fig.
1 shows an illustration of soil-structure interaction of a piled raft, which is composed of 1) soil-pile interaction, 2) pile-pile interaction, 3) soil-raft interaction and 4) pile-raft interaction (Phung, 1993; Katzenbach et al., 2000). Besides, the parametric studies on the behavior of a piled raft were performed by Phung and Liu et al. (Phung, 1993; Liu et al., 1985; Lee, 2003).
3. Model Test Methodology
The large-scale model tests were conducted about piled raft, free-standing pile groups, single piles, as well as shallow foundation under equal conditions in order to investigate the behaviors of a piled raft, especially the load sharing ratio of raft. The soil bin was 2.2 m in length, 2.0 m in width and 2.0 m in height as shown in Fig. 2, which was made by steel plate of 10 mm thickness to prevent defor- mation during the tests. The test pile groups consisted of four piles (2x2 pile group), six piles (2x3 pile group) and nine piles (3x3 pile group). The model piles used in the tests were hollow steel piles with a diameter of 40 mm, and a thickness of 3 mm. The pile lengths were four types:
60 cm, 80 cm, 100 cm and 120 cm. The raft was made by steel plate, and the thickness of the raft was 16 mm so that Fig. 1. Soil-structure interaction effects for a piled raft (Katzenbach
et al., 2000)
Fig. 2. Schematic of model test apparatus
the raft could behave as a rigid foundation. Generally, the contact pressure of the raft, stress and settlement of the pile depends on the relative stiffness of the components (Russo and Viggiani, 1997). In these tests, the thickness of the raft was determined by the following equation (the values of Kr ranging from 10.0 to 0.01 cover very stiff to very flexible rafts) (Hain and Lee, 1978):
4 2
3
) 1 ( 4
r s r r r r
L E B T K E
⋅
⋅
⋅
−
⋅
⋅
⋅
= ⋅ π
ν
(1)
where Kr is the pile-supporting soil relative stiffness, Er is the Young’s modulus of the raft material, Esis the Young’s modulus of the soil mass, Lr, Br, Tr are the length, width and thickness of the raft respectively and v is the Poisson’s ratio of the soil.
Table 1 shows size of the raft used in model tests depending on pile spacing and pile group type (refer to Fig. 3). Pile spacing, pile length, group type and soil conditions were varied in these model tests. Descriptions of model tests are given in Table 2. All of each test was performed twice. Model tests were fundamentally conducted at length of 25D, and the pile length was varied at 15D, 20D and 30D to investigate the pile length effects.
The model tests were performed on the dry sands from
Nakdong-river. The sands were prepared by washing those through a No.10 sieve. The sands were classified as SP (D10= 0.08 mm, Cu= 7.28, Cc= 3.05,ρs= 2.53, d min= 13.52 kN/m3, d min= 16.07 kN/m3). The relative densities of sands used in the model tests were three types: 27%, 47% and 76%.
The test procedure was as follows. First, the soils were compacted by the compaction plate as a layer of 20 cm thickness to adjust the desired relative density. The raft was placed on the sands, and then the piles were driven mechanically by means of a rammer. The weight of the rammer was 245 N and the falling height was 50 cm. The piles were connected to the raft by bolting, so the piled
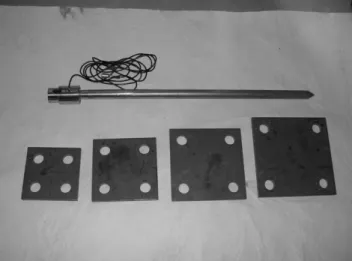
Fig. 3. Model pile and rafts of 2×2 pile group
Table 1. Raft size used in model tests [unit : mm]
s/D
Pile group 3 4 5 6
2 x 2 220 x 220 260 x 260 300 x 300 340 x 340 2 x 3 220 x 340 260 x 420 300 x 500 340 x 580 3 x 3 340 x 340 420 x 420 500 x 500 580 x 580
Fig. 4. Load cells connected to pile head
Table 2. Summary of model tests
Pile group
Relative density
(RD)
Pile length/
diameter (L/D)
Pile spacing/
diameter (s/D)
2 x 2
27% (L) 25 3, 4, 5, 6
47% (M) 25 3, 4, 5, 6
76% (D) 25 3, 4, 5, 6
2 x 3
27% (L) 25 3, 4, 5, 6
47% (M) 25 3, 4, 5, 6
76% (D) 25 3, 4, 5, 6
3 x 3
27% (L)
15 3
20 3
25 3, 4, 5, 6
30 3
47% (M)
15 3
20 3
25 3, 4, 5, 6
30 3
76% (D)
15 3
20 3
25 3, 4, 5, 6
30 3
footing could be controlled in one structure (refer to Fig.
4). Finally, the pile load tests were conducted by the constant strain rate of 0.3 mm/min.
Axial pile loads were measured by means of specially manufactured load cells (capacity of 19.6 kN, refer to Fig.
5) connected at the head and bottom of all pile, and the total load at the piled raft was also measured by means of a load cell (capacity of 196 kN). The settlement of a piled footing was measured by means of four electric resistance transducers with a stroke of 50 mm as shown in Fig. 6.
Data acquisition system consisted of a data-logger TDS602 and a notebook computer.
4. Experimental Results and Discussions
4.1 Load-settlement curve
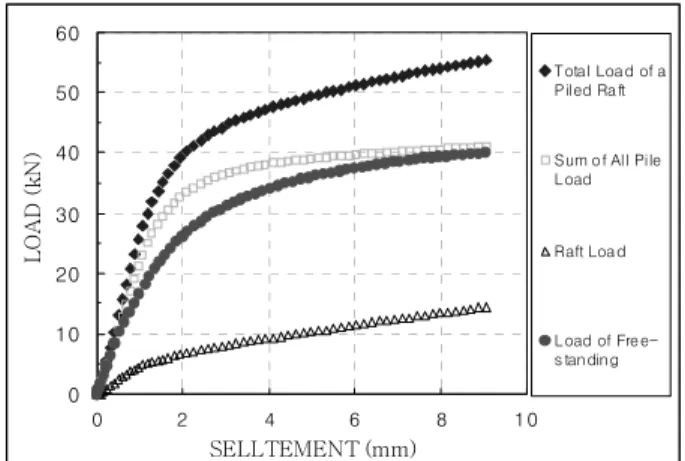
In this study, the model tests were carried out with three types of soil conditions. Fig. 7 shows the load-settlement
curves of the free-standing pile group and the piled raft at the relative density (RD) of 76%, a pile length/diameter (L/D) of 25 and a pile spacing/diameter (s/D) of 3. The bearing capacity of a piled raft is higher than that of a free-standing pile group, and the settlement of a piled raft reduces in comparison with the settlement of a free-standing pile group. The loads taken by the raft and the piles can also be seen in Fig. 7. The share of the applied loads between the raft and the piles varies with the load level.
Up to about 40 kN, the loads are mainly transferred to the piles, and the loads carried by the raft are small, about 10 to 20% of the total load, which are somewhat higher than the average load taken by one pile. Thereafter, with increase of the external load, the loads taken by the raft increase to about 25-30% of the total load. This indicates that at first, the piles take a major portion of the total load, but as the load increases, a considerable portion of the total load is transferred to the raft.
(a) pile head type (b) pile end type
Fig. 5. Detailed figures of manufactured load cells
Fig. 6. Measurement of load and settlement
0 10 20 30 40 50 60
0 2 4 6 8 10
SELLTEMENT (mm)
LOAD (kN)
Total Load of a Piled Raft
Sum of All Pile Load
Raft Load
Load of Fre e- s tanding
Fig. 7. Load-settlement curve of 3×3 pile type (RD=76%, L/D=25, s/D=3)
4.2 Group efficiency
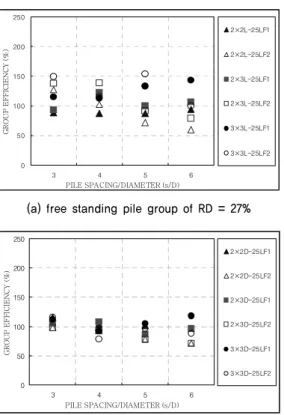
The group efficiency of a piled raft was determined on the basis of yielding load obtained by the pile load test data on a single pile, as illustrated in Figure 8 at a pile length/diameter (L/D) of 25. In this figure, “F” and “P”
symbolize the free-standing pile group and the piled raft conditions respectively. The yielding load is determined by the De Beer’s method using log P-log S curve (Prakash and Shama, 1989). From Fig. 8, the group efficiency at the relative density (RD) of 27% depends on the pile group type and the pile spacing. The group efficiency of the free-standing pile group decreases as the pile spacing increases and the number of piles decreases. The group efficiencies at the relative density of 76% are almost constant at an average of 100%, regardless of pile group type and pile spacing.
But the group efficiency of a piled raft is higher than that of the free-standing pile group in all conditions. The trend of group efficiency variation of the piled raft is similar to that of the free-standing pile group. The group efficiencies at RD of 76% are almost constant at an average of 120%.
And most of the group efficiencies decrease as the density of soil increases. Because the group efficiency of a piled raft is almost constant when the relative density is over
50% and the pile spacing/diameter is over 5, it is concluded that the raft rarely has an influence on the group efficiency.
Therefore the raft has a considerable influence on the group efficiency in loose sand, but not in dense sand.
4.3 Load sharing ratio of raft
The load sharing ratio (LSR) is the ratio of the load taken by the raft to the total load applied on a piled raft.
The total load acting on the piled raft is measured by the load cell (capacity of 196 kN) on the plate, and the load by raft is obtained to subtract the sum of each pile load from the total load of the piled raft. The pile load is measured by the upper load cell (capacity of 19.6 kN) (refer to Fig. 2). Fig. 9 shows the relations among the LSR, the pile group type and the pile spacing at a pile length/diameter of 25. The denser the sand, the higher the LSR at an s/D of 3 and the lower the LSR at an s/D of 6, but the differences are not large. This is evidently due to the effects of the raft-soil contact pressure and the pile-soil interaction. The LSR at an s/D of 3 and RD of 27% is relatively small, due to the increase of the load taken by piles and of group efficiency, compared with that of an s/D of 6. Therefore, the influence of the pile spacing on the
0 50 100 150 200 250
3 4 5 6
PILE SPACING/DIAMETER (s/D)
GROUP EFFICIENCY (%)
2×2L-25LF1 2×2L-25LF2
2×3L-25LF1 2×3L-25LF2
3×3L-25LF1
3×3L-25LF2
0 50 100 150 200 250
3 4 5 6
PILE SPACING/DIAMETER (s/D)
GROUP EFFICIENCY (%)
2×2L-25LP1 2×2L-25LP2
2×3L-25LP1
2×3L-25LP2 3×3L-25LP1
3×3L-25LP2
(a) free standing pile group of RD = 27% (b) piled raft of RD = 27%
0 50 100 150 200 250
3 4 5 6
PILE SPACING/DIAMETER (s/D)
GROUP EFFICIENCY (%)
2×2D-25LF1
2×2D-25LF2 2×3D-25LF1 2×3D-25LF2
3×3D-25LF1
3×3D-25LF2
0 50 100 150 200 250
3 4 5 6
PILE SPACING/DIAMETER (s/D)
GROUP EFFICIENCY (%)
2×2D-25LP1 2×2D-25LP2
2×3D-25LP1 2×3D-25LP2 3×3D-25LP1 3×3D-25LP2
(c) free standing pile group of RD = 76% (d) piled raft of RD = 76%
Fig. 8. Group efficiency along with pile spacing
LSR is larger in loose soil than in dense soil.
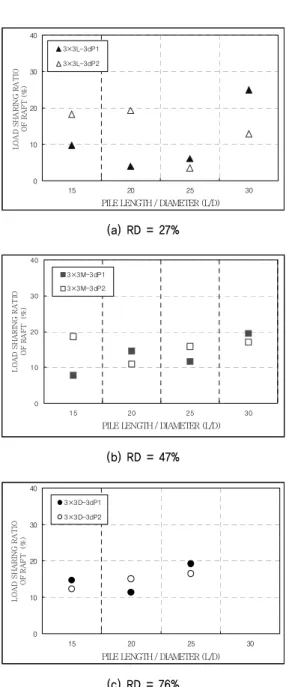
Fig. 10 shows the relations between the LSR and the pile length at a 3 x 3 pile group and a s/D of 3. Except for some data on RD of 27% (presumed to be an experimental error), the values of the LSR at a L/D of 15, 20, 25 and 30 are 9-19%, 10-20%, 11-20% and 12-25% respectively.
The LSR increases slightly as the pile length is longer.
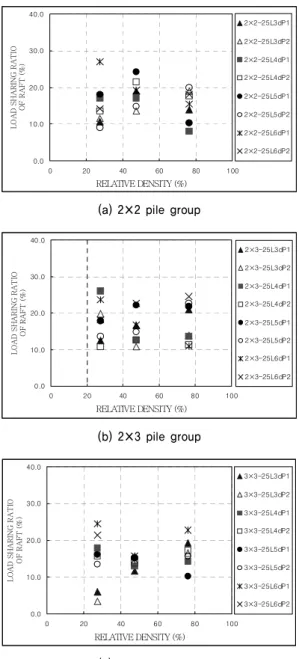
Fig. 11 shows the relations among the LSR, the pile spacing and the relative density at a pile length/diameter of 25. Although there are some deviations, the wider the pile spacing and the lower the relative density of soil, the higher the LSR, but the differences are not so much. Therefore, one must conclude that the LSR depends on the pile
spacing and the soil density under the same pile length.
Fig. 12 shows the relations among the LSR, the pile spacing and the settlement level at 2 x 2 pile group and L/D of 25. Under all experimental conditions, the LSR increases as the settlement of the piled raft increases. The wider the pile spacing, the higher the LSR, and the value of the LSR is up 30% more at a s/D of 6 and a settlement of 0.1D (4 mm), irrespective of the relative density of sands. At a relatively small settlement, the value of the LSR is higher as the density of sand is denser, and the increase rate of the LSR in RD of 76% is not greater than those in RD of 27% and 47%.
0 10 20 30 40 50
3 4 5 6
PILE SPACING / DIAMETER (s/D)
LOAD SHARING RATIO OF RAFT (%) 2×2L-25LP1
2×2L-25LP2
2×3L-25LP1
2×3L-25LP2
3×3L-25LP1
3×3L-25LP2
0 10 20 30 40
15 20 25 30
PILE LENGTH / DIAMETER (L/D) LOAD SHARING RATIO OF RAFT (%)
3×3L-3dP1 3×3L-3dP2
(a) RD = 27% (a) RD = 27%
0 10 20 30 40 50
3 4 5 6
PILE SPACING / DIAMETER (s/D)
LOAD SHARING RATIO OF RAFT (%) 2×2M-25LP1
2×2M-25LP2
2×3M-25LP1
2×3M-25LP2
3×3M-25LP1
3×3M-25LP2 0
10 20 30 40
15 20 25 30
PILE LENGTH / DIAMETER (L/D) LOAD SHARING RATIO OF RAFT (%)
3×3M-3dP1 3×3M-3dP2
(b) RD = 47% (b) RD = 47%
0 10 20 30 40 50
3 4 5 6
PILE SPACING / DIAMETER (s/ D)
LOAD SHARING RATIO OF RAFT (%) 2×2D-25LP1
2×2D-25LP2
2×3D-25LP1
2×3D-25LP2
3×3D-25LP1
3×3D-25LP2
0 10 20 30 40
15 20 25 30
PILE LENGTH / DIAMETER (L/D) LOAD SHARING RATIO OF RAFT (%)
3×3D-3dP1 3×3D-3dP2
(c) RD = 76% (c) RD = 76%
Fig. 9. Load sharing ratio of raft along with pile spacing Fig. 10. Load sharing ratio of raft along with pile length
5. Analysis Results and Discussions
In this study, the load sharing ratios at various conditions were also determined by a numerical analysis program DEFPIG (Poulos, 1990), which is one of the most common computer programs used for analyzing the pile groups and piled raft, in order to compare these with the results of the model test. The input data are needed the area and condition of pile cap, no. of piles, pile length, diameter, stiffness, no.
of pile elements, soil conditions and characteristics, etc.
The load-settlement curves obtained by DEFPIG and the model test with a 3 x 3 pile group and an L/D of 25 are
shown in Fig. 13. The results obtained from DEFPIG agree well with the experimental results under all test conditions.
Therefore, one must conclude that there is no problem in predicting the behaviors of a piled raft with DEFPIG.
5.1 Comparison of the load sharing ratio of the raft along with the pile spacing
Fig. 14 shows the results by model tests, DEFPIG, con- ventional analytical method and Phung’s method with a 3 x 3 pile group and an L/D of 25. As the s/D varies from 3 to 6, the values of LSR by DEFPIG increase from 15-19%
to 28-30% depending on the soil density, and the LSR by
0.0 10.0 20.0 30.0 40.0
0 20 40 60 80 100
RELATIVE DENSITY (%) LOAD SHARING RATIO OF RAFT (%)
2×2-25L3dP1
2×2-25L3dP2
2×2-25L4dP1
2×2-25L4dP2
2×2-25L5dP1
2×2-25L5dP2
2×2-25L6dP1
2×2-25L6dP2
0 5 10 15 20 25 30 35 40
3 4 5 6
PILE SPACING / DIAMETER (s/D) LOAD SHARING RATIO OF RAFT (%)
SETTL. = 0.0125D
SETTL. = 0.025D
SETTL. = 0.0375D
SETTL. = 0.05D
SETTL. = 0.075D
SETTL. = 0.1D
(a) 2×2 pile group (a) RD = 27%
0.0 10.0 20.0 30.0 40.0
0 20 40 60 80 100
RELATIVE DENSITY (%) LOAD SHARING RATIO OF RAFT (%)
2×3-25L3dP1
2×3-25L3dP2
2×3-25L4dP1
2×3-25L4dP2
2×3-25L5dP1
2×3-25L5dP2
2×3-25L6dP1
2×3-25L6dP2
0 5 10 15 20 25 30 35 40
3 4 5 6
PILE SPACING / DIAMETER (s/D) LOAD SHARING RATIO OF RAFT (%)
SETTL. = 0.0125D
SETTL. = 0.025D
SETTL. = 0.0375D
SETTL. = 0.05D
SETTL. = 0.075D
SETTL. = 0.1D
(b) 2×3 pile group (b) RD = 47%
0.0 10.0 20.0 30.0 40.0
0 20 40 60 80 100
RELATIVE DENSITY (%) LOAD SHARING RATIO OF RAFT (%)
3×3-25L3dP1
3×3-25L3dP2
3×3-25L4dP1
3×3-25L4dP2
3×3-25L5dP1
3×3-25L5dP2
3×3-25L6dP1
3×3-25L6dP2
0 5 10 15 20 25 30 35 40
3 4 5 6
PILE SPACING / DIAMETER (s/D) LOAD SHARING RATIO OF RAFT (%)
SETTL. = 0.0125D
SETTL. = 0.025D
SETTL. = 0.0375D
SETTL. = 0.05D
SETTL. = 0.075D
SETTL. = 0.1D
(c) 3×3 pile group (c) RD = 76%
Fig. 11. Load sharing ratio of raft along with relative density of soil
Fig. 12. Load sharing ratio of raft with settlement and pile spacing
the conventional analytical method slightly from 8-9% to 13-15%. Generally DEFPIG overestimates the experimental
results, but the conventional method underestimates such results. The values of the LSR obtained from the method using bearing coefficients, proposed by Phung (1993), agree well with the experimental results.
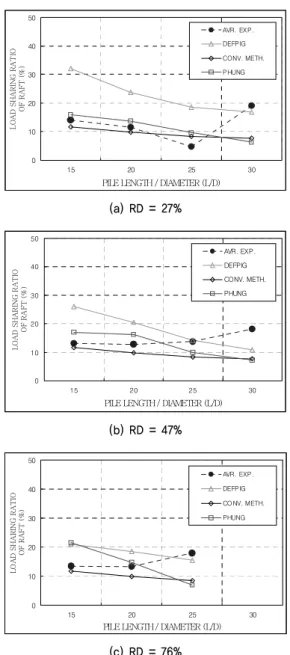
5.2 Comparison of the load sharing ratio of the raft along with the pile length
Fig. 15 shows the results by model tests, DEFPIG, conventional analytical method and Phung’s method with a 3 x 3 pile group and an s/D of 3. As the L/D varies from 15 to 30, the values of the LSR by DEFPIG decrease from 21-32% to 11-17% depending on the soil density, and the LSR by the conventional analytical method slightly from about 12% to 8%. Generally DEFPIG overestimates the experimental results, but the conventional method underesti- mates such values. The values of the LSR by Phung’s method agree well with the experimental results.
6. Conclusions and Comments
This study was undertaken in order to investigate the behavior characteristics of a piled raft through model tests, numerical and analytical analyses. The model tests were conducted about the piled raft, the free-standing pile group, the single pile, as well as shallow foundation under equal conditions, with varying the pile spacing, pile length, group type and soil density. The experimental results were compared with those by DEFPIG, Phung’s method and the conventional analytical method. From the results of this study, the following conclusions can be drawn:
0 20 40 60 80 100
0 1 2 3 4
SETTLEMENT (mm)
LOAD (kN)
EX P.(1) EX P.(2) DEFPIG
0 20 40 60 80 100 120
0 1 2 3 4
SETTLEMENT (mm)
LOAD (kN)
EXP.(1) EXP.(2) DEFPIG
(a) RD = 47% (b) RD = 76%
Fig. 13. Comparison of load-settlement curves by model test and DEFPIG
0 10 20 30 40 50
3 4 5 6
PILE SPACING / DIAMETER (s/D) LOAD SHARING RATIO OF RAFT (%)
AVR. EXP.
DEFPIG CONV. METH.
PHUNG
(a) RD = 27%
0 10 20 30 40 50
3 4 5 6
PILE SPACING / DIAMETER (s/D) LOAD SHARING RATIO OF RAFT (%)
AVR. EXP.
DEFPIG CONV. METH.
PHUNG
(b) RD = 47%
0 10 20 30 40 50
3 4 5 6
PILE SPACING / DIAMETER (s/D) LOAD SHARING RATIO OF RAFT (%)
AVR. EXP.
DEFPIG CONV. METH.
PHUNG
(c) RD = 76%
Fig. 14. Comparison of load sharing ratio along with pile spacing by model tests and analytical methods
(1) The piles take a major portion of total load at the initial stage of loading, but after yielding, a considerable portion of total load (up to 30% more) is transferred by the raft.
(2) The group efficiency of a piled raft is higher than that of a free-standing pile group under all conditions, and it increases as the pile spacing becomes smaller, as the number of piles increases and the density of soil becomes looser. The raft has a considerable influence on the group efficiency in loose sand, but not in dense sand.
(3) The load sharing ratio of raft depends on the pile spacing, pile length, relative density of sand, and settlement level. As the pile spacing gets wider and the pile length becomes longer and relative density becomes lower, the LSR becomes higher, but the differences are not large.
(4) Generally, the DEFPIG program overestimates the model test results, but the conventional method underestimates.
The LSR by Phung’s method agrees well with the model test results.
(5) Because these results were based on only model tests and analyses, in order to use in practical designs, the comparison and examination between these results and the measured data in field should initially be carried out.
Acknowledgment
This research has been funded by SISTeC and MOCT (R&D No. 200001010025) and the author greatly appreciate their financial support.
References
1. Akinmusuru, J. O.(1980), Interaction of Piles and Cap in Piled Footings, ASCE, Vol. 106, No. GT 11, pp. 1263 1268.~ 2. Garg, K. G.(1979), Bored Pile Groups under Vertical Load in
Sand, ASCE, Vol. 105, No. GT8, pp. 939 956.~
3. Hain, S. J. and LEE, I. K.(1978), The Analysis of Flexible Raft-piles Systems, Geotechnique, Vol. 28, No. 1, pp. 65 83.~ 4. Katzenbach, R., Arslan, U. and Moormann, C.(2000), Piled Raft Foundation Project in Germany. Design applications of raft foundations (Ed. J.A. Hemsley), London, Thomas Telford, Inc., pp. 323 391.~
5. Kwon, O.K., Oh, S.B. and Kim, J.B.(2005), Experimental Study on the Load Sharing Ratio of Group Pile, J. of the Korean Geotechnical Society, Vol. 21, No. 5, pp. 51 58.~
6. Lee, W.(2003), A Study on Load Bearing Ratio of Raft in Piled Raft on Granular Soil, PdD. Dissertation, Keimyung University, p. 207.
7. Liu, J. L., Yuan, Z. L. and Zhang, K. P.(1985), Cap-pile-soil Interaction of Bored Pile Groups, 11th ICSMFE, San Francisco, Vol. 3, pp. 20 27.~
8. Phung, D. L.(1993), Footings with Settlement-reducing Piles in Non-cohesive Soil, Ph.D. thesis, School of Civil Engrg, Chalmers University of Technology, Sweden, pp.118 131.~ 9. Prakash, S. and Sharma, H. D.(1989), Pile Foundations in
Engineering Practice, John Wiley & Sons, Inc., New York, pp. 218 321, pp. 646 652.~ ~
10. Poulos, H. G.(1990), Users Guide to Program DEFPIG - Deformation Analysis of Pile Groups, University of Sydney, School of Civil Engineering, N.S.W., p. 55.
11. Russo, G., and Viggiani, C.(1997), Some aspects of numerical analysis of piled rafts, 14th ICSMFE, 2(6), Hamburg, pp.
1125 1128.~
12. Shin, B.W., Chae, H.S. and Kim, H.T.(2000), A Study on the Prediction of Settlement for Granular Piled Raft System, J. of the Korean Geoenvironmental Society, Vol. 1, No. 1, pp. 51 56.~
접수일 심사일 심사완료일
( : 2007. 4. 19 : 2007. 4. 20 : 2007. 5. 17)
0 10 20 30 40 50
15 20 25 30
PILE LENGTH / DIAMETER (L/D) LOAD SHARING RATIO OF RAFT (%)
AVR. EXP.
DEFPIG CONV. METH.
PHUNG
(a) RD = 27%
0 10 20 30 40 50
15 20 25 30
PILE LENGTH / DIAMETER (L/D) LOAD SHARING RATIO OF RAFT (%)
AVR. EXP.
DEFPIG CONV. METH.
PHUNG
(b) RD = 47%
0 10 20 30 40 50
15 20 25 30
PILE LENGTH / DIAMETER (L/D) LOAD SHARING RATIO OF RAFT (%)
AVR. EXP.
DEFPIG CO NV. METH.
PHUNG
(c) RD = 76%
Fig. 15. Comparison of load sharing ratio along with pile length by model tests and analytical methods