46
© 2017 American Heart Association, Inc.
Stroke is available at http://stroke.ahajournals.org DOI: 10.1161/STROKEAHA.117.019582
Received September 29, 2017; final revision received September 29, 2017; accepted October 18, 2017.
From the Department of Neurology, Seoul National University Bundang Hospital, Seongnam, Korea (K.-J.L., B.J.K., M.-K.H., H.-J.B.); Department of Neurology, Chonnam National University Hospital, Gwangju, Korea (J.-T.K., K.-H.C.); Department of Neurology, Chungbuk National University Hospital, Cheongju, Korea (D.-I.S., M.-J.Y.); Department of Neurology, Dong-A University Hospital, Busan, Korea (J.-K.C., D.-H.K., H.-W.N.); Department of Neurology, Dongguk University Ilsan Hospital, Goyang, Korea (D.-E.K., W.-S.R.); Department of Neurology, Eulji General Hospital, Eulji University, Seoul, Korea (J.-M.P., K.K.); Department of Neurology, Eulji University Hospital, Daejeon, Korea (S.J.L.); Department of Neurology, Hallym University Sacred Heart Hospital, Anyang, Korea (M.-S.O., K.-H.Y., B.-C.L.); Department of Neurology, Inje University Ilsan Paik Hospital, Goyang, Korea (K.- S.H., Y.-J.C.); Department of Neurology, Jeju National University Hospital, Korea (J.C.C.); Department of Neurology, Keimyung University Dongsan Medical Center, Daegu, Korea (S.I.S., J.-H.H.); Department of Neurology, Seoul Medical Center, Korea (T.H.P., S.-S.P.); Department of Neurology, Ulsan University Hospital, Korea (J.-H.K., W.-J.K.); Department of Neurology, Yeungnam University Medical Center, Daegu, Korea (J.L.); Clinical Research Center, Asan Medical Center, Seoul, Korea (J.S.L.); Department of Biostatistics, Korea University, Seoul (J.L.); and Department of Translational Science and Molecular Medicine, Michigan State University College of Human Medicine and Mercy Health Hauenstein Neurosciences, Grand Rapids (P.B.G.).
Guest Editor for this article was Georgios Tsivgoulis, MD.
The online-only Data Supplement is available with this article at http://stroke.ahajournals.org/lookup/suppl/doi:10.1161/STROKEAHA.
117.019582/-/DC1.
Correspondence to Hee-Joon Bae, MD, PhD, Department of Neurology, Seoul National University College of Medicine, Cerebrovascular Disease Center, Seoul National University Bundang Hospital, 82, Gumi-Ro 173 Beon-Gil, Bundang-Gu, Seongnam-Si, Gyeonggi-Do 13620, Korea. E-mail braindoc@
snu.ac.kr
Background and Purpose—This study aimed to investigate whether pulse pressure (PP) obtained during the acute stage of ischemic stroke can be used as a predictor for future major vascular events.
Methods—Using a multicenter prospective stroke registry database, patients who were hospitalized for ischemic stroke within 48 hours of onset were enrolled in this study. We analyzed blood pressure (BP) data measured during the first 3 days from onset. Primary and secondary outcomes were time to a composite of stroke recurrence, myocardial infarction, all-cause death, and time to stroke recurrence, respectively.
Results—Of 9840 patients, 4.3% experienced stroke recurrence, 0.2% myocardial infarction, and 7.3% death during a 1-year follow-up period. In Cox proportional hazards models including both linear and quadratic terms of PP, PP had a nonlinear J-shaped relationship with primary (for a quadratic term of PP, P=0.004) and secondary (P<0.001) outcomes.
The overall effects of PP and other BP parameters on primary and secondary outcomes were also significant (P<0.05).
When predictive power of BP parameters was compared using a statistic of −2 log-likelihood differences, PP was a stronger predictor than systolic BP (8.49 versus 5.91; 6.32 versus 4.56), diastolic BP (11.42 versus 11.05; 10.07 versus 4.56), and mean atrial pressure (8.75 versus 5.91; 7.03 versus 4.56) for the primary and secondary outcomes, respectively.
Conclusions—Our study shows that PP when measured in the acute period of ischemic stroke has nonlinear J-shaped relationships with major vascular events and stroke recurrence, and may have a stronger predictive power than other commonly used BP parameters. (Stroke. 2018;49:46-53. DOI: 10.1161/STROKEAHA.117.019582.)
Key Words: assessment, patient outcome ◼ blood pressure ◼ cohort studies ◼ pulse pressure ◼ stroke
for Future Major Vascular Events
Keon-Joo Lee, MD; Beom Joon Kim, MD, PhD; Moon-Ku Han, MD, PhD;
Joon-Tae Kim, MD, PhD; Ki-Hyun Cho, MD, PhD; Dong-Ick Shin, MD, PhD; Min-Ju Yeo, MD;
Jae-Kwan Cha, MD, PhD; Dae-Hyun Kim, MD, PhD; Hyun-Wook Nah, MD, PhD;
Dong-Eog Kim, MD, PhD; Wi-Sun Ryu, MD, PhD; Jong-Moo Park, MD, PhD;
Kyusik Kang, MD, PhD; Soo Joo Lee, MD, PhD; Mi-Sun Oh, MD, PhD;
Kyung-Ho Yu, MD, PhD; Byung-Chul Lee, MD, PhD; Keun-Sik Hong, MD, PhD;
Yong-Jin Cho, MD, PhD; Jay Chol Choi, MD, PhD; Sung Il Sohn, MD, PhD;
Jeong-Ho Hong, MD, PhD; Tai Hwan Park, MD, PhD; Sang-Soon Park, MD;
Jee-Hyun Kwon, MD, PhD; Wook-Joo Kim, MD; Jun Lee, MD, PhD; Ji Sung Lee, PhD;
Juneyoung Lee, PhD; Philip B. Gorelick, MD, MPH; Hee-Joon Bae, MD, PhD;
on behalf of the CRCS-5 Investigators
B
rachial pulse pressure (PP) is a known indicator of arterial stiffness,1,2 and high PP increases the risk of cardiovascu- lar diseases.3–5 Several possible mechanisms are proposed forhow high PP influences incidence of acute coronary events.
These include potentiation of atherosclerosis and myocardial remodeling, and reduction of coronary perfusion.6
Downloaded from http://ahajournals.org by on January 29, 2019
High PP is known to increase the risk of stroke in general population,7–9 but the effect of PP in stroke survivors has not been studied well. A few studies reported that high PP may increase the risk of stroke recurrence and mortality and worsen functional outcome.10–13 However, each of these stud- ies had limitations of small sample size,10,11 short follow-up duration (from 10 days12 to 3 months13), or no adjustments for other well-known blood pressure (BP) parameters when evaluating the effect of PP.10–13
Using a multicenter prospective stroke registry database,14,15 this study aimed to (1) elucidate the relationship between PP and major vascular events, a composite of stroke recurrence, myocardial infarction, and all-cause death in acute ischemic stroke patients and (2) compare the predictive value of PP on major vascular events to other commonly used BP parameters such as systolic BP (SBP), diastolic BP (DBP), and mean arte- rial pressure (MAP).
Methods Study Subjects
The data that support the findings of this study are available from the corresponding author on reasonable request. Acute ischemic stroke patients, who were admitted to 14 South Korean university hospitals or regional stroke centers, participating in the fifth divi- sion of the Clinical Research Center for Stroke (CRCS-5) project,14,15 from January 2011 to November 2014, were consecutively enrolled according to the following criteria: (1) an acute ischemic stroke hos- pitalized in stroke unit, general ward, or intensive care unit within 48 hours of symptom onset, (2) relevant acute ischemic lesions on the diagnostic brain image, and (3) availability of collecting BP data from the electronic medical record system of each hospital. Patients whose duration of hospitalization was <24 hours, whose BP was measured <5×, or whose outcome was not available because of early discharge and loss to follow-up were excluded (Figure I in the online- only Data Supplement).
Data Collection
Information on demographics, stroke characteristics including initial stroke severity according to the National Institutes of Health Stroke Scale (NIHSS) scores and stroke subtypes classified according to the TOAST (Trial of ORG 10172 in Acute Stroke Treatment) with some modifications following a magnetic resonance imaging–based algorithm,16 risk factors (hypertension, diabetes mellitus, hyperlip- idemia, smoking, and atrial fibrillation) and treatments (hyperacute reperfusion therapy, antithrombotics, antihypertensive agents, and statin usage at discharge), and symptomatic steno-occlusion (SYSO) which was defined as occlusion or stenosis of ≥50% of the lumen diameter of the intra or extracranial cerebral artery relevant to the ischemic lesion detected by computed tomography, magnetic reso- nance, or conventional angiography were collected prospectively dur- ing hospitalization.
BP data, which were acquired during hospitalization and recorded into the electronic medical record system through routine prac- tice in each participating hospital, were collected.17–19 It was rec- ommended to measure casual supine BP using a standard mercury sphygmomanometer or a noninvasive BP monitoring device on the nonparalytic arm. Every BP measured in a regular basis after the institutional protocols for acute stroke management and collected into the electronic medical record system within 72 hours of onset was used for this analysis. PP was calculated by a simple subtraction of SBP and DBP in each measurement and mean value of PPs was obtained in each individual.
The collection of clinical information for the CRCS-5 registry was approved by the local institutional review boards in all participating centers with a waiver of patient consent because of anonymity and
minimal risk to participants. We obtained further approval for the use of the registry database for this study.
Outcomes
For the purpose of monitoring the quality of stroke care and out- comes, occurrences of vascular events, including death, were pro- spectively captured at discharge, 3 months and 1 year after stroke Table 1. Baseline Demographic and Clinical Characteristics of Study Subjects
Variable Summary Values
Age 68.04±12.92
<60 2451 (24.9) 60–69 2212 (22.5) 70–79 3370 (34.2) ≥80 1807 (18.4)
Male 5754 (58.5)
BMI 23.52±3.32
<18.50 530 (5.4) 18.50–24.99 6468 (65.7) 25.00–29.99 2506 (25.5) ≥30.00 336 (3.4)
Hypertension 6715 (68.2)
Diabetes mellitus 3070 (31.2)
Hyperlipidemia 2876 (29.2)
Smoking 4014 (40.8)
Atrial fibrillation 2370 (24.1)
Coronary heart disease 981 (10.0)
Stroke or TIA 2174 (22.1)
Reperfusion therapy 2145 (21.8)
Discharge medications
Antiplatelet 7557 (76.8) Anticoagulation 2186 (22.2) Statin 8144 (82.8) Antihypertension 4534 (46.1) TOAST classification
LAD 3378 (34.3) SVO 1674 (17.0) CE 2520 (25.6) OD 242 (2.5) UD 2026 (20.6)
Initial NIHSS score 4 (2–10)
<6 5907 (60.0) 6–10 1635 (16.6) ≥11 2298 (23.4) BMI indicates body mass index; CE, cardioembolism; LAD, large artery disease; NIHSS, National Institutes of Health Stroke Scale; OD, other determined;
SVO, small vessel occlusion; TIA, transient ischemic attack; TOAST, Trial of ORG 10172 in Acute Stroke Treatment; and UD, undetermined.
Downloaded from http://ahajournals.org by on January 29, 2019
through review of medical records or direct or telephone interviews by dedicated stroke coordinators at each center. The definition of each outcome parameter was predetermined and stroke coordinators at each center were educated before collecting outcomes. The devia- tions of the collected data were regularly monitored by the central data manager biweekly and notified to each center. Also, the integ- rity and completeness of the database were checked through monthly meetings of the registry steering committee.
A primary outcome measure was a composite of stroke recurrence, myocardial infarction, or all-cause death, and a secondary outcome measure was stroke recurrence. Details of definitions of individual outcome parameters, organization, and data management of the CRCS-5 registry are described elsewhere.14,15
Statistical Analysis
Descriptive analyses were summarized as mean±SD or medians (interquartile range) for continuous variables or numbers of patients with percentages for categorical variables. Correlations between PP and other BP parameters were examined using Pearson correlation analysis. Cumulative incidence of outcome events at 3 months and 1 year were estimated using the Kaplan–Meier product limit methods and compared according to baseline characteristics using the log-rank test.
Cox proportional hazards models were used to estimate adjusted hazards ratios (HRs) of PP for the risk of primary and secondary out- comes. PP was regarded as a continuous variable in the models, but its HRs were estimated with 5 mm Hg intervals to delineate the rela- tionships between PP and outcomes. We assumed nonlinear effects of PP, so that both linear and quadratic terms of PP were included in the model. In both models, the nonlinear effects were statistically signifi- cant (P<0.05). Adjustments were made for predetermined covariates;
age, sex, body mass index, hypertension, diabetes mellitus, hyperlip- idemia, coronary heart disease, stroke or transient ischemic attack, smoking, reperfusion therapy, statin use at discharge, initial NIHSS, and TOAST classification.
To compare the predictive power of PP to other BP parameters, similar models were constructed for PP and other BP parameters, including both linear and quadratic terms in the model if significant.
To evaluate the predictive power of individual BP parameters, a −2 log-likelihood (LL) difference was used, which assessed an incre- ment of variance when each BP parameter (a linear term only) or pair of parameters (both linear and quadratic terms) were added to the core hazards models. Therefore, a relative strength of PP compared with other BP parameters could be compared using the −2 LL values.
For example, to compare the predictive power of PP to SBP, 3 mod- els were constructed (1) model 1 included linear and quadratic terms of PP, a linear term of SBP, whereas other predetermined covariates were adjusted; (2) model 2 was constructed by excluding PP from model 1, and (3) model 3 was constructed by excluding SBP from model 1. After that, a −2 LL difference for SBP was then estimated by subtracting the −2 LL value of model 2 from that of model 1.
Similarly, a −2 LL difference for PP was obtained by subtracting the
−2 LL value of model 3 from that of model 1. Finally, a comparison of the predictive power between PP and SBP was made using these
−2 LL differences, indicating the larger difference the better predic- tive power.
Additional post hoc analyses were performed to examine a robust- ness of the study results by applying a frailty model to reflect inter- hospital heterogeneity and by replacing stroke subtypes with SYSO.
All analyses were performed using the R project (http://www.r- project.org), SAS software version 9.4 (SAS institute, Cary, NC), and SPSS for Windows version 20.0 (IBM Corporation, Armonk, NY), and a 2-sided P<0.05 was considered as statistically significant.
Results
Nine thousand eight hundred and forty patients were eligible for study inclusion (Figure I in the online-only Data Supplement).
Demographics and clinical characteristics of the study subjects are shown in Table 1. The majority of the subjects were predom- inantly elderly (mean age, 68.0 years) and were men (58.5%).
About 70% of the subjects were diagnosed at discharge as hav- ing hypertension. Fifty-four percent were on antihypertensive medication before the index stroke. The median NIHSS score was 4, and 21.8% received hyperacute reperfusion therapy.
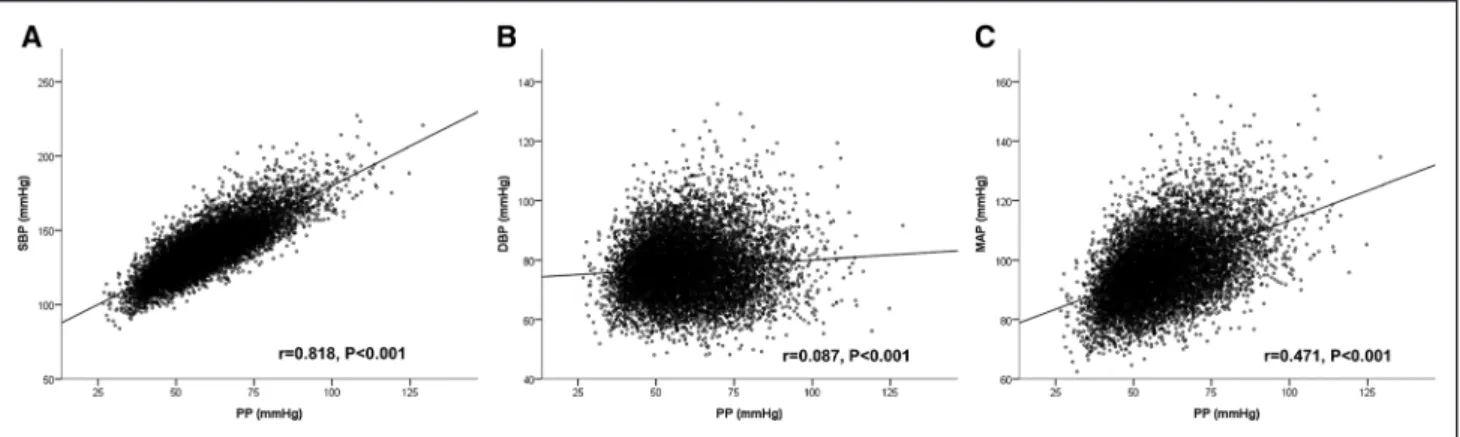
Mean values of the BP parameters were 59.49±13.41 mm Hg for PP, 136.87±17.45 mm Hg for SBP, 77.38±10.06 mm Hg for DBP, and 97.21±11.36 mm Hg for MAP. Distributions of BP parameters are presented in Figure II in the online-only Data Supplement. PP showed a high correlation with SBP (r=0.82; P<0.001), whereas weaker correlations with DBP (r=0.09; P<0.001) and MAP (r=0.47; P<0.001) were observed (Figure 1).
Median follow-up duration was 361 (interquartile range, 107–386) days, and 418 patients (4.25%) experienced stroke recurrence, 19 (0.19%) myocardial infarction, and 714 (7.26%) death during the first year after the index stroke.
One-year cumulative incidence of the primary and second- ary outcome events was 10.89% and 4.25%, respectively.
Comparisons of cumulative incidence according to baseline characteristics were presented in Table I in the online-only Data Supplement.
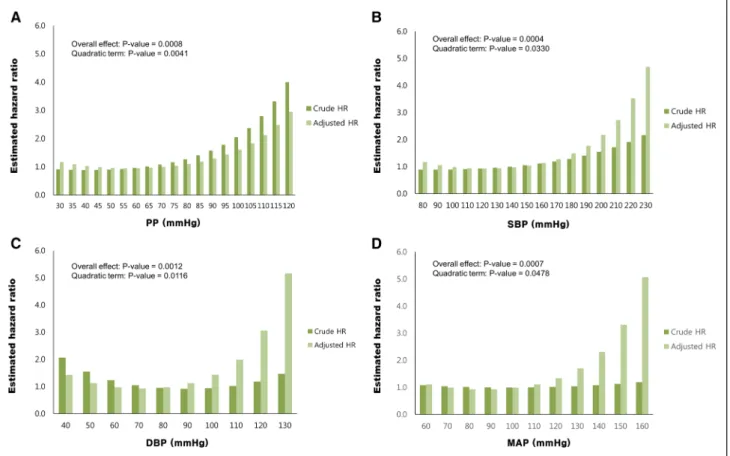
The crude HRs of PP for the primary outcome were the lowest at a 40 mm Hg point with increasing both above and below the nadir of 40 mm Hg, demonstrating a J-shape curve (Table 2; Figure 2). After adjusting for predetermined
Figure 1. Scatter plot between the blood pressure (BP) parameters. DBP indicates diastolic BP; MAP, mean arterial pressure; PP, pulse pressure; and SBP, systolic BP.
Downloaded from http://ahajournals.org by on January 29, 2019
covariates, an overall effect of PP was found to significantly associated with the risk of the primary outcome (P<0.001).
Adjusted HRs of PP were the lowest at 55 mm Hg and 60 mm Hg points, whereas increasing as PP was lower or higher than these points. Among other covariates, age, dia- betes mellitus, previous stroke or transient ischemic attack, and initial NIHSS increased the risk of the primary outcome independently, whereas hyperlipidemia and body mass index decreased its risk (Table 2).
Along with PP, the relationships between other BP param- eters including SBP, DBP, and MAP and adjusted risk of primary outcome also followed nonlinear, J-shape curves (Figure 2). All of P values for the quadratic terms of BP param- eters were statistically significant (P=0.004 for PP, P=0.03 for SBP, P=0.01 for DBP, and P=0.048 for MAP). Overall effects of SBP, DBP, and MAP on the primary outcome were also statistically significant (P<0.01).
Table 3 summarizes the −2 LL values. In comparisons of PP and other BP parameters, the predictive power of PP was stronger than the other BP parameters with respect to the primary outcome because the −2 LL differences of PP were higher than those of other BP parameters.
For the secondary outcome, crude HRs of PP were the low- est at 45 and 50 mm Hg points, whereas adjusted HRs were the lowest at 55 and 60 mm Hg points (Table II and Figure III in the online-only Data Supplement). Cox proportional haz- ards analysis showed a significant overall effect of PP on the secondary outcome (P=0.001; Table II in the online-only Data Supplement).
PP and SBP had nonlinear relationships with adjusted risks of the secondary outcome, whereas DBP and MAP had linear relationships (Figure III in the online-only Data Supplement). P values of the quadratic terms were sta- tistically significant for PP and SBP (P=0.01 and 0.048, respectively) but not for DBP and MAP (P=0.14 and 0.16, respectively). These 4 BP parameters were significantly associated with an increased risk of stroke recurrence; P val- ues of overall effect for each of BP parameters were 0.001 for PP, 0.0006 for SBP, 0.02 for DBP, and 0.004 for MAP.
Moreover, predictive power of PP was also stronger than that of SBP, DBP, and MAP (Table 3).
The post hoc analysis using a frailty model, which con- siders an interhospital heterogeneity, also showed nonlinear relationships between PP and adjusted risk of the primary and secondary outcomes (Tables III and IV in the online-only Data Supplement). Replacing stroke subtypes with SYSO also did not change the results (Tables V through VII in the online-only Data Supplement).
Discussion
In this study, PP had a nonlinear, J-shaped relationship with the future risk of major vascular events in patients with acute ischemic stroke. We also found that PP was a stronger predic- tor of the primary outcome than other BP parameters includ- ing SBP, DBP, and MAP. Similar results were shown for the analysis of stroke recurrence.
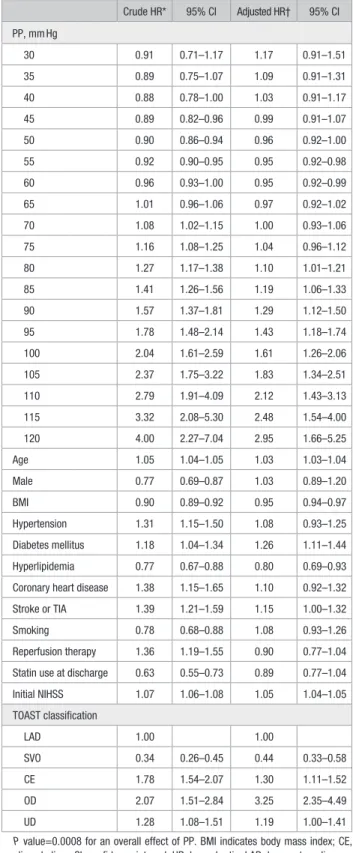
Controversy exists about the predictive power of PP in the presence of other commonly used BP parameters such as SBP, Table 2. Estimated HR of PP and Other Predetermined
Covariates for the Primary Outcome (a Composite of Stroke, Myocardial Infarction, or All-Cause of Death)
Crude HR* 95% CI Adjusted HR† 95% CI PP, mm Hg
30 0.91 0.71–1.17 1.17 0.91–1.51 35 0.89 0.75–1.07 1.09 0.91–1.31 40 0.88 0.78–1.00 1.03 0.91–1.17 45 0.89 0.82–0.96 0.99 0.91–1.07 50 0.90 0.86–0.94 0.96 0.92–1.00 55 0.92 0.90–0.95 0.95 0.92–0.98 60 0.96 0.93–1.00 0.95 0.92–0.99 65 1.01 0.96–1.06 0.97 0.92–1.02 70 1.08 1.02–1.15 1.00 0.93–1.06 75 1.16 1.08–1.25 1.04 0.96–1.12 80 1.27 1.17–1.38 1.10 1.01–1.21 85 1.41 1.26–1.56 1.19 1.06–1.33 90 1.57 1.37–1.81 1.29 1.12–1.50 95 1.78 1.48–2.14 1.43 1.18–1.74 100 2.04 1.61–2.59 1.61 1.26–2.06 105 2.37 1.75–3.22 1.83 1.34–2.51 110 2.79 1.91–4.09 2.12 1.43–3.13 115 3.32 2.08–5.30 2.48 1.54–4.00 120 4.00 2.27–7.04 2.95 1.66–5.25
Age 1.05 1.04–1.05 1.03 1.03–1.04
Male 0.77 0.69–0.87 1.03 0.89–1.20
BMI 0.90 0.89–0.92 0.95 0.94–0.97
Hypertension 1.31 1.15–1.50 1.08 0.93–1.25
Diabetes mellitus 1.18 1.04–1.34 1.26 1.11–1.44
Hyperlipidemia 0.77 0.67–0.88 0.80 0.69–0.93
Coronary heart disease 1.38 1.15–1.65 1.10 0.92–1.32
Stroke or TIA 1.39 1.21–1.59 1.15 1.00–1.32
Smoking 0.78 0.68–0.88 1.08 0.93–1.26
Reperfusion therapy 1.36 1.19–1.55 0.90 0.77–1.04 Statin use at discharge 0.63 0.55–0.73 0.89 0.77–1.04
Initial NIHSS 1.07 1.06–1.08 1.05 1.04–1.05
TOAST classification
LAD 1.00 1.00
SVO 0.34 0.26–0.45 0.44 0.33–0.58 CE 1.78 1.54–2.07 1.30 1.11–1.52 OD 2.07 1.51–2.84 3.25 2.35–4.49 UD 1.28 1.08–1.51 1.19 1.00–1.41 P value=0.0008 for an overall effect of PP. BMI indicates body mass index; CE, cardioembolism; CI, confidence interval; HR, hazard ratio; LAD, large artery disease;
NIHSS, National Institutes of Health Stroke Scale; OD, other determined; PP, pulse pressure; SVO, small vessel occlusion; TIA, transient ischemic attack; TOAST, Trial of ORG 10172 in Acute Stroke Treatment; and UD, undetermined.
*By bivariable Cox proportional hazard regression analysis.
†By multiple Cox proportional hazard regression analysis. PP was included as both a linear and a quadratic variable (nonlinear terms) in the multivariable model. The quadratic variable was statistically significant (P=0.0041).
Downloaded from http://ahajournals.org by on January 29, 2019
DBP, and MAP in relation to the occurrence of future vascular events in the general population and patients with acute coro- nary syndrome or stroke.3–5,7–9,20,21 An analysis of a community- dwelling population from the Framingham Heart Study showed that PP was an independent predictor of incident coronary heart disease.3 In that study, PP was an independent predictor after adjusting for SBP and DBP, but PP was inferior to SBP and DBP in its predictive power. Recently, a large population study (REGARDS [Reasons for Geographic and Racial Differences in Stroke]) reported that PP was associated with the future risk of acute coronary events independent of SBP, although other BP parameters were not considered.20 For incident ischemic stroke, another analysis based on the REGARDS population showed that PP was an independent predictor of incident stroke after adjusting for DBP or MAP, but not after adjusting for SBP.9 A meta-analysis of 16 cohort studies in Japan reported a mean- ingful association of PP with ischemic stroke in men but not in women after adjustments for MAP and a weaker predictive power of PP compared with MAP.7 However, SBP and DBP were not compared with PP in this study.
An analysis of the INVEST (International Verapamil SR-Trandolapril Study) showed that PP was a predictor of subsequent major vascular events in the patients who expe- rienced primary coronary heart disease, when considering either SBP, DBP, or MAP in multivariable models.21 For stroke populations, previous studies showed that PP was a predictor of 1-year recurrence,10 1-year mortality,11 or early clinical deterioration or 10-day recurrence,12 but these studies had relatively small sample size and did not consider other
commonly used BP parameters in the multivariable analy- sis.10–12 Recently a prospective cohort study of 672 patients with spontaneous intracerebral hemorrhage reported PP as an independent predictor for inhospital mortality.22 However, about ischemic stroke population, the predictive role of PP for future events is still questionable.
One of the reasons why previous studies did not consider PP and other commonly used BP parameters simultaneously nor compare the predictive power of PP with that of other BP parameters relates to possible concerns of multicollinearity as PP and other BP parameters may be highly correlated, as seen in our study (Figure 1). Furthermore, it may be invalid to compare risks of 2 different continuous measures directly when the amount of change in one measure is not compa- rable to the amount of change in the other.23,24 However, one may avoid this limitation by comparing the relative impor- tance of 2 such predictors (eg, PP and SBP) by applying the –2 LL comparison statistic, which assesses increased vari- ance when each measure is added to the same multivariate model.21,24
In contrast to the results of the INVEST study whereby PP had an inferior predictive power compared with SBP, DBP, or MAP for coronary heart disease,21 our results showed that PP was the most powerful predictor among all the BP parameters.
Moreover, the relationships between PP and the primary and secondary outcomes were independent of other known predic- tors of future vascular events (Table 2). These findings suggest that PP may be a more specific predictor of increased risk of subsequent major vascular events.
Figure 2. Blood pressure (BP) parameters and distribution of hazard ratios (HRs) for composite event outcomes. DBP indicates diastolic BP; MAP, mean arterial pressure; PP, pulse pressure; and SBP, systolic BP.
Downloaded from http://ahajournals.org by on January 29, 2019
The mechanism by which this phenomenon occurs remains to be further investigated. According to previous studies on BP change during the acute period of stroke, there is more marked elevation of SBP than DBP during the first few days after stroke.25–27 Acute stress reaction to stroke events, increased sympathetic tone, and compensatory reactions to cerebral ischemia might explain these findings.28,29 Since we collected BP data during the first 3 days after stroke onset, an
increase of PP could have occurred if there was more marked elevation of SBP than DBP during this time period. However, we have no data on how this increase during the relatively short-term period after stroke contributes to an increased risk of future vascular events.
Multivariable analyses showed that stroke subtypes influ- enced the risk of outcome events significantly (Table 2;
Table II in the online-only Data Supplement). About the primary outcome, increased risk in cardioembolism and decreased risk in small vessel occlusion were similar to pre- vious studies.30–32 Poorest outcome in the subtype of other determined etiologies has been reported before,32 but its rela- tively small sample size in this study (n=242) limits the gen- eralization of the results (Table 1; Table I in the online-only Data Supplement). It should be noted that the relationships between PP and primary and secondary outcomes were inde- pendent of stroke subtypes and SYSO. Additional analyses introducing SYSO instead of stroke subtypes showed the similar results (Tables V through VII in the online-only Data Supplement).
Unlike low-density lipoprotein cholesterol levels where the lower the better seems to be the rule,33 past evidence supports a nonlinear J-shaped curve relationship between BP and adverse vascular events in the general hypertensive population, as well as in high-risk populations, including subjects with coronary artery disease, diabetes mellitus, and the elderly.21,34 However, we have limited data on stroke subjects. Our study suggests that there is a nonlinear J-shaped relationship between BP measures and major vascular events in a stroke population (Figure 3). A post hoc analysis of the PROFESS trial (Prevention Regimen for Effectively Avoiding Second Strokes), a large second- ary prevention trial in patients with recent noncardioembolic stroke, reported similar results.35 More recently, a study from the Taiwan stroke registry showed a U-shape association of PP at admission with 3-month functional outcome, which would be another result showing the nonlinear relationship between BP and stroke outcomes.36
There are several limitations of this study. First, all the study subjects are Koreans admitted to university hospitals or regional stroke centers, which may limit generalization of the study results to other populations. Second, this study is a retrospective analysis of a prospective stroke registry data- base and thus, one should be cautious about interpretation of the findings in relation to causation. Third, we analyzed BP data collected during the first 3 days of acute ischemic stroke, and therefore, the results are limited to a confined period of time during which BP was measured. Fourth, BP data were obtained during the course of routine stroke care, therefore, BP measurement procedures were not standard- ized. Fifth, we did not collect the results of transthoracic echocardiography and could not consider hemodynamic impacts of abnormal cardiac function. Despite these limi- tations, our study provides a large prospective database of acute ischemic stroke patients and a novel approach to data analysis for study of BP measures and management of mul- ticollinearity challenges.
Moreover, our results might add something to our knowl- edge about prognosis and management of stroke. First, we show that PP has its own information value as a predictor for Table 3. Comparisons of a Predictive Power of PP Versus
Other BP Parameters for Primary and Secondary Outcomes
Blood Pressure Parameters
−2 Log- Likelihood Difference*
DF for χ2
Statistic P Value†
Primary outcome (stroke, MI, all-cause death)‡
PP vs SBP
SBP (linear term only)§ 5.91 1 0.015 PP (both linear and quadratic
terms) 8.49 2 0.014
PP vs DBP
DBP (both linear and
quadratic terms) 11.05 2 0.004
PP (both linear and quadratic
terms) 11.42 2 0.003
PP vs MAP
MAP (linear term only)¶ 5.91 1 0.015 PP (both linear and quadratic
terms) 8.75 2 0.013
Secondary outcome (stroke recurrence)‡
PP vs SBP
SBP (linear term only)§ 4.56 1 0.033 PP (both linear and quadratic
terms) 6.32 2 0.042
PP vs DBP
DBP (linear term only)‖ 4.56 1 0.033 PP (both linear and quadratic
terms) 10.07 2 0.007
PP vs MAP
MAP (linear term only)¶ 4.56 1 0.033 PP (both linear and quadratic
terms) 7.03 2 0.030
BP indicates blood pressure; DBP, diastolic BP; DF, degrees of freedom; MAP, mean arterial pressure; MI, myocardial infarction; NIHSS, National Institutes of Health Stroke Scale; PP, pulse pressure; SBP, systolic BP; and TOAST, Trial of ORG 10172 in Acute Stroke Treatment.
*A larger difference of −2 log-likelihood in model with 1 BP parameter (eg, SBP) compared with that of containing 2 BP parameters (eg, PP and SBP) indicates a greater predictive power in the later model.
†P value by χ2 test.
‡Variables adjusted were age, sex, body mass index, history of hypertension, diabetes mellitus, hyperlipidemia, coronary heart disease, smoking, previous history of stroke or transient ischemia attack, reperfusion therapy, discharge use of statin, initial NIHSS, and TOAST classification.
§,‖,¶When SBP,§ DBP,‖ or MAP¶ was included along with PP, its quadratic term was not significant, respectively.
Downloaded from http://ahajournals.org by on January 29, 2019
future events; thus, PP may have its role as a prognostic bio- marker for stroke outcome besides traditional BP parameters.
Second, PP could be a potential target for intervention. For example, the destiffening strategy of selective SBP reduction using renin–angiotensin–aldosterone system inhibitor has been suggested.6
Conclusions
This study shows that in a large acute ischemic stroke patient cohort from a multicenter prospective stroke registry, PP obtained in the acute period of stroke has a nonlinear, J-shaped relationship with major vascular events, or stroke recurrence.
Furthermore, the predictive power of PP is stronger than that of other commonly used BP parameters. Future study is war- ranted to confirm the finding of our study and to extend it to the subacute or chronic period of stroke.
Disclosures
None.
Sources of Funding
This study was supported by Korea Healthcare Technology R&D Project, Ministry of Health and Welfare, Republic of Korea (HI10C2020).
References
1. Dart AM, Kingwell BA. Pulse pressure–a review of mechanisms and clinical relevance. J Am Coll Cardiol. 2001;37:975–984.
2. Naka KK, Ikonomidis I. Brachial pulse pressure in heart failure: simple to measure but complex to interpret. Eur Heart J. 2015;ehv005.
3. Franklin SS, Khan SA, Wong ND, Larson MG, Levy D. Is pulse pressure useful in predicting risk for coronary heart disease? The Framingham heart study. Circulation. 1999;100:354–360.
4. de Simone G, Roman MJ, Alderman MH, Galderisi M, de Divitiis O, Devereux RB. Is high pulse pressure a marker of preclinical cardio- vascular disease? Hypertension. 2005;45:575–579. doi: 10.1161/01.
HYP.0000158268.95012.08.
5. Domanski M, Norman J, Wolz M, Mitchell G, Pfeffer M. Cardiovascular risk assessment using pulse pressure in the first national health and nutrition examination survey (NHANES I). Hypertension. 2001;38:
793–797.
6. Safar ME, Blacher J, Jankowski P. Arterial stiffness, pulse pressure, and cardiovascular disease-is it possible to break the vicious circle?
Atherosclerosis. 2011;218:263–271. doi: 10.1016/j.atherosclerosis.
2011.04.039.
7. Miura K, Nakagawa H, Ohashi Y, Harada A, Taguri M, Kushiro T, et al;
Japan Arteriosclerosis Longitudinal Study (JALS) Group. Four blood pres- sure indexes and the risk of stroke and myocardial infarction in Japanese men and women: a meta-analysis of 16 cohort studies. Circulation.
2009;119:1892–1898. doi: 10.1161/CIRCULATIONAHA.108.823112.
8. Sabayan B, van Vliet P, de Ruijter W, Gussekloo J, de Craen AJ, Westendorp RG. High blood pressure, physical and cognitive function, and risk of stroke in the oldest old: the Leiden 85-plus Study. Stroke.
2013;44:15–20. doi: 10.1161/STROKEAHA.112.663062.
9. Glasser SP, Halberg DL, Sands CD, Mosher A, Muntner PM, Howard G. Is pulse pressure an independent risk factor for incident stroke, rea- sons for geographic and racial differences in stroke. Am J Hypertens.
2015;28:987–994. doi: 10.1093/ajh/hpu265.
10. Tsivgoulis G, Spengos K, Zakopoulos N, Manios E, Xinos K, Vassilopoulos D, et al. Twenty four hour pulse pressure predicts long term recurrence in acute stroke patients. J Neurol Neurosurg Psychiatry.
2005;76:1360–1365. doi: 10.1136/jnnp.2004.057265.
11. Vemmos KN, Tsivgoulis G, Spengos K, Manios E, Daffertshofer M, Kotsis V, et al. Pulse pressure in acute stroke is an independent pre- dictor of long-term mortality. Cerebrovasc Dis. 2004;18:30–36. doi:
10.1159/000078605.
12. Geeganage C, Tracy M, England T, Sare G, Moulin T, Woimant F, et al; for TAIST Investigators. Relationship between baseline blood pres- sure parameters (including mean pressure, pulse pressure, and variabil- ity) and early outcome after stroke: data from the Tinzaparin in Acute Ischaemic Stroke Trial (TAIST). Stroke. 2011;42:491–493. doi: 10.1161/
STROKEAHA.110.596163.
13. Aslanyan S, Weir CJ, Lees KR; GAIN International Steering Committee and Investigators. Elevated pulse pressure during the acute period of ischemic stroke is associated with poor stroke outcome. Stroke.
2004;35:e153–e155. doi: 10.1161/01.STR.0000126598.88662.16.
14. Kim BJ, Han MK, Park TH, Park SS, Lee KB, Lee BC, et al; CRCS-5 Investigators. Current status of acute stroke management in Korea: a report on a multicenter, comprehensive acute stroke registry. Int J Stroke.
2014;9:514–518. doi: 10.1111/ijs.12199.
15. Kim BJ, Park JM, Kang K, Lee SJ, Ko Y, Kim JG, et al. Case character- istics, hyperacute treatment, and outcome information from the clinical research center for stroke-fifth division registry in South Korea. J Stroke.
2015;17:38–53. doi: 10.5853/jos.2015.17.1.38.
16. Ko Y, Lee S, Chung JW, Han MK, Park JM, Kang K, et al. MRI-based algorithm for acute ischemic stroke subtype classification. J Stroke.
2014;16:161–172. doi: 10.5853/jos.2014.16.3.161.
17. Ko Y, Park JH, Yang MH, Ko SB, Han MK, Oh CW, et al. The signifi- cance of blood pressure variability for the development of hemorrhagic transformation in acute ischemic stroke. Stroke. 2010;41:2512–2518.
doi: 10.1161/STROKEAHA.110.595561.
18. Kang J, Ko Y, Park JH, Kim WJ, Jang MS, Yang MH, et al. Effect of blood pressure on 3-month functional outcome in the subacute stage of ischemic stroke. Neurology. 2012;79:2018–2024. doi: 10.1212/
WNL.0b013e3182749eb8.
19. Chung JW, Kim N, Kang J, Park SH, Kim WJ, Ko Y, et al. Blood pres- sure variability and the development of early neurological deterioration following acute ischemic stroke. J Hypertens. 2015;33:2099–2106. doi:
10.1097/HJH.0000000000000675.
20. Glasser SP, Halberg DL, Sands C, Gamboa CM, Muntner P, Safford M. Is pulse pressure an independent risk factor for incident acute cor- onary heart disease events? The REGARDS study. Am J Hypertens.
2014;27:555–563. doi: 10.1093/ajh/hpt168.
21. Bangalore S, Messerli FH, Franklin SS, Mancia G, Champion A, Pepine CJ. Pulse pressure and risk of cardiovascular outcomes in patients with hypertension and coronary artery disease: an INternational VErapamil SR-trandolapril STudy (INVEST) analysis. Eur Heart J. 2009;30:1395–
1401. doi: 10.1093/eurheartj/ehp109.
22. Chang JJ, Khorchid Y, Dillard K, Kerro A, Burgess LG, Cherkassky G, et al. Elevated pulse pressure levels are associated with increased in- hospital mortality in acute spontaneous intracerebral hemorrhage. Am J Hypertens. 2017;30:719–727. doi: 10.1093/ajh/hpx025.
23. Davidson KW, Haas DC, Shimbo D, Pickering TG, Jonas BS.
Standardizing the comparison of systolic blood pressure vs. pulse pres- sure for predicting coronary heart disease. J Clin Hypertens (Greenwich).
2006;8:411–413.
24. Davidson KW, Pickering TG, Jonas BS. Cautionary note on the use of pulse pressure as a risk factor for coronary heart disease. Circulation.
2001;104:E128–E129.
25. Wallace JD, Levy LL. Blood pressure after stroke. JAMA. 1981;246:
2177–2180.
26. Harper G, Fotherby MD, Panayiotou BJ, Castleden CM, Potter JF. The changes in blood pressure after acute stroke: abolishing the ‘white coat effect’ with 24-h ambulatory monitoring. J Intern Med. 1994;235:343–346.
27. Morfis L, Schwartz RS, Poulos R, Howes LG. Blood pressure changes in acute cerebral infarction and hemorrhage. Stroke. 1997;28:
1401–1405.
28. Dorrance AM, Fink G. Effects of stroke on the autonomic nervous sys- tem. Compr Physiol. 2015;5:1241–1263. doi: 10.1002/cphy.c140016.
29. Castillo J, Leira R, García MM, Serena J, Blanco M, Dávalos A. Blood pressure decrease during the acute phase of ischemic stroke is associated with brain injury and poor stroke outcome. Stroke. 2004;35:520–526.
doi: 10.1161/01.STR.0000109769.22917.B0.
30. Petty GW, Brown RD Jr, Whisnant JP, Sicks JD, O’Fallon WM, Wiebers DO. Ischemic stroke subtypes: a population-based study of functional outcome, survival, and recurrence. Stroke. 2000;31:1062–1068.
31. Nam HS, Kim HC, Kim YD, Lee HS, Kim J, Lee DH, et al. Long- term mortality in patients with stroke of undetermined etiology. Stroke.
2012;43:2948–2956. doi: 10.1161/STROKEAHA.112.661074.
32. Kang K, Park TH, Kim N, Jang MU, Park SS, Park JM, et al. Recurrent stroke, myocardial infarction, and major vascular events during the first
Downloaded from http://ahajournals.org by on January 29, 2019
year after acute ischemic stroke: the multicenter prospective observa- tional study about recurrence and its determinants after acute ischemic stroke I. J Stroke Cerebrovasc Dis. 2016;25:656–664. doi: 10.1016/j.
jstrokecerebrovasdis.2015.11.036.
33. Baigent C, Blackwell L, Emberson J, Holland LE, Reith C, Bhala N, Peto R, Barnes EH, Keech A, Simes J, Collins R; Cholesterol Treatment Trialists’ (CTT) Collaboration. Efficacy and safety of more intensive lowering of LDL cholesterol: a meta-analysis of data from 170,000 participants in 26 randomised trials. Lancet. 2010;376:1670–1681. doi:
10.1016/S0140-6736(10)61350-5.
34. Malyszko J, Muntner P, Rysz J, Banach M. Blood pressure levels and stroke: J-curve phenomenon? Curr Hypertens Rep. 2013;15:575–581.
doi: 10.1007/s11906-013-0402-z.
35. Ovbiagele B, Diener HC, Yusuf S, Martin RH, Cotton D, Vinisko R, et al; PROFESS Investigators. Level of systolic blood pressure within the normal range and risk of recurrent stroke. JAMA. 2011;306:2137–2144.
doi: 10.1001/jama.2011.1650.
36. Tang SC, Yin JH, Liu CH, Sun MH, Lee JT, Sun Y et al. Low pulse pres- sure after acute ischemic stroke is associated with unfavorable outcomes:
the Taiwan Stroke Registry. J Am Heart Assoc. 2017;6. pii: e005113.
Downloaded from http://ahajournals.org by on January 29, 2019