Prevalence of Osteoporosis in the Korean Population Based on Korea National Health and Nutrition Examination
Survey (KNHANES), 2008--2011
Eun Jung Park,1 Il Woo Joo,1 Myoung-Jin Jang,2 Young Taek Kim,2 Kyungwon Oh,2 and Han Jin Oh1
1Department of Family Medicine, Cheil General Hospital and Women’s Healthcare Center, Kwandong University College of Medicine, Seoul;
2Division of Health and Nutrition Survey, Korea Centers for Disease Control and Prevention, Cheongwon-gun, Korea.
Received: August 12, 2013 Revised: November 21, 2013 Accepted: November 21, 2013
Co-corresponding authors: Dr. Han Jin Oh, Department of Family Medicine, Cheil General Hospital and Women’s Healthcare Center, 17 Seoae-ro 1-gil, Jung-gu, Seoul 100-380, Korea.
Tel: 82-2-2000-7069, Fax: 82-2-2263-7896 E-mail: [email protected] and Dr. Kyungwon Oh,
Division of Health and Nutrition Survey, Korea Centers for Disease Control and Prevention, Osong Health Technology Administration Complex,
187 Osongsaengmyeong 2-ro, Cheongwon-gun,
Chungcheongbuk-do 363-951, Korea.
Tel: 82-43-719-7460, Fax: 82-43-719-7527 E-mail: [email protected]
∙ The authors have no financial conflicts of interest.
© Copyright:
Yonsei University College of Medicine 2014 This is an Open Access article distributed under the terms of the Creative Commons Attribution Non- Commercial License (http://creativecommons.org/
licenses/by-nc/3.0) which permits unrestricted non- commercial use, distribution, and reproduction in any medium, provided the original work is properly cited.
Purpose: We analyzed age-related changes of bone mineral density (BMD) and compared with those of U.S and Japanese participants to investigate the preva- lence of osteoporosis in Korea. Materials and Methods: The data were collected in the 2008--2011 in Korea National Health and Nutrition Examination Survey (KNHANES) IV and V to select a representative sample of civilian, noninstitu- tionalized South Korean population. Bone mineral measurements were obtained from 8332 men and 9766 women aged 10 years and older. Results: BMD in men continued to decline from 3rd decade, however, in women, BMD remained nearly constant until the 4th decade and declined at rapid rate from the 5th decade. The prevalence of osteoporosis in Korea is 7.3% in males and 38.0% in females aged 50 years and older. The prevalence of osteopenia in Korea is 46.5% in males and 48.7% in females, aged 50 years and older. The lumbar spine and femur BMD in Korean females 20 to 49 years of ages was lower than in U.S. and Japan partici- pants. Conclusion: There was obvious gender, and age differences in the BMD based on the 2008--2011 KNHANES IV and V, a nationwide, cross-sectional sur- vey conducted in a South Korean population. We expect to be able to estimate ref- erence data through ongoing KNHANES efforts in near future.
Key Words: Prevalence, osteoporosis, BMD
INTRODUCTION
Osteoporosis is defined as a disease characterized by low bone mass and micro-ar- chitectural deterioration of bone tissue, leading to enhanced bone fragility and a consequent increase in fracture risk.1 Since osteoporosis causes fractures, pain and inconvenience of activity, prevention of osteoporosis is of great importance in maintaining quality-of-life of the elderly.2,3 Bone mineral density (BMD) is influ- enced by ethnicity, geographic factors, diet, exercise, family history, and other life- style factors. For example, BMD values in white females are lower than in black fe- males, and values in Asian females are lower than in white females.4-6 Much effort is needed to determine appropriate reference values of BMD at different skeletal sites
ban or rural: seven metropolitan cities or six provinces).
Study variables General characteristics
We obtained information regarding gender, age and chronic illness in each residential area.
We asked participants whether they had ever suffered hy- pertension, dyslipidemia, diabetes mellitus, thyroid disease, anemia, chronic hepatitis, cerebral stroke, ischemic heart disease, osteoporosis, or chronic lung disease. Participants were also asked about any history of bone fractures.
Anthropometric measurements
Research staff obtained anthropometric measurements while participants wore light clothing and no shoes. Height was measured to the nearest 0.1 cm, and weight was mea- sured in the upright position to the nearest 0.1 kg on a cali- brated balance-beam scale.
Body mass index (BMI) was calculated using the follow- ing equation:
BMI=weight (kg)/square of height (m2).
Bone mineral density measurement
We measured BMD (g/cm2) at the lumbar spine (L2--4), femoral neck, trochanter, and Ward’s triangle by DXA (Ho- logic Dis covery, Hologic Inc., Bedford, MA, USA). The machine was calibrated daily, and the coefficients for dupli- cate measurements in 50 adults were 2.2%, 1.9%, and 2.3%, respectively. The BMD data for U.S. participants were avail- able from the new reference databases, National Health and Nutrition Examination Survey (NHANES) (2007--2008).
The Japanese BMD data were obtained from a previous healthy Japanese-population-based osteoporosis cohort study in which the BMDs at the lumbar spine and hip were mea- sured with the Hologic QDR 4500 bone densitometer.12 Definition of osteoporosis
According to the World Health Organization (WHO) diag- nostic classification, the diagnosis of osteoporosis is estab- lished by measurement of BMD by DXA of the spine and hip, and/or forearm, although a clinical diagnosis can be made in individuals who sustain a low-trauma or fragility ftracture.9 The WHO defines osteoporosis as a BMD of 2.5 standard deviations (SD) below the peak bone mass of a young, healthy, gender- and race-matched reference popu- lation, as follows:10
in different races and areas to accurately diagnose osteopo- rosis.
In Korea, the government and medical officials have re- cently emphasized the importance of osteoporosis, and marketing of osteoporosis medications has shown a dra- matic increase during the past five years. Previous studies conducted in Korea have also investigated the prevalence of osteoporosis in specific populations. For example, one study surveyed the incidence of osteoporosis in a healthy Korean population by obtaining the BMD at the distal radi- us and calcaneus. The “Ansung cohort study,” which was conducted in a rural setting, revealed the prevalence of Ko- rean osteoporosis in the Ansung regional area.7,8
Large-scale epidemiologic studies regarding the preva- lence of osteoporosis and osteopenia have been conducted extensively in Western countries; however, the Ministry of Health and Welfare in Korea had pushed back this task on the priority risk and had prevented similar studies in a rep- resentative South Korean sample. The Ministry of Health and Welfare in Korea began a nationwide, cross-sectional survey measuring the BMD (g/cm2) at the lumbar spine (L2--4), femoral neck, trochanter, and Ward’s triangle using dual-energy X-ray absorptiometry (DXA) (Hologic Dis- covery, Hologic Inc., Bedford, MA, USA) in 2008. In this report, we present the 2008--2011 Korea National Health and Nutrition Examination Survey (KNHANES) IV and V data on BMD and the prevalence of osteoporosis among a South Korean population aged 10 years or older.
MATERIALS AND METHODS
Study population
The data were collected in the 2008--2011 KNHANES IV and V, a nationwide, cross-sectional survey conducted in a South Korean population in 2008--2011 which used a strati- fied, multi-stage clustered probability sampling to select a representative sample of civilian, non-institutionalized South Korean population. All examination and health interviews by trained teams were conducted in mobile centers while nutrition survey was done in household. DXA examinations were conducted on sampled persons aged 10 years and old- er except for pregnant women or persons who had exami- nation with a contrast agent within a week of the survey.
Bone mineral measurements were obtained from 8332 men and 9766 women aged 10 years and older. Participants were analyzed according to age bracket and residential area (ur-
roidism, hyperparathyroidism, chronic renal failure, bron- chial asthma, rheumatoid arthritis, cancer, and objects which are being taken such as glucocorticoids or thyroid hormone.
18098 participants (8332 males and 9766 females) were included in the study.
The anthropometric characteristics of participants, divid- ed into 10-year age groups, are listed in Table 1. BMI tend- ed to be greater in middle-aged (40--49) males and older fe- males (60--69) than in young participants.
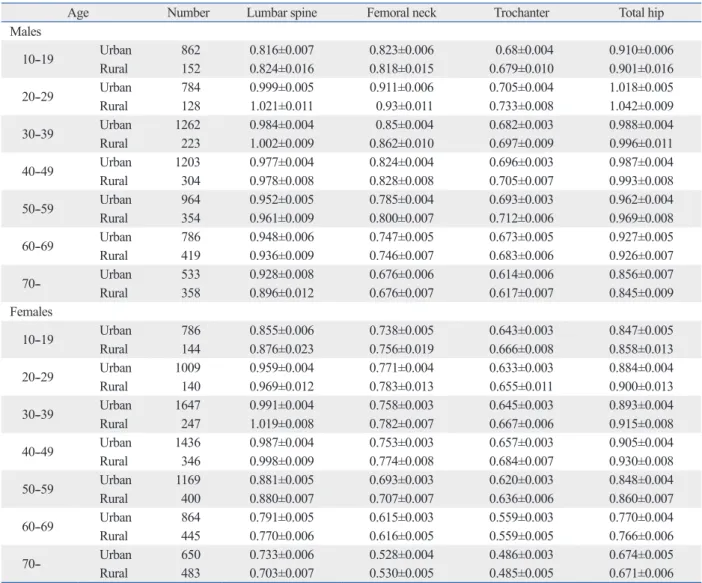
Table 2-1 lists age-specific mean BMD at the lumbar spine, femoral neck, femoral trochanter, and total hip. The mean BMD, according to residential area (urban or rural:
seven metropolitan cities or six provinces), is also present- ed in Table 2-2. Table 3 shows the peak BMD at the lumbar spine, femoral neck, femoral trochanter, and total hip, ac- cording to different age spans. BMD at the lumbar spine, femoral neck, femoral trochanter, and total hip were lower in males than in females. For residential areas, overall BMD was lower in urban males aged 20 to 59 years than in rural males of the same age group. In female, overall BMD was lower in urban females 10 to 59 years of age than in rural females of the same age. The peak BMD of the lumbar spine, femoral neck, femoral trochanter, and total hip in Ko- rean males reached at the ages of 20--29 years. In females, the peak BMD reached at different times in different skeletal The T-score compares and individual’s BMD with the
mean value for young normal individuals and expresses the differences as a standard deviation score.9
1) Normal bone mass: T-score (-1.0 and above)
2) Low bone mass (osteopenia): T-score (between -1.0 and -2.5)
3) Osteoporosis: T-score (-2.5 and below)
The T-score compares and individual’s BMD with the mean value for young normal individuals and expresses the differences as a standard deviation score.10
Exclusion criteria
The exclusion criteria included current patient’s report of any disease that affects bone metabolism, including hyper- thyroidism, hyperparathyroidism, chronic renal failure, bronchial asthma, rheumatoid arthritis, and cancer, and ob- jects which are being taken, such as glucocorticoids or thy- roid hormone.
Statistical analysis
Data were analyzed using SAS software, version 9.2 (SAS Institute, Cary, NC, USA).
Mean bone mineral densities and prevalence of osteoporo- sis were estimated by performing PROC SURVEYMEANS procedure. The BMD differences between the geographic areas in Korean population and ethnic group in Korean and US population were tested using PROC SURVEYREG pro- cedure. For comparison with US population, BMD data of NHANES (2007--2010) were used.11 The comparison of BMD in Korean female population with those in Japanese female population was performed using t-test, calculated based on the BMD estimates and their standard errors.12 Dif- ferences were considered to be statistically significant when the p value was less than 0.05. All estimates were obtained using the sample weight which was adjusted for oversam- pling, nonresponse and Korean population in 2008--2011, and standard error of estimates were estimated accounting for the complex survey design with SURVEY procedure.
The age-specific prevalence of osteoporosis was calculated in males and postmenopausal females aged 50 years and old- er. Also, the prevalence of 50 years and older was calculated.
RESULTS
Exclusion criteria included those who reported any current disease that affects bone metabolism, including hyperthy-
Table 1. Age-Stratified Anthropometric Participant Charac- teristics
Age Number Height (cm) Weight (kg) BMI (kg/m2) Males
10--19 1014 165.5±0.5 58.7±0.6 21.1±0.1 20--29 912 174.8±0.2 72.4±0.5 23.7±0.2 30--39 1485 173.0±0.2 72.9±0.3 24.3±0.1 40--49 1507 170.5±0.2 71.2±0.3 24.5±0.1 50--59 1318 168.6±0.2 68.8±0.3 24.2±0.1 60--69 1205 166.2±0.2 66.0±0.3 23.8±0.1 70-- 891 164.2±0.2 61.6±0.4 22.8±0.1 Total 8332 170.2±0.1 69.1±0.2 23.7±0.1 Females
10--19 930 157.5±0.3 51.1±0.5 20.4±0.2 20--29 1149 161.5±0.2 55.9±0.4 21.4±0.1 30--39 1894 159.7±0.1 57.3±0.3 22.5±0.1 40--49 1782 157.9±0.1 58.6±0.3 23.5±0.1 50--59 1569 155.6±0.2 58.5±0.2 24.2±0.1 60--69 1309 153.6±0.2 58.0±0.3 24.6±0.1 70-- 1133 149.5±0.2 53.5±0.3 23.9±0.1 Total 9766 157.4±0.1 56.5±0.1 22.8±0.1 BMI, body mass index.
Values are presented as number and mean±standard error.
DISCUSSION
Little epidemiological study data are available for osteopo- rosis prevalence in Korea. Therefore, this study is highly significant, because this is the first nationwide, cross-section- al survey, performed in Korea on osteoporosis incidence, un- der the supervision of the Ministry of Health and Welfare.
In the present study, BMD at the femoral neck, femoral tro- chanter and total hip were significantly lower in females than in males. Residential area factors indicated that overall BMD was lower in urban males aged 20 to 59 years than in rural males of the same age group. In female, overall BMD was lower in urban females 10 to 59 years of age than in ru- ral females of the same age. Geographic differences in BMD in the older-aged group were observed in our participants even though the Korean population predominantly consists of only one race. If future studies can analyze determinants of the differences in BMD, such as environmental or life- style factors, then the cause of these differences could be clarified.
The peak BMD of the lumbar spine, femoral neck, femo- ral trochanter, and total hip in Korean males reached at the ages of 20--29 years. In females, the peak BMD reached at different times in different skeletal sites: 20--29 years of age at femoral neck, 30--39 years of age at lumbar spine, and 40-- 49 years of age at femur trochanter and total hip. This find- sites, 20--29 years of age at femoral neck, 30--39 years of age
at lumbar spine, and 40--49 years of age at femur trochanter and total hip.
Table 4-1 shows the prevalence of osteoporosis in males and postmenopausal females aged 50 years and older. The prevalence of osteoporosis in Korea is 7.3% in males and 38.0% in females, aged 50 years and older. The prevalence of osteopenia in Korea is 46.5% in males and 48.7% in fe- males aged 50 years and older. Table 4-2 lists the preva- lence of osteoporosis in the same males and postmenopaus- al females aged, 50 years and older, according to specific skeletal sites. The prevalence of osteoporosis in the Korean population over age 50 at lumbar, femoral neck and total hip locations was 5.7%, 3.0%, and 0.7% in males and 30.1%, 23.1%, and 4.9% in females, respectively.
Fig. 1 illustrates the average BMD at the lumbar spine, femoral neck, femoral trochanter, and total hip in partici- pants based on 10-year age groups, Fig. 2 presents a com- parison of reference curves for BMD at different skeletal sites in Korean and U.S. participants, and Fig. 3 presents a comparison of reference curves for BMD at different skele- tal sites in Korean and Japanese females. The BMD at ev- ery measured skeletal site in Korean males and females was significantly lower than that of U.S. participants. The lum- bar spine and femur BMD in Korean females of 20 to 49 years of age was significantly lower than in Japanese fe- males, according to t-test.
Table 2-1. Bone Mineral Density (g/cm2) at Various Skeletal Sites by Age Bracket-Whole Population
Age Number Lumbar spine Femoral neck Trochanter Total hip
Males
10--19 1014 0.817±0.006 0.822±0.006 0.680±0.003 0.908±0.006
20--29 912 1.002±0.004 0.914±0.005 0.709±0.004 1.021±0.005
30--39 1485 0.987±0.004 0.852±0.004 0.684±0.003 0.989±0.004
40--49 1507 0.977±0.004 0.824±0.003 0.698±0.003 0.988±0.003
50--59 1318 0.955±0.004 0.789±0.004 0.698±0.003 0.964±0.004
60--69 1205 0.944±0.005 0.746±0.004 0.676±0.004 0.927±0.004
70-- 891 0.916±0.007 0.676±0.005 0.615±0.005 0.852±0.005
Total 8332 0.957±0.002 0.826±0.002 0.689±0.001 0.969±0.002
Females
10--19 930 0.859±0.007 0.741±0.005 0.647±0.003 0.849±0.005
20--29 1149 0.960±0.004 0.773±0.004 0.635±0.003 0.886±0.004
30--39 1894 0.994±0.003 0.761±0.003 0.648±0.003 0.895±0.003
40--49 1782 0.989±0.004 0.757±0.003 0.662±0.003 0.910±0.003
50--59 1569 0.881±0.004 0.696±0.003 0.624±0.003 0.851±0.003
60--69 1309 0.785±0.004 0.615±0.003 0.559±0.002 0.769±0.003
70-- 1133 0.722±0.005 0.529±0.003 0.485±0.003 0.673±0.004
Total 9766 0.914±0.002 0.718±0.002 0.623±0.001 0.855±0.002
Values are presented as number and mean±standard error.
won and Ansung cohort studies.7,8,15 We suggest that this discrepancy resulted from the differences in general nutri- tional status and environment (such as sun exposure), ac- ing indicates that Korean females attain peak BMD over a
variable time interval depending on skeletal sites. This dif- ference in peak BMD age among the skeletal sites is impor- tant for implementing preventive procedures for females, in- cluding actions for obtaining greater peak bone at sites, such as the femur. We suggest that this difference between gen- ders might be caused by the difference in sex hormones and geometry of the hip axis between males and females.13,14 However, the determinants of the differences between the two genders remain un clear.
Prevalence of osteoporosis in Korea is 7.3% in males and 38.0% in females aged 50 years and older, and prevalence of osteopenia in Korea is 46.5% in males and 48.7% in fe- males aged 50 years and older. The prevalence found in this study was higher than that reported in previous Korean co- hort studies performed in rural settings, such as the Nam-
Table 3. Peak Bone Mineral Density Values and Skeletal Sites among a Korean Population
Age Peak BMD (g/cm2) Lumbar spine Male 20--29 1.002±0.004
Female 30--39 0.994±0.003 Femoral neck Male 20--29 0.914±0.005 Female 20--29 0.773±0.004
Trochanter Male 20--29 0.709±0.004
Female 40--49 0.662±0.003
Total hip Male 20--29 1.021±0.005
Female 40--49 0.910±0.003 BMD, bone mineral density.
Values are presented as number and mean±standard error.
Table 2-2. Bone Mineral Density (g/cm2) at Various Skeletal Sites by Age Bracket-Regional Population (Urban: Seven Metro- politan Cities/Rural: Six Provinces)
Age Number Lumbar spine Femoral neck Trochanter Total hip
Males
10--19 Urban 862 0.816±0.007 0.823±0.006 0.68±0.004 0.910±0.006
Rural 152 0.824±0.016 0.818±0.015 0.679±0.010 0.901±0.016
20--29 Urban 784 0.999±0.005 0.911±0.006 0.705±0.004 1.018±0.005
Rural 128 1.021±0.011 0.93±0.011 0.733±0.008 1.042±0.009
30--39 Urban 1262 0.984±0.004 0.85±0.004 0.682±0.003 0.988±0.004
Rural 223 1.002±0.009 0.862±0.010 0.697±0.009 0.996±0.011
40--49 Urban 1203 0.977±0.004 0.824±0.004 0.696±0.003 0.987±0.004
Rural 304 0.978±0.008 0.828±0.008 0.705±0.007 0.993±0.008
50--59 Urban 964 0.952±0.005 0.785±0.004 0.693±0.003 0.962±0.004
Rural 354 0.961±0.009 0.800±0.007 0.712±0.006 0.969±0.008
60--69 Urban 786 0.948±0.006 0.747±0.005 0.673±0.005 0.927±0.005
Rural 419 0.936±0.009 0.746±0.007 0.683±0.006 0.926±0.007
70-- Urban 533 0.928±0.008 0.676±0.006 0.614±0.006 0.856±0.007
Rural 358 0.896±0.012 0.676±0.007 0.617±0.007 0.845±0.009
Females
10--19 Urban 786 0.855±0.006 0.738±0.005 0.643±0.003 0.847±0.005
Rural 144 0.876±0.023 0.756±0.019 0.666±0.008 0.858±0.013
20--29 Urban 1009 0.959±0.004 0.771±0.004 0.633±0.003 0.884±0.004
Rural 140 0.969±0.012 0.783±0.013 0.655±0.011 0.900±0.013
30--39 Urban 1647 0.991±0.004 0.758±0.003 0.645±0.003 0.893±0.004
Rural 247 1.019±0.008 0.782±0.007 0.667±0.006 0.915±0.008
40--49 Urban 1436 0.987±0.004 0.753±0.003 0.657±0.003 0.905±0.004
Rural 346 0.998±0.009 0.774±0.008 0.684±0.007 0.930±0.008
50--59 Urban 1169 0.881±0.005 0.693±0.003 0.620±0.003 0.848±0.004
Rural 400 0.880±0.007 0.707±0.007 0.636±0.006 0.860±0.007
60--69 Urban 864 0.791±0.005 0.615±0.003 0.559±0.003 0.770±0.004
Rural 445 0.770±0.006 0.616±0.005 0.559±0.005 0.766±0.006
70-- Urban 650 0.733±0.006 0.528±0.004 0.486±0.003 0.674±0.005
Rural 483 0.703±0.007 0.530±0.005 0.485±0.005 0.671±0.006
Values are presented as number and mean±standard error.
we assumed that the previous reference data of a Korean population were obtained from one rural residential area that did not represent the nationwide Korean population, we chose the reference data of the Japanese, another Asian race, as the best alternative plan. Therefore, considerable cording to each residential area. This difference may also
result from the fact that T-scores was calculated using dif- ferent normal reference data. Our study used a manufactur- er-provided reference population based on a healthy Japa- nese-population-based osteoporosis study cohort.12,16-18 Since
Table 4-1. Prevalence of Osteoporosis and Osteopenia in Postmenopausal Females and in Males 50 Years of Age and Older- Whole Population
Age Number Osteoporosis Osteopenia Normal
Males
50--59 1318 3.6 43.1 53.3
60--69 1205 7.2 47.4 45.5
70-- 891 18.0 54.7 27.3
50 yrs and older 3414 7.3 46.5 46.3
Females
50--59 1569 15.0 59.6 25.4
60--69 1309 37.4 54.6 8.0
70-- 1133 70.7 27.7 1.6
50 yrs and older 4011 38.0 48.7 13.2
Values are presented as number and percentage (%).
Table 4-2. Prevalence of Osteoporosis and Osteopenia in Postmenopausal Females and in Males 50 Years of Age and Older- Depending on Various Skeletal Sites
Age Lumbar spine Femoral neck Total hip
Males 50--59 (n=1318)
Osteoporosis 3.5 0.3 0.0
Osteopenia 34.4 27.3 7.2
Normal 62.1 72.4 92.8
60--69 (n=1205)
Osteoporosis 5.9 2.7 0.3
Osteopenia 35.6 39.0 14.3
Normal 58.5 58.3 85.4
70-- (n=891)
Osteoporosis 11.7 11.0 3.5
Osteopenia 38.2 54.8 29.0
Normal 50.1 34.2 67.5
50 yrs and older (n=3414)
Osteoporosis 5.7 3.0 0.7
Osteopenia 35.5 35.7 13.2
Normal 58.8 61.3 86.1
Females 50--59 (n=1569)
Osteoporosis 12.9 5.1 0.3
Osteopenia 50.3 53.3 14.6
Normal 36.8 41.6 85.1
60--69 (n=1309)
Osteoporosis 30.9 17.0 1.0
Osteopenia 50.9 67.0 37.0
Normal 18.2 16.0 62.0
70-- (n=1133)
Osteoporosis 53.4 54.3 15.4
Osteopenia 37.3 42.5 59.0
Normal 9.3 3.2 25.6
50 yrs and older (n=4011)
Osteoporosis 30.1 23.1 4.9
Osteopenia 46.6 54.1 34.3
Normal 23.3 22.8 60.8
n, number.
Values are presented as number and percentage (%).
U.S. participants according to 2007--2010 NHANES. The lumbar spine and femur BMD in Korean females 20 to 49 years of ages was lower than in Japanese participants also.
Previous studies revealed that the BMD of European popu- lation exceeds that of the Chinese; however, the difference would disappear after adjusting for height.5,6 The differences in our present study might have likely resulted from the dif- ferent skeletal sizes common to each respective race. We should also consider nutrition and activity habits in each country. For example, people in Korea, spend less time in changes would occur if we adopted other reference popula-
tion data in this study.4 According to skeletal sites, the prev- alence of osteoporosis in the Korean population over 50 years of age at lumbar, femoral neck and total hip locations was 5.7%, 3.0%, and 0.7% in males and 30.1%, 23.1%, and 4.9% in females, respectively. The prevalence of osteo- porosis at the lumbar spine was similar to the general prev- alence in both genders. In comparison with other countries’
reference curves, the BMD at every skeletal site in Korean males and females was significantly lower than that of the
Fig. 1. Average bone mineral density (BMD) at the lumbar spine, femoral neck, femoral trochanter, and total hip in participants based on 10-year age groups.
Fig. 2-1. Comparison of reference curves for BMD at different skeletal sites in Korean and U.S. participants in males. BMD, bone mineral density.
0.0 0.0
0.2 0.2
0.4 0.4
0.6 0.6
0.8 0.8
1.0 1.0
1.2 1.2
BMD (g/cm2) BMD (g/cm2 )
10--19
Age (years)
Age (years)
Age (years)
Age (years)
Age (years)
Age (years) 10--19
20--29 30--39 40--49 50--59 60--69 70-- 20--29 30--39 40--49 50--59 60--69 70-- Lumbar spine
Femur neck Trochanter Hip total
Lumbar spine Femur neck Trochanter Hip total
Male Female
0.20 0.40 0.60 0.80 1.00 1.20
10--19 20--29 30--39 40--49 50--59 60--69 70-- Korea
Mexican-American Non-hispanic white Non-hispanic black
Total hip BMD (male)
0.20 0.40 0.60 0.80 1.00 1.20
10--19 20--29 30--39 40--49 50--59 60--69 70-- Korea
Mexican-American Non-hispanic white Non-hispanic black
Trochanter BMD (male)
0.20 0.40 0.60 0.80 1.00 1.20
10--19 20--29 30--39 40--49 50--59 60--69 70-- Korea
Mexican-American Non-hispanic white Non-hispanic black
Lumbar spine BMD (male)
0.20 0.40 0.60 0.80 1.00 1.20
10--19 20--29 30--39 40--49 50--59 60--69 70-- Korea
Mexican-American Non-hispanic white Non-hispanic black
Femoral neck BMD (male)
BMD (g/cm2)BMD (g/cm2) BMD (g/cm2 )BMD (g/cm2 )
Fig. 3. Comparison of reference curves for BMD at different skeletal sites in Korean and Japanese females. BMD, bone mineral density.
Fig. 2-2. Comparison of reference curves for BMD at different skeletal sites in Korean and U.S. participants in females. BMD, bone mineral density.
0.20 0.40 0.60 0.80 1.00 1.20
10--19 20--29 30--39 40--49 50--59 60--69 70-- Korea
Mexican-American Non-hispanic white Non-hispanic black
Femoral neck BMD (female)
0.20 0.40 0.60 0.80 1.00 1.20
10--19 20--29 30--39 40--49 50--59 60--69 70-- Korea
Mexican-American Non-hispanic white Non-hispanic black
Lumbar spine BMD (female) 0.20
0.40 0.60 0.80 1.00 1.20
10--19 20--29 30--39 40--49 50--59 60--69 70-- Korea
Mexican-American Non-hispanic white Non-hispanic black
Trochanter BMD (female)
0.20 0.40 0.60 0.80 1.00 1.20
10--19 20--29 30--39 40--49 50--59 60--69 70-- Korea
Mexican-American Non-hispanic white Non-hispanic black
Total hip BMD (female)
0.20 0.40 0.60 0.80 1.00 1.20
10--19 20--29 30--39 40--49 50--59 60--69 70--79 Korea
Japan
Femoral neck BMD (female)
0.20 0.40 0.60 0.80 1.00 1.20
10--19 20--29 30--39 40--49 50--59 60--69 70--79 Korea
Japan
Lumbar spine BMD (female) 0.20
0.40 0.60 0.80 1.00 1.20
10--19 20--29 30--39 40--49 50--59 60--69 70--79 Korea
Japan
Trochanter BMD (female)
0.20 0.40 0.60 0.80 1.00 1.20
10--19 20--29 30--39 40--49 50--59 60--69 70--79 Korea
Japan
Total hip BMD (female) Age (years)
Age (years)
Age (years)
Age (years)
BMD (g/cm2 )BMD (g/cm2 ) BMD (g/cm2 )BMD (g/cm2 )
Age (years)
Age (years)
Age (years)
Age (years)
BMD (g/cm2 )BMD (g/cm2 ) BMD (g/cm2 )BMD (g/cm2 )
8. Shin C, Abbott RD, Lee H, Kim J, Kimm K. Prevalence and cor- relates of orthostatic hypotension in middle-aged men and women in Korea: the Korean Health and Genome Study. J Hum Hyper- tens 2004;18:717-23.
9. Diab DL, Watts NB. Diagnosis and treatment of osteoporosis in older adults. Endocrinol Metab Clin North Am 2013;42:305-17.
10. Binkley N, Bilezikian JP, Kendler DL, Leib ES, Lewiecki EM, Petak SM, et al. Official positions of the International Society for Clinical Densitometry and Executive Summary of the 2005 Posi- tion Development Conference. J Clin Densitom 2006;9:4-14.
11. Centers for Disease Control and Prevention. National Health and Nutrition Examination Survey Data, 2007-2010. National Center for Health Statistics. Available at: http://wwwn.cdc.gov/nchs/
nhanes/search/nhanes07_08.aspx/, http://wwwn.cdc.gov/nchs/
nhanes/search/nhanes09_10.aspx/.
12. Iki M, Kagamimori S, Kagawa Y, Matsuzaki T, Yoneshima H, Marumo F. Bone mineral density of the spine, hip and distal fore- arm in representative samples of the Japanese female population:
Japanese Population-Based Osteoporosis (JPOS) Study. Osteopo- ros Int 2001;12:529-37.
13. Yang TS, Chen YR, Chen YJ, Chang CY, Ng HT. Osteoporosis:
prevalence in Taiwanese women. Osteoporos Int 2004;15:345-7.
14. Cummings SR, Cauley JA, Palermo L, Ross PD, Wasnich RD, Black D, et al. Racial differences in hip axis lengths might explain racial differences in rates of hip fracture. Study of Osteoporotic Fractures Research Group. Osteoporos Int 1994;4:226-9.
15. Cui LH, Choi JS, Shin MH, Kweon SS, Park KS, Lee YH, et al.
Prevalence of osteoporosis and reference data for lumbar spine and hip bone mineral density in a Korean population. J Bone Min- er Metab 2008;26:609-17.
16. Kin K, Kushida K, Yamazaki K, Okamoto S, Inoue T. Bone min- eral density of the spine in normal Japanese subjects using dual- energy X-ray absorptiometry: effect of obesity and menopausal status. Calcif Tissue Int 1991;49:101-6.
17. Yoshimura N, Hashimoto T, Morioka S, Sakata K, Kasamatsu T, Cooper C. Determinants of bone loss in a rural Japanese commu- nity: the Taiji Study. Osteoporos Int 1998;8:604-10.
18. Yu W, Qin M, Xu L, van Kuijk C, Meng X, Xing X, et al. Normal changes in spinal bone mineral density in a Chinese population:
assessment by quantitative computed tomography and dual-energy X-ray absorptiometry. Osteoporos Int 1999;9:179-87.
19. Wu XP, Liao EY, Huang G, Dai RC, Zhang H. A comparison study of the reference curves of bone mineral density at different skeletal sites in native Chinese, Japanese, and American Cauca- sian women. Calcif Tissue Int 2003;73:122-32.
outdoor sports activities, therefore, they might not get enough sun exposure and gravity condition of bone to reach peak BMD as residents in other countries do.19 We should also have considered the nutritional differences including calci- um intake between Korean, Japanese and U.S. participants.
Our study has several limitations. The first limitation is that no Korean reference values exist that differentiate be- tween BMD values at different skeletal sites; such parame- ters would allow clinicians to make a more accurate diag- noses of osteoporosis in a Korean population. Additionally, the present data apply only to non-institutionalized Kore- ans. Institutionalized patients may have lower BMDs due to their conditions, especially if they are bed-ridden.
Even though there are limitations, our present study consti- tutes rare data to represent the nationwide Korean popula- tion. We expect to be able to estimate reference data through ongoing efforts of KNHANES in near future.
REFERENCES
1. Consensus development conference: diagnosis, prophylaxis, and treatment of osteoporosis. Am J Med 1993;94:646-50.
2. Koval KJ, Zuckerman JD. Functional recovery after fracture of the hip. J Bone Joint Surg Am 1994;76:751-8.
3. Kanis JA, Pitt FA. Epidemiology of osteoporosis. Bone 1992;13 Suppl 1:S7-15.
4. Kanis JA, McCloskey EV, Johansson H, Oden A, Melton LJ 3rd, Khaltaev N. A reference standard for the description of osteoporo- sis. Bone 2008;42:467-75.
5. Kao CH, Chen CC, Wang SJ. Normal data for lumbar spine bone mineral content in healthy elderly Chinese: influences of sex, age, obesity and ethnicity. Nucl Med Commun 1994;15:916-20.
6. Russell-Aulet M, Wang J, Thornton JC, Colt EW, Pierson RN Jr.
Bone mineral density and mass in a cross-sectional study of white and Asian women. J Bone Miner Res 1993;8:575-82.
7. Kung AW, Ho AY, Ross PD, Reginster JY. Development of a clini- cal assessment tool in identifying Asian men with low bone min- eral density and comparison of its usefulness to quantitative bone ultrasound. Osteoporos Int 2005;16:849-55.