D I A B E T E S & M E T A B O L I S M J O U R N A L
This is an Open Access article distributed under the terms of the Creative Commons At- tribution Non-Commercial License (http://creativecommons.org/licenses/by-nc/3.0/) which permits unrestricted non-commercial use, distribution, and reproduction in any medium, provided the original work is properly cited.
Prevalence and Determinants of Diabetic Nephropathy in Korea: Korea National Health and Nutrition
Examination Survey
Jae Hee Ahn1, Ji Hee Yu1, Seung-Hyun Ko2, Hyuk-Sang Kwon2, Dae Jung Kim3, Jae Hyeon Kim4, Chul Sik Kim5, Kee-Ho Song6, Jong Chul Won7, Soo Lim8, Sung Hee Choi8, Kyungdo Han9, Bong-Yun Cha2, Nan Hee Kim1, on behalf of the Taskforce Team of Diabetes Fact Sheet of the Korean Diabetes Association
1Division of Endocrinology and Metabolism, Department of Internal Medicine, Korea University College of Medicine, Ansan,
2Division of Endocrinology and Metabolism, Department of Internal Medicine, The Catholic University of Korea College of Medicine, Seoul,
3Department of Endocrinology and Metabolism, Ajou University School of Medicine, Suwon,
4Division of Endocrinology and Metabolism, Department of Medicine, Samsung Medical Center, Sungkyunkwan University School of Medicine, Seoul,
5 Division of Endocrinology and Metabolism, Department of Internal Medicine, Hallym University Sacred Heart Hospital, Hallym University College of Medicine, Anyang,
6Department of Internal Medicine, Konkuk University School of Medicine, Seoul,
7Department of Internal Medicine, Mitochondrial Research Group, Inje University Sanggye Paik Hospital, Inje University College of Medicine, Seoul,
8Department of Internal Medicine, Seoul National University Bundang Hospital, Seoul National University College of Medicine, Seongnam,
9Department of Biostatistics, The Catholic University of Korea, Seoul, Korea
Background: Diabetic nephropathy is a leading cause of end stage renal disease and is associated with an increased risk of car- diovascular mortality. It manifests as albuminuria or impaired glomerular filtration rate (GFR), and the prevalence of diabetic nephropathy varies with ethnicity. The prevalence of diabetic nephropathy and its determinants in Korean adults have not previ- ously been studied at the national level. This cross-sectional study was undertaken to ascertain the prevalence and determinants of albuminuria and chronic kidney disease (CKD) in Korean patients with diabetes.
Methods: The Korea National Health and Nutrition Examination Survey (KNHANES) V, conducted in 2011, was used to define albuminuria (n=4,652), and the dataset of KNHANES IV–V (2008–2011) was used to define CKD (n=21,521). Selected samples were weighted to represent the entire civilian population in Korea. Albuminuria was defined as a spot urine albumin/creatinine ratio >30 mg/g. CKD was defined as a GFR <60 mL/min/1.73 m2.
Results: Among subjects with diabetes, 26.7% had albuminuria, and 8.6% had CKD. Diabetes was associated with an approxi- mate 2.5-fold increased risk of albuminuria, with virtually no difference between new-onset and previously diagnosed diabetes.
Only systolic blood pressure was significantly associated with albuminuria, and old age, high serum triglyceride levels, and pre- vious cardiovascular disease (CVD) were related with CKD in subjects with diabetes.
Conclusion: Korean subjects with diabetes had a higher prevalence of albuminuria and CKD than those without diabetes. Blood pressure was associated with albuminuria, and age, triglyceride level, and previous CVD were independent determinants of CKD in subjects with diabetes.
Keywords: Albuminuria; Chronic renal disease; Diabetes mellitus; Diabetic nephropathy; Korea
Corresponding author: Nan Hee Kim
Division of Endocrinology and Metabolism, Department of Internal Medicine, Korea University Ansan Hospital, Korea University College of Medicine, 123 Jeokgeum-ro, Danwon-gu, Ansan 425-707, Korea
INTRODUCTION
Diabetic nephropathy is the leading cause of end-stage renal
disease [1] and is associated with an increased risk of cardio- vascular mortality [2-4]. Approximately 40% of persons with diabetes develop diabetic nephropathy, which manifests as al- http://dx.doi.org/10.4093/dmj.2014.38.2.109
pISSN 2233-6079 · eISSN 2233-6087
buminuria or reduced glomerular filtration rate (GFR) [5,6].
However, the prevalence of albuminuria varies with ethnicity, with higher rates reported in Asian populations than in Cau- casian populations [7,8]. In addition, the prevalence of and risk factors for chronic kidney disease (CKD) demonstrate significant interracial disparities [9,10].
Several studies have reported the incidence and risk factors for diabetic nephropathy in Korean patients with diabetes. In a hospital-based study, Lee et al. [11] and Park et al. [12] re- ported that 34% of patients with diabetes had albuminuria and that poor glycemic control, high blood pressure, presence of diabetic retinopathy, and duration of diabetes were indepen- dently associated with albuminuria. Several studies have also investigated the risk factors for albuminuria, including male sex, hemoglobin A1c (HbA1c), homocysteine, body mass in- dex (BMI), fasting insulin level, and fasting C-peptide level [13-16]. However, the majority of epidemiologic studies are small single center reports or primary clinic based studies, and did not compare subjects with or without diabetes.
Recently, the prevalence of CKD in Korean adults in 2009 was reported to be 4.5% in men and 6.3% in women using data from the Korea National Health and Nutrition Examination Survey (KNHANES) IV [17]. However, the authors did not compare the prevalence of CKD by diabetes status, nor did they investigate the determinants of CKD. Furthermore, to the best of our knowledge, there have been no studies regarding al- buminuria using data from KNHANES. Albuminuria was mea- sured for the first time in the most recent version of KNHANES (2011); therefore, we were able to use this dataset to investigate the epidemiology of albuminuria, compared between subjects with or without diabetes.
Therefore, the aim of the present study was to investigate the prevalence and determinants of albuminuria and CKD ac- cording to the presence or absence of diabetes using the na- tionally representative dataset from KNHANES.
METHODS
Study population
KNHANES is a cross-sectional, nationwide survey examining the general health and nutrition status of Korean people. We included subjects aged >30 years and excluded subjects with a missing random urine microalbumin level, fasting plasma glu- cose level, or previous medical history. Data from KNHANES V, which was conducted in 2011, was used to estimate the preva-
lence of albuminuria. As a result, the data from 4,652 subjects were used to analyze albuminuria status. The KNHANES IV–V dataset (2008–2011) was used to estimate the prevalence of CKD.
Data from 21,521 subjects were used to analyze CKD status.
Definition of diabetes and glucose tolerance categories Diabetes was defined using the following criteria: 1) new onset diabetes, fasting blood glucose ≥126 mg/dL or HbA1c ≥6.5%
that was first detected in our survey; or 2) known diabetes, use of medication to decrease blood glucose levels at the time of the interview or self-report of a previous diagnosis by a physi- cian. Impaired fasting glucose (IFG) was defined as fasting plasma glucose levels in the range 100 to 125 mg/dL.
Definition of albuminuria and CKD
Diabetic nephropathy was defined as diabetes with the pres- ence of albuminuria or impaired GFR. In KNHANES V, which was conducted in 2011, urine albumin and creatinine concen- trations were measured using single urine sampling. Urinary albumin was evaluated by turbidimetric assay using a Hitachi Automatic Analyzer 7600 (Hitachi, Tokyo, Japan). Albumin- uria was defined as a spot urine albumin/creatinine ratio (ACR)
≥30 mg/g, and the albuminuria categories were as follows:
microalbuminuria, ACR 30 to 299 mg/g and macroalbumin- uria, ACR ≥300 mg/g. The level of kidney function was deter- mined by estimating the GFR using an abbreviated equation developed from the Modification of Diet in Renal Disease (MDRD) formula: estimated GFR (mL/min/1.73 m2)=186.3×
(serum creatinine−1.154)×(age−0.203)×0.742 (if female) [18]. We defined CKD as eGFR <60 mL/min/1.73 m2. The GFR catego- ries were defined using the following criteria: stage 1, GFR
≥90 mL/min/1.73 m2; stage 2, GFR 60 to 89 mL/min/1.73 m2; stage 3, 30 to 59 mL/min/1.73 m2; stage 4, GFR 15 to 29 mL/
min/1.73 m2; and stage 5, GFR <15 mL/min/1.73 m2. Other chronic diseases
Hypertension was defined as the presence of either of the fol- lowing two criteria: 1) systolic blood pressure (SBP) ≥140 mm Hg or diastolic blood pressure ≥90 mm Hg, or 2) use of an an- tihypertensive medication at the time of the interview. Dyslip- idemia was defined as the presence of any of the following three criteria: 1) serum triglyceride ≥200 mg/dL after 12 hours of fasting, 2) serum total cholesterol ≥240 mg/dL, or 3) use of an antidyslipidemic medication at the time of the interview.
Cardiovascular disease (CVD) history was self-reported and
included a history of congestive heart failure, coronary heart disease, heart attack, angina, or stroke. Medication history was ascertained using the questionnaire.
Health-related behavior
The amount of pure alcohol consumed (g/day) was calculated using the average number of alcoholic beverages consumed and frequency of alcohol consumption. Respondents who drank
>30 g/day were considered heavy drinkers. Regular exercise was defined as strenuous physical activity performed for ≥20 minutes at a time ≥3 times a week. A person was considered a smoker when they were currently smoking and had smoked
>100 cigarettes in their lifetime.
Statistical analysis
All data are presented as mean±standard error (SE) for con- tinuous variables or as proportion (SE) for categorical variables.
Logarithmic transformation was used for variables with skewed distributions. Statistical analyses were performed using SAS statistical software version 9.3 (SAS Institute Inc., Cary, NC, USA) to reflect the complex sampling design and sampling weights of KNHANES and to provide nationally representa- tive prevalence estimates using a complex sampling design.
Differences were analyzed using chi-square tests for categori- cal variables and Student t-tests for the continuous variables.
Determinants of albuminuria were analyzed using multivari- ate logistic regression analysis. The odds ratio (OR) and 95%
confidence interval (95% CI) for the factors associated with the presence of albuminuria or CKD were calculated using multivariate logistic regression analysis. A P value <0.05 was considered statistically significant.
RESULTS
Clinical characteristics of the study population
Table 1 shows the clinical characteristics of the study popula- tion. Of the 4,652 subjects, 660 had diabetes. The mean dura- tion of diabetes was 5.1 years. Age, HbA1c level, fasting plas- ma glucose concentration, BMI, prevalence of hypertension, and prevalence of dyslipidemia were higher in the subjects with diabetes than in those without diabetes. The ACR was higher, and the GFR was lower, in patients with diabetes than in those without diabetes (geometric mean of ACR, 14.1±0.4 mg/g vs.
5.7±0.7 mg/g, P<0.0001; and GFR, 87.4±1.0 mL/min/1.73 m2 vs. 92.8±0.4 mL/min/1.73 m2, P<0.0001). Alcohol consump-
tion, smoking, and exercise status were not different between the two groups.
Table 1. Clinical characteristics of the study population ac- cording to diabetes status
Characteristic No Diabetes
(n=3,992) Diabetes
(n=660) P value
Age, yr 49.2±0.4 58.8±0.7 <0.001
Male sexa 50.1 (0.8) 57.6 (2.1) 0.002
BMI, kg/m2 23.8±0.1 25.2±0.2 <0.001
WC, cm 81.9±0.2 87.9±0.5 <0.001
SBP, mm Hg 118.3±0.4 127.1±1.0 <0.001
FPG, mg/dL 92.8±0.2 138.0±2.1 <0.001
HbA1c, % 5.5±0.0 7.3±0.1 <0.001
Total cholesterol,
mg/dL 193.5±0.7 191.3±2.0 0.299
Triglycerides,
mg/dLb 113.0 (110.1–116) 146.4 (138–155.3) <0.001
BUN, mg/dL 14.2±0.1 15.9±0.2 <0.001
Creatinine, mg/dL 0.8±0.0 0.9±0.0 <0.001
GFR, mL/min 92.8±0.4 87.4±1 <0.001
ACR, mg/gb 5.7 (5.3–6.0) 14.1 (12.1–16.6) <0.001
Duration of DM, yr - 5.1±0.3 -
New onset DMa - 37.3 (2.4) -
Medication for DMa - 56.8 (2.5) -
HTNa 27.0 (0.9) 56.5 (2.5) <0.001
Medication for
HTNa 14.5 (0.7) 45.2 (2.3) <0.001
Dyslipidemiaa 22.3 (0.8) 45.6 (2.3) <0.001 Medication for
dyslipidemiaa 3.6 (0.3) 17.6 (1.8) <0.001
CVDa 2.4 (0.2) 7.6 (1.0) <0.001
Alcohol
consumptiona 11.7 (0.7) 12.0 (1.6) 0.883
Smokinga 24.0 (0.9) 27.7 (2.1) 0.085
Exercisea 20.5 (0.8) 16.7 (2.0) 0.065
Values are presented as mean±standard error. BMI was defined as body mass (kg) divided by the square of height (m2).
BMI, body mass index; WC, waist circumference; SBP, systolic blood pressure; FPG, fasting plasma glucose; HbA1c, hemoglobin A1c;
BUN, blood urea nitrogen; GFR, glomerular filtration rate; ACR, al- bumin creatinine ratio; DM, diabetes mellitus; HTN, hypertension;
CVD, cardiovascular disease.
aValues are presented as % (standard error), bACR and triglyceride lev- els are presented as geometric mean (95% confidence interval).
Prevalence and determinants of albuminuria according to the diabetes status
Albuminuria was more prevalent in subjects with diabetes than in those without (26.7% vs. 10.2%, P<0.0001). The prevalence of microalbuminuria and macroalbuminuria was also higher in subjects with diabetes than in those without (22.0% vs. 9.4%
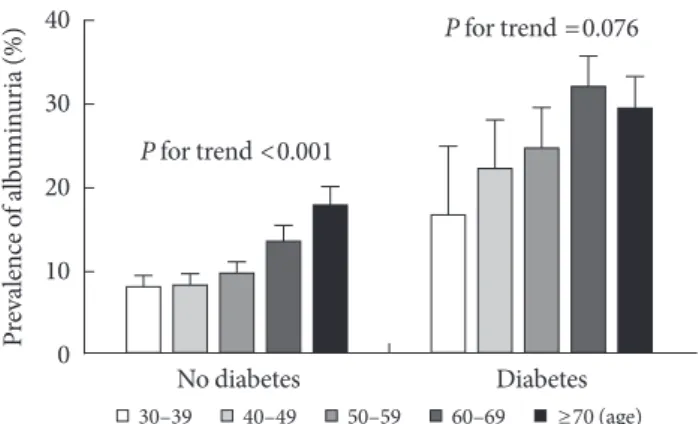
and 4.6% vs. 0.8%, respectively) (Fig. 1). There was a signifi- cant trend for increased albuminuria with increasing age in subjects without diabetes (P for trend <0.0001), whereas the trend was not statistically significant in subjects with diabetes (P for trend=0.076) (Fig. 2). Table 2 shows the clinical charac- teristics of the study population according to the status of al- buminuria and diabetes. In the group without diabetes, sub- jects with albuminuria were older and had higher BMI, waist circumference (WC), fasting plasma glucose concentration, and SBP than those without diabetes. However, in the group with diabetes, subjects with albuminuria had a higher fasting plasma glucose concentration and SBP. In multiple logistic re- gression analysis, in the nondiabetic group, BMI and SBP were independent risk factors for albuminuria, whereas, in the dia- betic group, only SBP was independently associated with albu- minuria (Table 3).
Association between glucose tolerance categories and albuminuria
In the logistic regression analysis to determine the impact of diabetes on albuminuria, subjects with diabetes had an increased risk of albuminuria, compared to those without diabetes (OR, 2.35; 95% CI, 1.78 to 3.10; P<0.0001) after adjusting for age, sex, BMI, SBP, exercise, smoking status, and alcohol consump-
tion status. When we categorized the subjects into four groups according to glucose tolerance status and duration of diabetes (normal, IFG, new onset diabetes, and known diabetes), IFG, new onset diabetes, and known diabetes were significant risk factors for albuminuria after adjusting for age and sex (Table 4). However, with further adjustment for BMI and SBP, only new onset diabetes and known diabetes were significantly as- sociated with albuminuria (Table 4).
Prevalence and determinants of CKD according to diabetes status
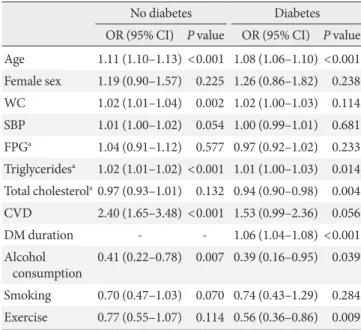
Table 5 shows the clinical characteristics of the study popula- tion according to diabetes status and CKD. Of the 21,521 sub- jects, 2,436 had diabetes. In subjects without diabetes, 1.7% had CKD with a mean GFR of 51.5±0.6 mL/min/1.73 m2. In those with diabetes, 8.6% had CKD with a mean GFR of 48.1±1.0 mL/min/1.73 m2. Subjects with diabetes had a higher stage of CKD than those without diabetes (P<0.001) (Fig. 3). In both groups, with and without diabetes, the subjects with CKD were older and had a higher fasting plasma glucose level and higher rates of hypertension, dyslipidemia, and CVD than subjects without CKD. However, the percentage of alcohol consumers, smokers, and exercisers was lower in subjects with CKD than that in subjects without CKD in both groups (Table 5). In the multivariate logistic regression analysis, age, WC, triglyceride concentration, and previous CVD events were associated with an increased risk of CKD in the group without diabetes. In the group with diabetes, age, triglyceride concentration, and dia- betes duration were risk factors for CKD. However, total cho- lesterol concentration, heavy alcohol consumption, and exer- cise were associated with a lower risk of CKD in the group with diabetes (Table 6).
Fig. 1. Distribution of the albumin creatinine ratio (ACR) ac- cording to diabetes status. aP value for the comparison of the proportion of subjects with albuminuria, compared between subjects with and without diabetes.
50 40 30 20 10 0
Percent
<1 1–10 10–30
ACR (mg/g)30–100 100–300 300≤
No diabetes Diabetes P<0.001a
Fig. 2. Prevalence of albuminuria according to age and diabe- tes status.
40 30 20 10 Prevalence of albuminuria (%) 0
No diabetes Diabetes
30–39 40–49 50–59 60–69 ≥70 (age)
P for trend <0.001
P for trend =0.076
Association between glucose tolerance categories and CKD In the logistic regression analysis to determine the impact of di- abetes on CKD, subjects with diabetes had an increased risk of CKD compared to those without diabetes (OR, 1.83; 95% CI, 1.13 to 2.96; P<0.0001) after adjusting for age, sex, BMI, SBP, exercise status, smoking status, and alcohol consumption status.
When we categorized the subjects into three groups according to glucose tolerance status and diabetes duration (normal, IFG, and diabetes), IFG and diabetes were significant risk factors for CKD after adjusting for age, sex, BMI, SBP, exercise status, smoking status, and alcohol consumption status (Table 7).
DISCUSSION
In this study, using the dataset from KNHANES, we demon- strated that the prevalences of microalbuminuria, macroalbu- minuria, and CKD were 22.0%, 4.7%, and 8.6%, respectively, in Korean subjects with diabetes, which were significantly higher than in those without diabetes. In subjects with diabe- tes, only blood pressure was significantly associated with albu- minuria, while older age, higher serum triglyceride levels, and previous CVD events were the determinants of CKD.
In the United States, a study using data from the Third Na- Table 2. Clinical characteristics of the study population according to the presence/absence of albuminuria and diabetes
Characteristic
No diabetes Diabetes
Normal
(n=3,599) Albuminuria
(n=393) P value Normal
(n=480) Albuminuria
(n=180) P value
Age, yr 48.9±0.4 52.6±1.0 <0.001 58.1±0.8 60.8±1.2 0.064
Male sexa 50.5 (0.8) 47.2 (3.8) 0.406 56.4 (2.5) 61.2 (4.6) 0.391
BMI, kg/m2 23.8±0.1 24.5±0.2 0.002 25.3±0.2 24.8±0.3 0.212
WC, cm 81.6±0.2 84.3±0.7 <0.001 88.0±0.5 87.6±1 0.714
SBP, mm Hg 117.4±0.4 126.1±1.4 <0.001 124.4±0.9 134.7±1.9 <0.001
FPG, mg/dL 92.6±0.2 94.5±0.7 0.011 135.6±2.5 144.4±3.4 0.032
HbA1c, % 5.5±0.0 5.6±0.0 0.007 7.2±0.1 7.4±0.1 0.106
Total cholesterol, mg/dL 193.2±0.7 196.6±2.3 0.148 191.0±2.3 192.1±4.0 0.806
Triglycerides, mg/dLb 112.1 (109.0–115.2) 121.5 (112.2–131.5) 0.059 146.1 (137.4–155.5) 147 (127.9–168.8) 0.941
BUN, mg/dL 14.1±0.1 14.9±0.2 0.006 15.6±0.3 16.7±0.5 0.063
Creatinine, mg/dL 0.8±0.0 0.8±0.0 0.882 0.9±0.0 0.9±0.0 0.854
GFR, mL/min/1.73 m2 92.8±0.5 92.4±1.2 0.706 87±1.1 88.5±2.2 0.551
ACR, mg/gb 4.2 (4.0–4.4) 75.8 (67.7–84.9) <0.001 6.6 (5.8–7.4) 116.9 (92.9–147.1) <0.001
Duration of DM, yr - - - 4.8±0.4 6.1±0.6 0.084
New onset DMa - - - 37.6 (2.9) 36.6 (4.4) 0.851
HTNa 24.5 (0.9) 48.8 (3.3) <0.001 53.4 (2.9) 64.8 (5.1) 0.066
Medication for HTNa 13.0 (0.7) 27.5 (2.8) <0.001 43.9 (2.5) 48.7 (5.4) 0.419
Dyslipidemiaa 21.9 (0.8) 25.7 (2.9) 0.179 44.9 (2.9) 47.3 (4.4) 0.657
Medication for dyslipidemiaa 3.6 (0.3) 3.5 (0.8) 0.855 19.1 (2.3) 13.3 (2.9) 0.142
CVDa 2.3 (0.3) 3.5 (0.9) 0.148 6.7 (1.2) 9.8 (2.7) 0.281
Alcohol consumptiona 11.6 (0.7) 12.7 (2.1) 0.571 10.5 (1.8) 16.1 (4.0) 0.190
Smokinga 23.9 (1.0) 25.1 (2.8) 0.700 27.4 (2.6) 28.5 (3.7) 0.809
Exercisea 20.6 (0.9) 20.4 (2.7) 0.957 16.4 (2.2) 17.4 (3.6) 0.790
Values are presented as mean±standard error. BMI was defined as body mass (kg) divided by the square of height (m2).
BMI, body mass index; WC, waist circumference; SBP, systolic blood pressure; FPG, fasting plasma glucose; HbA1c, hemoglobin A1c; BUN, blood urea nitrogen; GFR, glomerular filtration rate; ACR, albumin creatinine ratio; DM, diabetes mellitus; HTN, hypertension; CVD, cardio- vascular disease.
aValues are presented as % (standard error), bACR and triglyceride levels are presented as geometric mean (95% confidence interval).
tional Health and Nutrition Examination Survey (NHANES III), which was conducted between 1988 and 1994, reported that the prevalence of microalbuminuria and macroalbumin- uria was 35% and 6%, respectively, in adults with type 2 diabe- tes aged ≥40 years [19]. In 930 subjects with diabetes in the Shanghai Diabetic Complications Study, the prevalence of mi- croalbuminuria was 22.8% and that of macroalbuminuria was 3.4% [20], which were similar to those in the present study.
Few studies have evaluated the epidemiology of albuminuria in Korea. The prevalence of albuminuria was 34% (20%, mi- croalbuminuria; 14%, macroalbuminuria) in 631 Korean pa- tients with type 2 diabetes in a single hospital in 1995 [11], and
the duration of diabetes was longer than that in the present study. In a multicenter study conducted in a primary care set- ting, albuminuria was present in 29.4% (23.1%, microalbu- minuria; 6.3%, macroalbuminuria) of 3,738 patients with type 2 diabetes and hypertension [16]. Because these two studies were conducted in a hospital or primary care clinic, the preva- lence of albuminuria was higher than that in the present study.
We believe the present study to be the first to report the preva- lence of albuminuria using a nationally representative dataset in Korea, given the use of data from KHANES V, which was the first survey to measure albuminuria.
Diabetes is considered to be a key risk factor for albumin- uria. We also report here that diabetes was associated with an approximate 2.5-fold increased risk of albuminuria. There have been few previous studies investigating the association between prediabetes and albuminuria [21,22]. In our study, IFG was associated with an increased risk of albuminuria after adjust- ing for age and sex; however, the association was no longer significant after further adjustment for BMI and SBP, which are important risk factors for albuminuria. In a population- based cross-sectional study conducted with 1,791 Korean sub- jects aged >40 years in the Jungup district, the prevalence of microalbuminuria was higher in subjects with prediabetes than in those with normal glucose tolerance (11.8% vs. 6.0%, P<0.0001), and this relationship was consistent even in hyper- tensive individuals [23]. However, the authors did not adjust for other potential confounding factors for albuminuria.
In our study, only SBP was an independent risk factor for al- buminuria in subjects with diabetes. However, BMI was a sig- nificant risk factor for albuminuria in subjects without diabetes Table 3. Determinants of albuminuria according to diabetes
status
No diabetes Diabetes
OR (95% CI) P value OR (95% CI) P value Age 1.01 (1.00–1.02) 0.190 1.01 (0.99–1.04) 0.273 Male sex 0.73 (0.47–1.13) 0.157 1.31 (0.77–2.22) 0.320 BMI 1.05 (1.00–1.10) 0.042 0.97 (0.91–1.04) 0.450 SBP 1.03 (1.02–1.04) <0.001 1.03 (1.02–1.04) <0.001 HbA1c 1.20 (0.76–1.90) 0.438 1.18 (0.99–1.39) 0.059 Total cholesterola0.99 (0.96–1.03) 0.768 1.00 (0.94–1.06) 0.972 Triglyceridesa 1.00 (0.99–1.01) 0.814 1.01 (0.99–1.03) 0.391 Creatinine 0.93 (0.31–2.76) 0.895 0.82 (0.34–1.96) 0.655 Alcohol 1.02 (0.70–1.50) 0.912 1.23 (0.58–2.61) 0.588 Smoking 1.33 (0.88–2.00) 0.179 1.02 (0.55–1.88) 0.959 OR, odds ratio; CI, confidence interval; BMI, body mass index; SBP, systolic blood pressure; HbA1c, hemoglobin A1c.
aORs are expressed per 10 mg/dL difference in total cholesterol and triglyceride concentrations.
Table 4. Odds ratio for albuminuria according to the glucose tolerance categories
Model 1 Model 2 Model 3
No diabetes Reference Reference Reference IFG 1.45 (1.05–2.01) 1.22 (0.89–1.67) 1.20 (0.87–1.65) New onset DM 3.11 (2.10–4.60) 2.55 (1.71–3.81) 2.53 (1.69–3.80) Known DM 2.84 (2.03–3.97) 2.50 (1.76–3.42) 2.44 (1.75–3.41)
P for trend <0.001 <0.001 <0.001
Values are presented as the odds ratio (95% confidence interval). Mod- el 1: adjusted for age and sex; Model 2: adjusted for age, sex, body mass index (BMI), and systolic blood pressure (SBP); Model 3: adjusted for age, sex, BMI, SBP, exercise, drinking, and smoking.
IFG, impaired fasting glucose; DM, diabetes mellitus.
Fig. 3. Distribution of chronic kidney disease (CKD) stage ac- cording to diabetes status. aP value for the comparison of the proportion of subjects with CKD, compared between subjects with and without diabetes.
60 50 40 30 20 10 0
Percent
Stage 1 Stage 2 Stage 3 Stage 4 Stage 5 CKD stage
No diabetes Diabetes P<0.001a
but not in those with diabetes. The positive association between BMI or WC and albuminuria has been reported in previous epidemiological studies [24,25]. In patients with diabetes in the Look AHEAD (Action for Health in Diabetes) Study, higher BMI and abdominal obesity (determined using WC) were found to be associated with albuminuria [26], where the ma- jority of participants had a BMI ≥30 kg/m2. However, there has been some debate in this topic relating to subjects with di- abetes. Lee et al. [27] reported that metabolic syndrome was an independent risk factor for albuminuria in 642 nonhyper- tensive Korean subjects with type 2 diabetes. However, of the various components of metabolic syndrome, abdominal obe- sity was not significantly related to microalbuminuria. Went- worth et al. [28] also reported that, in people with type 2 dia-
betes, there was a weaker correlation between BMI and albu- minuria than in those without diabetes. We are not currently aware of the mechanism for this finding. BMI can be affected by diabetes treatment, the degree of hyperglycemia, and the insulin secretory capacity in diabetes. Therefore, the association between albuminuria and BMI could be attenuated by the di- verse pathophysiology related to obesity in subjects with diabe- tes. Furthermore, the lower BMI values observed in the present study, than that in studies on Caucasians, may be responsible for the lack of association between albuminuria and BMI.
Compared to previous studies with Korean patients with diabetes, which reported that male sex, poor glycemic control, high blood pressure, diabetes duration, presence of diabetic retinopathy, homocysteine levels, BMI, and fasting insulin lev- Table 5. Clinical characteristics of the study population according to chronic kidney disease and diabetes diagnoses
No diabetes Diabetes
No CKD (n=18,642) CKD (n=443) P value No CKD (n=2,185) CKD (n=251) P value
Age, yr 48.2±0.2 69.6±0.7 <0.001 57.8±0.3 68.4±0.8 <0.001
Male sexa 48.4 (0.3) 46.5 (2.8) 0.500 55.9 (1.2) 48.1 (3.7) 0.046
BMI, kg/m2 23.7±0.0 24.1±0.2 0.082 25.1±0.1 25.2±0.3 0.670
WC, cm 81.4±0.1 84.7±0.5 <0.001 87.4±0.3 88.2±0.7 0.293
SBP, mm Hg 118.4±0.2 131.7±1.3 <0.001 127.3±0.5 131.2±1.4 0.008
FPG, mg/dL 93.4±0.1 96.4±0.6 <0.001 145.8±1.2 135.2±4.1 0.014
HbA1c, % - - - 7.4±0.0 7.4±0.1 0.716
Total cholesterol, mg/dL 191±0.3 191.2±2.2 0.935 191.1±1.1 182.2±3.1 0.007
Triglyceride, mg/dLb 111.7 (110.4–113.0) 131.5 (124.7–138.5) <0.001 149.6 (144.7–154.7) 155.3(143–168.7) 0.404
BUN, mg/dL 14.2±0.0 21.8±0.7 <0.001 15.3±0.1 23.3±0.7 <0.001
Creatinine, mg/dL 0.8±0.0 1.4±0.1 <0.001 0.8±0 1.5±0.1 <0.001
GFR, mL/min/1.73 m2 93.8±0.3 51.5±0.6 <0.001 91.2±0.5 48.1±1 <0.001
Duration of DM, yr - - - 5.1±0.2 10.7±0.7 <0.001
Medication for DMa - - - 60.7 (1.3) 85.2 (2.5) <0.001
HTNa 28.0 (0.5) 71.3 (2.6) <0.001 55.6 (1.3) 83.8 (2.5) <0.001
Medication for HTNa 13.5 (0.3) 61.1 (2.8) <0.001 42.6 (1.3) 77.8 (2.9) <0.001
Dyslipidemiaa 20.7 (0.4) 33.0 (2.5) <0.001 39.9 (1.3) 46.0 (3.6) 0.107
Medication for dyslipidemiaa 3.0 (0.1) 7.7 (1.4) <0.001 14.2 (0.9) 25.3 (3.6) <0.001
CVDa 2.1 (0.1) 14.7 (2.0) <0.001 6.8 (0.6) 17.9 (2.7) <0.001
Alcohol consumptiona 10.5 (0.3) 3.2 (0.9) <0.001 12.6 (1.0) 3.0 (1.3) <0.001
Smokinga 24.7 (0.4) 12.3 (1.9) <0.001 25.3 (1.2) 15.3 (3.0) 0.007
Exercisea 23.8 (0.4) 15.0 (2.0) <0.001 22.7 (1.1) 11.7 (2.1) <0.001
Values are presented as mean±standard error. BMI was defined as body mass (kg) divided by the square of height (m2).
CKD, chronic kidney disease; BMI, body mass index; WC, waist circumference; SBP, systolic blood pressure; FPG, fasting plasma glucose; HbA1c, hemoglobin A1c; BUN, blood urea nitrogen; GFR, glomerular filtration rate; DM, diabetes mellitus; HTN, hypertension; CVD, cardiovascular disease.
aValues are presented as % (standard error), bTriglyceride levels are presented as geometric mean (95% confidence interval).
el were associated with an increased risk of microalbuminuria [11-16], blood pressure was the only significant variable in the present study, and HbA1c was only a marginally significant determinant. To clarify the causal relationship between these variables, future longitudinal studies in this population are warranted.
According to the present study conducted in Korea, the prev- alence of CKD in subjects with diabetes was 8.6%, lower than in Western populations as well as other East Asian populations [29]. In the United States, the prevalence of CKD increased from 14.9% in NHANES 1988–1994 to 17.7% in NHANES 2005–2008 in patients with diabetes [30]. The prevalence of CKD in patients with type 2 diabetes in Asia was 10.2% in China [31] and 15.3% in Japan [32]. The differences between the two countries might be explained by the different ethnici- ties and MDRD equations. Following calculation of eGFR in the present study using the different MDRD equations, the prevalence of CKD was 6.8% using the Chinese equation [31]
and 38.5% using the Japanese equation [32]. When Kang et al.
[17] defined CKD as GFR <60 mL/min/1.73 m2 or proteinuria as ≥1+ using KNHANES IV, which was used in the present study, the prevalence of CKD was 4.5% in men and 6.3% in
women among subjects with or without diabetes. However, they did not compare the prevalence of CKD by diabetes sta- tus. Therefore, this is the first study to ascertain the status of CKD in Korean subjects with diabetes on a national scale.
In this study, older age, higher serum triglyceride levels, and longer diabetes duration were associated with an increased risk of CKD, whereas serum total cholesterol level, heavy alco- hol drinking, and exercise were associated with a decreased risk of CKD in patients with diabetes. High serum triglyceride levels are considered a risk factor for diabetic nephropathy [33], and this was also true in our study. CKD induces hypertriglyc- eridemia through impaired clearance of triglyceride-rich lipo- proteins [34]. However, we found a negative association be- tween serum cholesterol and CKD, contrary to the findings of previous studies. The reason for this discrepancy is unknown.
However, higher doses of lipid lowering medication may be responsible for the lower cholesterol levels in subjects with di- abetes and CKD than that in those without CKD. In the previ- ous study using KNHANES data, regular drinking (alcohol consumption ≥1/wk) may have been partly associated with the reduced rates of CKD in men, which is consistent with our study [17]. However, there have been reports that alcohol con- sumption could be a risk factor for diabetic nephropathy. In the AusDiab study, moderate-to-high alcohol consumption contributed to the development of albuminuria [22]. Subjects with diabetes and CKD in the present study may have led a healthier lifestyle, as evidenced by lower blood glucose and lipid levels, a greater use of medications for diabetes or dyslipid- emia, and fewer smokers, although they exercised less. There- fore, the independent relationship between alcohol and CKD may be confounded by the awareness of the diabetes status in subjects with CKD, which led to a better lifestyle.
Table 6. Determinants of chronic kidney disease according to diabetes status
No diabetes Diabetes
OR (95% CI) P value OR (95% CI) P value Age 1.11 (1.10–1.13) <0.001 1.08 (1.06–1.10) <0.001 Female sex 1.19 (0.90–1.57) 0.225 1.26 (0.86–1.82) 0.238 WC 1.02 (1.01–1.04) 0.002 1.02 (1.00–1.03) 0.114 SBP 1.01 (1.00–1.02) 0.054 1.00 (0.99–1.01) 0.681 FPGa 1.04 (0.91–1.12) 0.577 0.97 (0.92–1.02) 0.233 Triglyceridesa 1.02 (1.01–1.02) <0.001 1.01 (1.00–1.03) 0.014 Total cholesterola0.97 (0.93–1.01) 0.132 0.94 (0.90–0.98) 0.004 CVD 2.40 (1.65–3.48) <0.001 1.53 (0.99–2.36) 0.056 DM duration - - 1.06 (1.04–1.08) <0.001 Alcohol
consumption 0.41 (0.22–0.78) 0.007 0.39 (0.16–0.95) 0.039 Smoking 0.70 (0.47–1.03) 0.070 0.74 (0.43–1.29) 0.284 Exercise 0.77 (0.55–1.07) 0.114 0.56 (0.36–0.86) 0.009 OR, odds ratio; CI, confidence interval; WC, waist circumference;
SBP, systolic blood pressure; FPG, fasting plasma glucose; CVD, car- diovascular disease; DM, diabetes mellitus.
aORs are expressed per 10 mg/dL difference in FPG, triglycerides, and total cholesterol.
Table 7. Odds ratio for chronic kidney disease according to the glucose tolerance categories
Model 1 Model 2 Model 3
No diabetes Reference Reference Reference IFG 1.93 (1.37–2.72) 1.67 (1.17–2.38) 1.72 (1.21–2.47) DM 2.74 (1.75–4.31) 2.19 (1.31–3.67) 2.13 (1.29–3.53)
P for trend <0.001 <0.001 <0.001
Values are presented as the odds ratio (95% confidence interval).
Model 1: adjusted for age and sex; Model 2: adjusted for age, sex, body mass index (BMI), and systolic blood pressure (SBP); Model 3:
adjusted for age, sex, BMI, SBP, exercise, drinking, and smoking.
IFG, impaired fasting glucose; DM, diabetes mellitus.
Our study has some limitations. The cross-sectional design limits inferences about causality. Second, we could not exclude patients with conditions that could elevate urinary albumin excretion, such as hematuria, pregnancy, urinary tract infec- tion, or other febrile illness, and we could not repeat the ran- dom urine sampling for the determination of albuminuria. In- stead, the ACR measurement was based on a single random urine sample, not the first morning voided urine. Moreover, the epidemiology of diabetic nephropathy in type 1 diabetes differs from that of type 2 diabetes [35]; however, we could not determine the type of diabetes in our study. Last, we used the KNHANES IV–V dataset from 2008 to 2011 for the assess- ment of CKD prevalence to obtain a sufficient number of sub- jects with diabetes and CKD. However, HbA1c was not mea- sured in all participants in KNHANES from 2007 to 2010;
therefore, the prevalence of diabetes could be underestimated.
Despite these potential limitations, this study has several strengths; for example, the data were based on a nationally representative population, and we adjusted for multiple risk factors in order to evaluate the determinants of diabetic ne- phropathy.
In conclusion, Korean subjects with diabetes had a higher prevalence of albuminuria and CKD than those without dia- betes. In subjects with diabetes, blood pressure was significant- ly associated with an increased risk of albuminuria, and older age, higher serum triglyceride levels, and a longer diabetes du- ration were determinants of CKD. To investigate the causal re- lationship between the risk factors and the development of al- buminuria and CKD, future longitudinal follow-up studies are warranted.
CONFLICTS OF INTEREST
No potential conflict of interest relevant to this article was re- ported.
REFERENCES
1. Kidney Disease Improving Global Outcomes. KDIGO 2012 clinical practice guideline for the evaluation and management of chronic kidney disease. Chapter 1: definition and classifica- tion of CKD. Kidney Int Suppl 2013;3:19-62.
2. Valmadrid CT, Klein R, Moss SE, Klein BE. The risk of cardio- vascular disease mortality associated with microalbuminuria and gross proteinuria in persons with older-onset diabetes
mellitus. Arch Intern Med 2000;160:1093-100.
3. Gerstein HC, Mann JF, Yi Q, Zinman B, Dinneen SF, Hoogw- erf B, Halle JP, Young J, Rashkow A, Joyce C, Nawaz S, Yusuf S;
HOPE Study Investigators. Albuminuria and risk of cardiovas- cular events, death, and heart failure in diabetic and nondiabet- ic individuals. JAMA 2001;286:421-6.
4. de Boer IH, Katz R, Cao JJ, Fried LF, Kestenbaum B, Mukamal K, Rifkin DE, Sarnak MJ, Shlipak MG, Siscovick DS. Cystatin C, albuminuria, and mortality among older adults with diabe- tes. Diabetes Care 2009;32:1833-8.
5. Viberti GC, Hill RD, Jarrett RJ, Argyropoulos A, Mahmud U, Keen H. Microalbuminuria as a predictor of clinical nephrop- athy in insulin-dependent diabetes mellitus. Lancet 1982;1:
1430-2.
6. Eknoyan G, Hostetter T, Bakris GL, Hebert L, Levey AS, Parv- ing HH, Steffes MW, Toto R. Proteinuria and other markers of chronic kidney disease: a position statement of the national kidney foundation (NKF) and the national institute of diabetes and digestive and kidney diseases (NIDDK). Am J Kidney Dis 2003;42:617-22.
7. Young BA, Katon WJ, Von Korff M, Simon GE, Lin EH, Ciech- anowski PS, Bush T, Oliver M, Ludman EJ, Boyko EJ. Racial and ethnic differences in microalbuminuria prevalence in a diabetes population: the pathways study. J Am Soc Nephrol 2005;16:219-28.
8. Parving HH, Lewis JB, Ravid M, Remuzzi G, Hunsicker LG;
DEMAND investigators. Prevalence and risk factors for mi- croalbuminuria in a referred cohort of type II diabetic patients:
a global perspective. Kidney Int 2006;69:2057-63.
9. Buck K, Feehally J. Diabetes and renal failure in Indo-Asians in the UK: a paradigm for the study of disease susceptibility.
Nephrol Dial Transplant 1997;12:1555-7.
10. Hallan SI, Coresh J, Astor BC, Asberg A, Powe NR, Romunds- tad S, Hallan HA, Lydersen S, Holmen J. International com- parison of the relationship of chronic kidney disease prevalence and ESRD risk. J Am Soc Nephrol 2006;17:2275-84.
11. Lee KU, Park JY, Kim SW, Lee MH, Kim GS, Park SK, Park JS.
Prevalence and associated features of albuminuria in Koreans with NIDDM. Diabetes Care 1995;18:793-9.
12. Park JY, Kim HK, Chung YE, Kim SW, Hong SK, Lee KU. Inci- dence and determinants of microalbuminuria in Koreans with type 2 diabetes. Diabetes Care 1998;21:530-4.
13. Kim ER, Sung KC, Chon CU, Kwon CH, Koh YL, Lee HJ, Park SK, Lee DY, Yun JH, Kim BJ, Kim BS, Kang JH, Lee MH, Park JR, Ryu SH. Prevalence and clinical characteristics of microal-
buminuria in Koreans: a population-based cross-sectional study.
Korean J Med 2006;70:617-26.
14. Kim DJ, Ryu SJ, Seo YJ, Kim NH, Chung HS, Eun CR, Choi HJ, Kim HS, Yang SJ, Park J, Yoo HJ, Park SY, Lee YJ, Ryu OH, Lee KW, Kim HY, Seo JA, Kim SG, Kim NH, Choi KM, Baik SH, Choi DS. The prevalence of microalbuminuria and associated factors in newly diagnosed type 2 diabetes mellitus in Korea.
Korean J Med 2007;73:503-11.
15. Cho EH, Kim EH, Kim WG, Jeong EH, Koh EH, Lee WJ, Kim MS, Park JY, Lee KU. Homocysteine as a risk factor for devel- opment of microalbuminuria in type 2 diabetes. Korean Dia- betes J 2010;34:200-6.
16. Yang CW, Park JT, Kim YS, Kim YL, Lee YS, Oh YS, Kang SW.
Prevalence of diabetic nephropathy in primary care type 2 dia- betic patients with hypertension: data from the Korean Epide- miology Study on Hypertension III (KEY III study). Nephrol Dial Transplant 2011;26:3249-55.
17. Kang HT, Lee J, Linton JA, Park BJ, Lee YJ. Trends in the prev- alence of chronic kidney disease in Korean adults: the Korean National Health and Nutrition Examination Survey from 1998 to 2009. Nephrol Dial Transplant 2013;28:927-36.
18. Levey AS, Bosch JP, Lewis JB, Greene T, Rogers N, Roth D. A more accurate method to estimate glomerular filtration rate from serum creatinine: a new prediction equation. Modifica- tion of Diet in Renal Disease Study Group. Ann Intern Med 1999;130:461-70.
19. Kramer HJ, Nguyen QD, Curhan G, Hsu CY. Renal insuffi- ciency in the absence of albuminuria and retinopathy among adults with type 2 diabetes mellitus. JAMA 2003;289:3273-7.
20. Jia W, Gao X, Pang C, Hou X, Bao Y, Liu W, Wang W, Zuo Y, Gu H, Xiang K. Prevalence and risk factors of albuminuria and chronic kidney disease in Chinese population with type 2 dia- betes and impaired glucose regulation: Shanghai diabetic com- plications study (SHDCS). Nephrol Dial Transplant 2009;24:
3724-31.
21. Nelson RG, Kunzelman CL, Pettitt DJ, Saad MF, Bennett PH, Knowler WC. Albuminuria in type 2 (non-insulin-dependent) diabetes mellitus and impaired glucose tolerance in Pima Indi- ans. Diabetologia 1989;32:870-6.
22. Tapp RJ, Shaw JE, Zimmet PZ, Balkau B, Chadban SJ, Tonkin AM, Welborn TA, Atkins RC. Albuminuria is evident in the early stages of diabetes onset: results from the Australian Dia- betes, Obesity, and Lifestyle Study (AusDiab). Am J Kidney Dis 2004;44:792-8.
23. Kim YI, Chung YE, Kim JY, Kim SW, Kim ES, Lee MS, Park
JY, Hong SK, Lee KU. Microalbuminuria in diabetic and non- diabetic subjects: a population based study. J Korean Diabetes Assoc 1999;23:79-86.
24. Bonnet F, Marre M, Halimi JM, Stengel B, Lange C, Laville M, Tichet J, Balkau B; DESIR Study Group. Waist circumference and the metabolic syndrome predict the development of ele- vated albuminuria in non-diabetic subjects: the DESIR Study. J Hypertens 2006;24:1157-63.
25. Chandie Shaw PK, Berger SP, Mallat M, Frolich M, Dekker FW, Rabelink TJ. Central obesity is an independent risk factor for albuminuria in nondiabetic South Asian subjects. Diabetes Care 2007;30:1840-4.
26. Kramer H, Reboussin D, Bertoni AG, Marcovina S, Lipkin E, Greenway FL 3rd, Brancati FL; Look Ahead Research Group.
Obesity and albuminuria among adults with type 2 diabetes:
the Look AHEAD (Action for Health in Diabetes) Study. Dia- betes Care 2009;32:851-3.
27. Lee JE, Huh W, Son HJ, Kim YG, Kim DJ, Lee MK, Oh HY. As- sociation of metabolic syndrome with microalbuminuria in non-hypertensive type 2 diabetic patients. Nephron Clin Pract 2007;106:c98-103.
28. Wentworth JM, Fourlanos S, Colman PG. Body mass index correlates with ischemic heart disease and albuminuria in long- standing type 2 diabetes. Diabetes Res Clin Pract 2012;97:57-62.
29. Lee SW, Kim YC, Oh SW, Koo HS, Na KY, Chae DW, Kim S, Chin HJ. Trends in the prevalence of chronic kidney disease, other chronic diseases and health-related behaviors in an adult Korean population: data from the Korean National Health and Nutrition Examination Survey (KNHANES). Nephrol Dial Transplant 2011;26:3975-80.
30. de Boer IH, Rue TC, Hall YN, Heagerty PJ, Weiss NS, Him- melfarb J. Temporal trends in the prevalence of diabetic kidney disease in the United States. JAMA 2011;305:2532-9.
31. Chen W, Chen W, Wang H, Dong X, Liu Q, Mao H, Tan J, Lin J, Zhou F, Luo N, He H, Johnson RJ, Zhou SF, Yu X. Prevalence and risk factors associated with chronic kidney disease in an adult population from southern China. Nephrol Dial Trans- plant 2009;24:1205-12.
32. Yokoyama H, Sone H, Oishi M, Kawai K, Fukumoto Y, Ko- bayashi M; Japan Diabetes Clinical Data Management Study Group. Prevalence of albuminuria and renal insufficiency and associated clinical factors in type 2 diabetes: the Japan Diabe- tes Clinical Data Management study (JDDM15). Nephrol Dial Transplant 2009;24:1212-9.
33. Mulec H, Johnsen SA, Wiklund O, Bjorck S. Cholesterol: a re-
nal risk factor in diabetic nephropathy? Am J Kidney Dis 1993;
22:196-201.
34. Vaziri ND, Moradi H. Mechanisms of dyslipidemia of chronic
renal failure. Hemodial Int 2006;10:1-7.
35. Reutens AT. Epidemiology of diabetic kidney disease. Med Clin North Am 2013; 97:1-18.