482
Open Access
Ambulatory Blood Pressure Monitoring and Blood Pressure Load in Obese Children
Yu Kyung Kim, MD1, Hee Un Kim, MD1 and Jin Young Song, MD2
1Department of Pediatrics, Sunlin Hospital, Pohang, 2Department of Pediatrics, Sejong Hospital, Bucheon, Korea
ABSTRACT
Background and Objectives: This study was aimed at evaluating the significance of blood pressure (BP) load in ambulatory blood pressure monitoring (ABPM) in obese children and adolescents. Subjects and Methods: ABPM was conducted for 60 selected patients who had visited Sunlin Hospital between January 2008 and August 2008.
Patients were classified into 3 groups; an obese group whose body mass index (BMI) was > the 95th percentile, an overweight group whose BMI was > the 85th percentile but less than the 95th percentile, and a normal group whose BMI was below the 85th percentile. Overall mean BP, day and night BP and BP load were measured by ABPM. Results: Of the 60 patients, twenty-seven children belonged to the obese group, 9 and 24 to the over- weight and the normal group, respectively. Among the three groups, the overall average systolic and diastolic BP, daytime diastolic BP, and systolic BP loads in daytime and nighttime were statistically different. Comparing the obese group with the normal group, systolic BP loads in daytime and nighttime in the obese group were signifi- cantly higher than those in the normal group. Also, the obese group had more patients whose BP loads were over 25% greater than the normal group while the difference in the number of patients with overall hypertension was not significantly different. Conclusion: Assessment of children’s BP through assessment of BP load is a more de- tailed and precise tool than assessment through mean BP using ABPM and BP can be better controlled using mea- surement of BP load. (Korean Circ J 2009;39:482-487)
KEY WORDS: Ambulatory blood pressure monitoring; Obesity; Hypertension; Children.
Introduction
A survey of the prevalence of obesity among child- ren and adolescents conducted in Korea in 2005, re- ported that 9.7% of subjects were obese; prevalence rose to 19.0% when overweight children were included.1) Although the rate in Korea was lower than the 17.1%
rate for the prevalence of obese children and adoles- cents in the U.S. examined between 2003 and 2004, there was a tendency towards an increase in both countries.2)3)
Obesity in childhood leads to various problems in adulthood including cardiovascular diseases such as hypertension, and their death rate is high.4-8) In addit- ion, the blood pressure (BP) of children was reported to increase with a higher body mass index (BMI),9) so the management of obesity in childhood is a critical factor for the management of BP in adults.
Manual measurements of BP have been used previ- ously, but they have the disadvantage of not checking the BP continuously. Ambulatory blood pressure mo- nitoring (ABPM) allows the acquisition of more accu- rate and more physiological results by considering daily changes; and its usage for childhood obesity has been reported.10-12) However, standards have not been esta- blished, so medical staffs hesitate to use it.13)
Accordingly, our study used 24 hour ABPM to inves- tigate differences in BP between obese and normal child- ren and adolescents. In particular, we tried to determine characteristics of BP load, one of the key contributing factors to ABPM, the meaning of which in children and adolescents is not clear.
Received: February 10, 2009 Revision Received: April 2, 2009 Accepted: May 1, 2009
Correspondence: Jin Young Song, MD,Department of Pediatrics, Sejong Hospital, 91-121 Sosabon-dong, Sosa-gu, Bucheon 422-711, Korea Tel: 82-32-340-1114, Fax: 82-32-349-3005
E-mail: [email protected] ○
○cc This is an Open Access article distributed under the terms of the Creative Commons Attribution Non-Commercial License (http://creativecommons.
org/licenses/by-nc/3.0) which permits unrestricted non-commercial use, distribution, and reproduction in any medium, provided the original work is properly cited.
Subjects and Methods
We recruited 60 children who had visited the de- partment of pediatrics of Sunlin hospital, Pohang be- tween 1 January and 31 August, 2008 and underwent ABPM.
Subjects were divided into three groups according to their BMI. Based on the BMI distribution of Korean children as documented by the Korean Pediatric Society and Korea Centers for Disease Control and Prevention in 2007,14) BMIs of the obese, overweight and normal groups were, respectively, 95th percentile, 85th to 95th percentile, and less than 85th percentile.
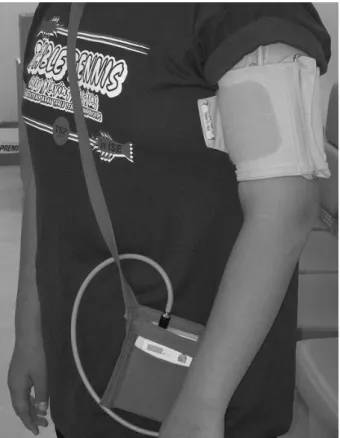
ABPM was performed with BP one (ET-med, Vignate, Italy) and BP was measured automatically by using an oscillometric method every 15 minutes during the day- time and every 30 minutes at night. Daytime and night- time was determined individually for each subject by considering their daily life, so a different nighttime was used for each patient. The cuff was set on the left bra- chium of the subjects and covered 2/3 of the brachial length (Fig. 1). When, in a few cases, the cuff was dif- ferent than the brachium of a child, one level higher cuff was then used, and such cuffs were not >50% of the brachial length.
Hypertension was diagnosed when the average over- all systolic or diastolic pressure from ABPM was > the 95th percentile of the normal BP of Korean children as
established in 2007.15) BP load for daytime and night- time were calculated as a percentage of the frequency with which it exceeded the upper level of the normal range during each time bin to the total frequency dur- ing measurement of BP for the same time. Although this study used standard BP values without adjusting for daytime, an adjustment of reducing by 10% of the stan- dard was used for the nighttime with considering a nor- mal decrease of BP while sleeping. To evaluate confid- ence of the examination, a successful measurement rate was calculated with a percentage of the frequency of succeeding in measuring BP.
Moreover, all subjects participating in this study un- derwent cardiac ultrasonography as well as an examin- ation for the degree of obesity. Based on such results, cases that appeared to have secondary hypertension, such as renovascular hypertension or hypertension re- lated to coarctation of aorta, were excluded.
For statistical analysis we used one way analysis of variance (ANOVA), the chi-square test and the Mann- Whitney test. All tests were performed using Statistical Package for Social Science (SPSS) 11.5 and a p less than 0.05, was considered to be significant.
Results
The age and the BMI of the total group of subjects were 13.47±2.99 years (7-18 years) and 23.5±5.3 kg/m2 (17-39 kg/m2) respectively (Table 1); the mean successful measurement rate was 76.3% (42-100%).
Subjects were divided into an obese group (27 child- ren, male/female:3/14), an overweight group (9 child- ren, male/female:7/2) and a normal group (24 child- ren, male/female:14/10) (Table 1); their average ages were, respectively, 12.33±3.13, 13.44±1.74 and 14.75
±2.75 years. When the ages of subjects were classified into three groups (less than 10 years; 10 to 15; and more than 15 years), the three groups showed a statistically significant difference (p=0.014) in age distribution. In the obese and overweight groups, the number of sub- jects aged 10 to 15 years was highest (63.0%, 77.8%); in the normal group, subjects over 15 years of age acco- unted for the largest part of the group (58.3%) (Table 2).
The overall systolic pressure values of the three groups were, respectively, 112.22±7.66 mmHg, 106.11±5.26 mmHg and 107.83±7.92 mmHg; diastolic pressures were 72.30±7.22 mmHg, 64.67±4.53 mmHg and
Table 1. BMI in each group (kg/m2)
Group Total M/F Mean SD Min Max
1 27 13/14 27.52 4.14 22 39
2 09 7/2 23.56 1.24 22 26
3 24 10/14 18.92 3.44 17 24
Group 1: obese group, Group 2: overweight group, Group 3: nor- mal group, BMI: body mass index, SD: standard deviation, Min:
minimum, Max: maximum Fig. 1. A picture of an obese child who is undergoing ambulatory
blood pressure monitoring.
70.13±6.50 mmHg (Table 3). There was a significant difference between the three groups in systolic (p=
0.044) and diastolic (p=0.015) pressures. However, when the overweight group, which had a small number of subjects, was excluded, the difference between the obese group and the normal group was significant only for average systolic pressure (p<0.05). The average systolic pressures during the daytime were 115.15±8.16 mmHg, 110.22±6.16 mmHg and 111.33±7.78 mmHg, respec- tively; the diastolic pressures during the daytime were 78.48±8.70 mmHg, 70.67±5.96 mmHg and 75.21±
7.24 mmHg (Table 4). Although diastolic pressures show- ed a significant difference among the three groups (p=
0.034), it was not significantly different between obese and normal groups.
Last, systolic pressures during the nighttime were 106.30±9.60 mmHg, 100.22±6.28 mmHg and 102.13
±9.39 mmHg, respectively; diastolic pressures during the night were 61.59±8.71 mmHg, 56.44±5.50 mmHg and 61.38±7.88 mmHg, respectively, in the obese, over- weight and normal groups. There was no significant dif- ference among the three groups. The decrease in systo- lic pressure during the nighttime also did not show a significant difference among the three groups: values were 7.13±6.47%, 10.29±5.53% and 7.91±6.23% in
the obese, overweight and normal groups, respectively (p=0.510) (Table 5).
For overall BP load of the three groups, the obese, overweight and normal groups showed values of 14.38
±15.10%, 4.78±5.17% and 7.05±11.53%, respectively.
For systolic pressure, there was no significant difference
Table 3. Overall BP and BP load in the study groups
Group Mean SD p
Overall systolic BP (mmHg) 0.044
1 112.22 07.66
2 106.11 05.26
3 107.83 07.92
Overall diastolic BP (mmHg) 0.015
1 072.30 07.22
2 064.67 04.53
3 070.13 06.50
Overall systolic BP load (%) 0.063
1 014.38 15.10
2 004.78 05.17
3 007.05 11.53
Overall diastolic BP load (%) 0.044
1 038.50 19.08
2 022.22 10.85
3 028.26 20.08
Group 1: obese group, Group 2: overweight group, Group 3: nor- mal group, BP: blood pressure, SD: standard deviation, Min: mi- nimum, Max: maximum
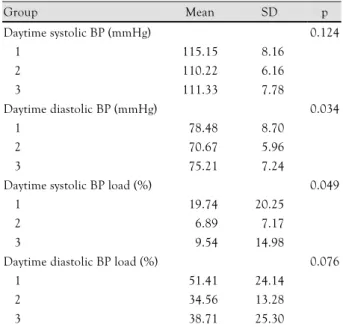
Table 4. Daytime BP and BP load in the study groups
Group Mean SD p
Daytime systolic BP (mmHg) 0.124
1 115.15 08.16
2 110.22 06.16
3 111.33 07.78
Daytime diastolic BP (mmHg) 0.034
1 078.48 08.70
2 070.67 05.96
3 075.21 07.24
Daytime systolic BP load (%) 0.049
1 019.74 20.25
2 006.89 07.17
3 009.54 14.98
Daytime diastolic BP load (%) 0.076
1 051.41 24.14
2 034.56 13.28
3 038.71 25.30
Group 1: obese group, Group 2: overweight group, Group 3: nor- mal group, BP: blood pressure, SD: standard deviation, Min: mi- nimum, Max: maximum
Table 2. Age distribution in each BMI group
Group <10 years (%) 10-15 years (%) >15 years (%)
1 5 (18.5) 17 (63.0) 05 (18.5)
2 0 (0.0)0 07 (77.8) 02 (22.2)
3 1 (4.2)0 09 (37.5) 14 (58.3)
Group 1: obese group, Group 2: overweight group, Group 3: nor- mal group, BMI: body mass index
Table 5. Nighttime BP, BP load and systolic BP reduction in the study groups
Group Mean SD p
Nighttime systolic BP (mmHg) 0.131
1 106.30 09.60
2 100.22 06.28
3 102.13 09.39
Nighttime diastolic BP (mmHg) 0.226
1 061.59 08.71
2 056.44 05.50
3 061.38 07.88
Nighttime systolic BP load (%) 0.035
1 020.38 26.95
2 002.56 05.22
3 008.13 13.93
Nighttime diastolic BP load (%) 0.218
1 030.04 25.25
2 014.56 13.65
3 030.91 27.33
Nighttime systolic BP reduction (%) 0.510
1 007.13 06.47
2 010.29 05.53
3 007.91 06.23
Group 1: obese group, Group 2: overweight group, Group 3: nor- mal group, BP: blood pressure, SD: standard deviation, Min: mi- nimum, Max: maximum
among the three groups (p=0.063) (Table 3). However, when systolic and diastolic BP loads were examined by dividing into the daytime and the nighttime, a signifi- cant difference was observed: the systolic BP loads dur- ing the daytime were, respectively, 19.74±20.25%, 6.89
±7.17% and 9.54±14.98% (p=0.049) and the systo- lic BP loads during the nighttime were 20.38±26.95%, 2.56±5.22% and 8.13±13.93% (p=0.035) (Table 4 and 5). In addition, when the systolic BP loads of the obese group and the normal group were compared by ex- cluding the overweight group, p for daytime and night- time were 0.045 and 0.042, respectively, which meant that the obese group had a significantly higher BP load than the normal group.
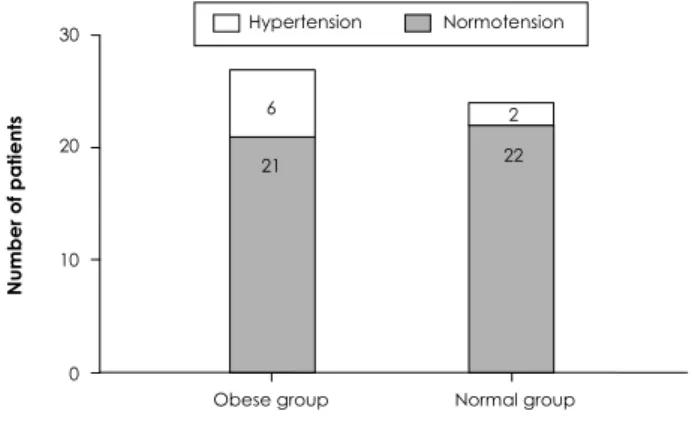
But, this result came from a comparison between BP and BP load, and an examination of overall BPs showed that 6 (22.2%), 0 (0%) and 2 (8.3%) children were con- sidered to have hypertension in the obese, overweight and normal groups, respectively. There was no signifi- cant difference between the obese group and the nor- mal group (p=0.173) (Fig. 2). In the meantime, when the BP load for systolic pressure during the daytime was
investigated, subjects with over a 25% increase in BP load included 10 (37.0%), 0 (0%) and 3 (12.5%) child- ren in the obese, the overweight and the normal groups, respectively; and a comparison between the normal group and the obese group showed a significant difference (p
=0.045) (Fig. 3). However, patients with a BP load that was 25% greater during the nighttime included 7 and 4 patients in the obese group and the normal group, respectively, and the difference was not significant (p=
0.425).
As a result, the obese group showed a significantly higher level compared to the normal group only for overall systolic pressure. BP load of the obese group was significantly higher in both daytime and nighttime. In addition, when standards for hypertension were used, no significant difference in the number of hyperten- sion patients was observed in the obese group and the normal group. When a systolic BP load over 25% was utilized as a meaningful standard, the obese group was found to have significantly more such patients than the normal group.
Discussion
Twenty four hour ABPM is generally considered to be better than common BP measurements for cases of suspected white coat hypertension, hypertension not res- ponding to drugs, and orthostatic hypotension,10)16)17) but its meaning for children has not been clearly de- termined. One of the reasons for that is the difficulty in diagnosis of hypertension for children because their normal values are not confirmed and diagnostic stan- dards are not established.
The prevalence of hypertension in children and ado- lescents has been reported to be 2-5%.18)19) Although children are known to experience secondary hyperten- sion more, their rates of essential hypertension, which appear to be related to a current increase in obesity, be- comes a serious issue. In addition, while an ordinary BP measurement of an obese child may be normal, ABPM can detect hypertension in some of these cases, and such cases are said to constitute masked hypertension. Mask- ed hypertension is reported with a considerable fre- quency (7.5%) in children and adolescents.20) That rate is considered to be closely related to damage to a target organ.20-22) Therefore, the use of 24-hour ABPM should increase, and studies on it should be actively conducted in the future.
One of the most difficult issues in this study was to settle on standards of BP. Although a standard table for growth and BP of children and adolescents was report- ed in Korea in 2007,15) it measured ordinary BP, so com- paring it with BP measured with 24-hour ABPM could lead to an excessive rate of diagnosis as Diaz et al.23) said. In addition, a study examined BP of 1,141 normal
Number of patients
30
20
10
0
6
21
2 22
Obese group Normal group BMI
Hypertension Normotension
Fig. 2. Difference in the number of patients with overall hyper- tension between obese and normal groups (p>0.05). BP: blood pressure, BMI: body mass index.
Number of patients
30
20
10
0
Obese group Normal group BMI
Daytime BP load
>25% <25%
Fig. 3. Differences in the number of patients whose daytime BP load was over 25% between obese group and normal groups (p<0.05). BP: blood pressure, BMI: body mass index.
10
17
3 21
children and adolescents with ABPM24); but it is hard used this as an appropriate standard for Korean child- ren and adolescents because it was reported in 1997 and the race of the subjects was not Korean. Therefore, the current authors thought that using normal ranges reported in Korea was better even though they were or- dinary BPs. By considering the decrease in BP while sleeping, a range for nighttime pressures was created by reducing the reported range by 10%.23) Although these standards can not be an absolute definition for diag- nosis, even arbitrary standards were thought to be use- ful investigating difference in BP between obese and normal groups and to determine the meaning of a spe- cific index of ABPM by applying it to both of the two groups. However, the normal ranges of BPs according to age and gender for Korean children and adolescents should be studied and established soon.
Like previous investigations, this study also found that overall systolic pressure was higher in the obese group than in the normal group.11) But, while the pre- vious study measured ordinary BP first and then, if necessary, gauged ABPM, our study performed ABPM in all risk groups without measuring ordinary BP (we did this to detect masked hypertension observed in obese children and adolescents).
Compared to average BP, BP load means the per- centage of the frequency of measured BPs meeting the standard for hypertension, and it was a characteristic index of ABPM. Although its meaning was not deter- mined specifically, in adults with hypertension it was reported to be more closely related to cardiac function or left ventricular hypertrophy than to average BP.25-27) However, there has been no accurate standards for children established, and only some researchers sug- gested BP load over 25%, 35% and 50% as the cutoff value.23) Our study conducted analyses using 25%28) because it is the minimal level showing a difference to increase sensitivity with the standard for BP load. That was also done because the authors observed that a lo- wer frequency led to the disappearance of a statistical difference between the obese group and the normal group when the standard of abnormality of BP load was 35%.
The authors decided to analyze BPs for daytime and nighttime separately to produce more accurate results, and we used a 10% decrease in BP as a standard for the nighttime. As expected, the obese group showed an ab- solutely higher average BP and higher BP load. How- ever, statistical significance was found to be more robust for BP load. Although there were no accurate standards for diagnosis of hypertension, the number of patients considered to have hypertension using average BPs in the obese group was not significantly different with that in the normal group, and the number of patients with over 25% of systolic BP load in the daytime was signi-
ficantly higher in the obese group than in the normal group. This result suggested that BP load should be considered in diagnosis of hypertension through ABPM.
In addition, the decreased BP during the nighttime observed frequently in ABPM was usually examined with systolic pressure. Although a decrease of over 10% was considered to be normal, standards and explanation for children were not determined yet. Our study found that there was no significant difference among the three groups and patients with less than 10% of the decrease were observed even in the normal group. So, we did not analyze it in more detail. Last, one of the critical factors for ABPM is confidence in the test. As impor- tant factors, a method measuring BP and the choice of equipment should be considered. This study excluded one case with around 20% of the successful measure- ment rate.
One of the most serious limitations of this study is that it could not use any absolute standard for diag- nosis of hypertension. The results measured in this study were less representative of because it did not com- pare and analyze data for many subjects. Actually, obese children increased but evaluation of their risk of hy- pertension was hard to do. Therefore, more active ev- aluation and management were thought to be neces- sary. The authors will examine development of essential hypertension of the subjects in a future study based on the results of this study through follow-up, and they will look for significant difference among subjects with different types of damage to target organs by supplement- ing this study more.
REFERENCES
1) Oh KY, Jang MJ, Lee NY, et al. Prevalence and trends on obe- sity among Korean children and adolescents in 1997 and 2005.
Korean J Pediatr 2008;51:950-5.
2) Ogden CL, Flegal KM, Carroll MD, Johnson CL. Prevalence and trends in overweight among US children and adolescents, 1999-2000. JAMA 2002;288:1728-32.
3) Ogden CL, Carroll MD, Curtin LR, McDowell MA, Tabak CJ, Flegal KM. Prevalence of overweight and obesity in the United States, 1999-2004. JAMA 2006;295:1549-55.
4) Lauer RM, Burns TL, Clarke WR, Mahoney LT. Childhood pre- dictors of future blood pressure. Hypertension 1991;18(3 Sup- pl):I74-81.
5) Chu NF, Rimm EB, Wang DJ, Liou HS, Shieh SM. Clustering of cardiovascular disease risk factors among obese schoolchildren:
the Taipei Children Heart Study. Am J Clin Nutr 1998;67:1141-6.
6) Must A, Jacques PF, Dallal GE, Bajema CJ, Dietz WH. Long- term morbidity and mortality of overweight adolescents: a fol- low-up of the Harvard Growth Study of 1922 to 1935. N Engl J Med 1992;327:1350-5.
7) Gunnell DJ, Frankel SJ, Nanchahal K, Peters TJ, Davey Smith G.
Childhood obesity and adult cardiovascular mortality: a 57-y follow-up study based on the Boyd Orr cohort. Am J Clin Nutr 1998;67:1111-8.
8) Park CG. Obesity and cardiovascular disease. Korean Circ J 1997;27:130-4.
9) He Q, Ding ZY, Fong DY, Karlberg J. Blood pressure is associat- ed with body mass index in both normal and obese children. Hy- pertension 2000;36:165-70.
10) Pickering TG, Shimbo D, Haas D. Ambulatory blood-pressure monitoring. N Engl J Med 2006;354:2368-74.
11) Kim MJ, Song JY. The utility of ambulatory blood pressure mo- nitoring in obese children. Korean J Pediatr 2008;51:604-9.
12) Sorof JM, Portman RJ. Ambulatory blood pressure measurements.
Curr Opin Pediatr 2001;13:133-7.
13) O’Shea JC, Califf RM. 24-hour ambulatory blood pressure mo- nitoring. Am Heart J 2006;151:962-8.
14) Moon JS, Lee SY, Nam CM, et al. 2007 Korean National Growth Charts: review of developmental process and an outlook. Korean J Pediatr 2008;51:1-25.
15) Lee CG, Moon JS, Choi JM, et al. Normative blood pressure re- ferences for Korean children and adolescents. Korean J Pediatr 2008;51:33-41.
16) Kim CH. Ambulatory blood pressure monitoring. Korean Circ J 1997;27:1218-21.
17) Lee KH, Shin GJ, Cho HK. The correlation between LVH, LV function and 24-hour ambulatory blood pressure monitoring in patients with newly diagnosed hypertension. Korean Circ J 1997;
27:712-20.
18) Hansen ML, Gunn PW, Kaelber DC. Underdiagnosis of hyper- tension in children and adolescents. JAMA 2007;298:874-9.
19) Sorof JM, Lai D, Turner J, Poffenbarger T, Portman RJ. Over- weight, ethnicity, and the prevalence of hypertension in school- aged children. Pediatrics 2004;113:475-82.
20) Lurbe E, Torro I, Alvarez V, et al. Prevalence, persistence, and cli-
nical significance of masked hypertension in youth. Hyperten- sion 2005;45:493-8.
21) Stabouli S, Kotsis V, Toumanidis S, Papamichael C, Constanto- poulos A, Zakopoulos N. White-coat and masked hypertension in children: association with target-organ damage. Pediatr Nephrol 2005;20:1151-5.
22) Maggio AB, Aggoun Y, Marchand LM, et al. Associations among obesity, blood pressure, and left ventricular mass. J Pediatr 2008;152:489-93.
23) Diaz LN, Garin EH. Comparison of ambulatory blood pressure and Task Force criteria to identify pediatric hypertension. Pe- diatr Nephrol 2007;22:554-8.
24) Soergel M, Kirschtein M, Busch C, et al. Oscillometric twenty- four-hour ambulatory blood pressure values in healthy children and adolescents: a multicenter trial including 1141 subjects. J Pediatr 1997;130:178-84.
25) Grossman E, Alster Y, Shemesh J, Nussinovitch N, Rosenthal T.
Left ventricular mass in hypertension: correlation with casual, exercise and ambulatory blood pressure. J Hum Hypertens 1994;
8:741-6.
26) White WB, Dey HM, Schulman P. Assessment of the daily blood pressure load as a determinant of cardiac function in patients with mild-to-moderate hypertension. Am Heart J 1989;118:782-95.
27) Tsioufis C, Stefanadis C, Goumas G, Pitsavos C, Toutouzas P.
Relation of ambulatory blood pressure load with left ventricular geometry in untreated patients with mild-to-moderate hyperten- sion. J Hum Hypertens 1999;13:677-82.
28) Sorof JM, Portman RJ. White coat hypertension in children with elevated casual blood pressure. J Pediatr 2000;137:493-7.