https://doi.org/10.5468/ogs.2020.63.3.346 pISSN 2287-8572 · eISSN 2287-8580
Introduction
Ovarian cancer is reported as the sixth most common cancer and seventh most leading cause of cancer-associated death among women worldwide [1]. Additionally, ovarian cancer is known to be the second most common gynecological cancer and leading cause of gynecological cancer-related death in the western world [1]. Majority of the patients with ovarian cancer are initially diagnosed at an advanced stage [Interna- tional Federation of Gynecology and Obstetrics (FIGO) stage III] due to the lack of clinical appearance. Treatment options for these patients continue to be surgery and platinum-based
Prognostic value of programmed cell death ligand-1 expression in ovarian cancer: an updated meta-analysis
Jinlan Piao, MD
1, Hyun Ji Lim, MD
2, Maria Lee, MD, PhD
1,2Department of Obstetrics and Gynecology, 1Seoul National University College of Medicine, 2Seoul National University Hospital, Seoul, Korea
Objective
To investigate the prognostic significance of programmed cell death ligand-1 (PD-L1) in ovarian cancer.
Methods
PubMed, Embase, and Cochrane Library databases were searched to identify studies that examined the prognostic significance of immunohistochemically assessed PD-L1 expression in histologically confirmed ovarian cancer. Eleven studies on PD-L1 expression involving 1,296 patients with ovarian cancer were included in this meta-analysis. Pooled hazard ratios (HRs) with corresponding 95% confidence intervals (CIs) were analyzed. Relationship between PD- L1 expression, and overall survival (OS) or progression-free survival (PFS) among patients with ovarian cancer was assessed. Subgroup analysis was performed based on the race, histologic type, and tumor International Federation of Gynecology and Obstetrics stage to evaluate the source of heterogeneity. Begg’s Funnel plot and Egger’s linear test were used to evaluate publication bias. Random-effects model was implemented when significant between-study heterogeneity (I
2>50%) was observed.
Results
We found no correlation between PD-L1 expression, and OS (HR, 1.13; 95% CI, 0.95–1.36; I
2=78%) or PFS (HR, 1.07;
95% CI, 0.88–1.30; I
2=75%) in ovarian cancer. Subgroup analyses showed that higher PD-L1 expression was associated with poor OS in non-Asian patients with ovarian cancer (HR, 1.26; 95% CI, 1.07–1.481; I
2=59%). We found that upregulated PD-L1 expression to be a positive predictor for OS in serous ovarian cancer (HR, 0.98; 95% CI, 0.76–
1.26; I
2=74%) and a negative predictor for OS in non-serous ovarian cancer (HR, 1.29; 95% CI, 1.03–1.61; I
2=64%) Furthermore, high PD-L1 expression was found to be a negative predictor for PFS of patients with non-serous ovarian cancer (HR, 1.12; 95% CI, 0.96–1.29; I
2=37%).
Conclusion
Our meta-analysis suggests that PD-L1 expression is not associated with patient risk for ovarian cancer.
Keywords: Ovarian cancer; PD-L1; Survival rate; Progression-free survival; Prognosis
Received: 2019.08.02. Revised: 2019.11.12. Accepted: 2020.01.16.
Corresponding author: Maria Lee, MD, PhD
Department of Obstetrics and Gynecology, Seoul National University College of Medicine, 101 Daehak-ro, Jongno-gu, Seoul 03080, Korea
E-mail: [email protected] https://orcid.org/0000-0002-8017-3176
Articles published in Obstet Gynecol Sci are open-access, distributed under the terms of the Creative Commons Attribution Non-Commercial License (http://creativecommons.
org/licenses/by-nc/3.0/) which permits unrestricted non-commercial use, distribution, and reproduction in any medium, provided the original work is properly cited.
Copyright © 2020 Korean Society of Obstetrics and Gynecology
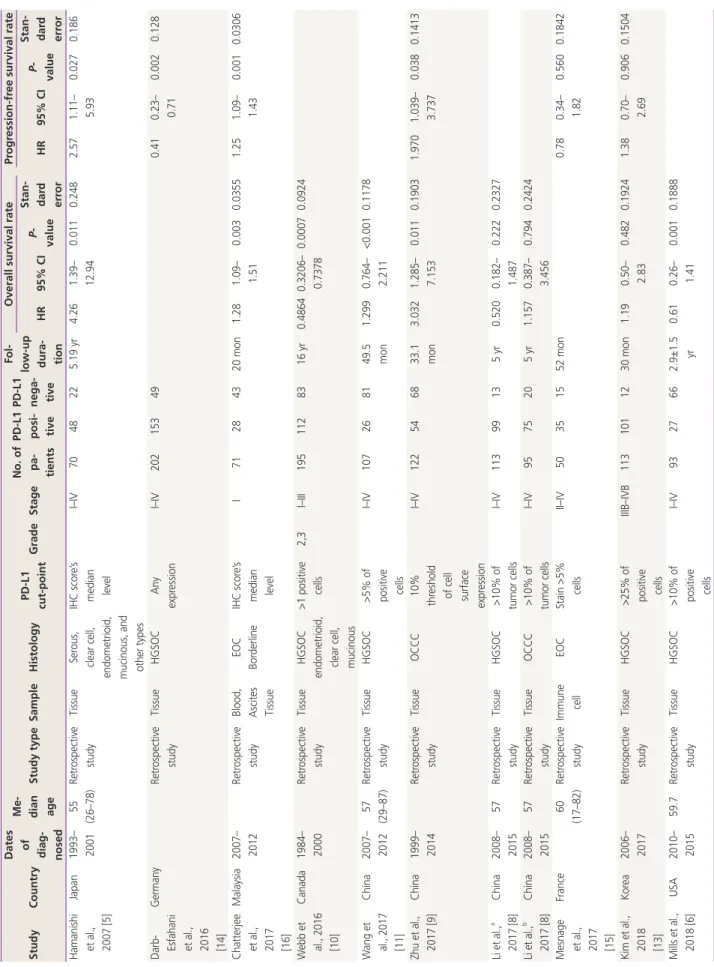
Table 1.Clinical characteristics of cohorts in the studies included in our meta-analysis StudyCountry
Dates of diag- nosed
Me- dian ageStudy typeSampleHistologyPD-L1 cut-pointGradeStageNo. of pa- tients
PD-L1 posi- tive
PD-L1 nega- tive
Fol- low-up dura- tion
Overall survival rateProgression-free survival rate HR95% CI P- value Stan- dard errorHR95% CIP- value
Stan- dard error Hamanishi et al., 2007 [5]
Japan1993– 200155 (26–78)Retrospective studyTissueSerous, clear cell, endometrioid, mucinous, and other types IHC score’s median level
I–IV7048225.19 yr4.261.39– 12.940.0110.2482.571.11– 5.930.0270.186 Darb- Esfahani et al., 2016 [14]
GermanyRetrospective studyTissueHGSOCAny expressionI–IV202153490.410.23– 0.710.0020.128 Chatterjee et al., 2017 [16]
Malaysia2007– 2012Retrospective studyBlood, Ascites Tissue EOC BorderlineIHC score’s median level
I71284320 mon1.281.09– 1.510.0030.03551.251.09– 1.430.0010.0306 Webb et al., 2016 [10]
Canada1984– 2000Retrospective studyTissueHGSOC endometrioid, clear cell, mucinous
>1 positive cells2,3I–III1951128316 yr0.48640.3206– 0.73780.00070.0924 Wang et al., 2017 [11]
China2007– 201257 (29–87)Retrospective studyTissueHGSOC>5% of positive cells
I–IV107268149.5 mon1.2990.764– 2.211<0.0010.1178 Zhu et al., 2017 [9]China1999– 2014Retrospective studyTissueOCCC10% threshold of cell surface expression
I–IV122546833.1 mon3.0321.285– 7.1530.0110.19031.9701.039– 3.7370.0380.1413 Li et al.,a 2017 [8]China2008– 201557Retrospective studyTissueHGSOC>10% of tumor cellsI–IV11399135 yr0.5200.182– 1.4870.2220.2327 Li et al.,b 2017 [8]China2008– 201557Retrospective studyTissueOCCC>10% of tumor cellsI–IV9575205 yr1.1570.387– 3.4560.7940.2424 Mesnage et al., 2017 [15]
France60 (17–82)Retrospective studyImmune cellEOCStain >5% cellsII–IV50351552 mon0.780.34– 1.820.5600.1842 Kim et al., 2018 [13]
Korea2006– 2017Retrospective studyTissueHGSOC>25% of positive cells IIIB–IVB1131011230 mon1.190.50– 2.830.4820.19241.380.70– 2.690.9060.1504 Mills et al., 2018 [6]USA2010– 201559.7 Retrospective studyTissueHGSOC>10% of positive cells
I–IV9327662.9±1.5 yr0.610.26– 1.410.0010.1888
cytotoxic chemotherapy with five-year survival rates of less than 20% [2].
Programmed cell death 1 (PD-1) receptor belongs to the B7-CD28 family of costimulatory receptors. PD-1 is expressed on the surface of T, B, and Natural Killer (NK) cells and has been shown to play key roles in their activation and apop- tosis. Programmed cell death ligand-1 (PD-L1) is one of the ligands of PD-1 that is expressed on both tumor and immune cells such as dendritic cells (DCs) or macrophages. Typically, neoantigens produced by tumor cells are recognized by DCs, which further activate cytotoxic T cells. Activated T cells then infiltrate the tumor environment, bind to cancer cells, and release cytokines that trigger apoptosis in target cancer cells.
To escape such anti-tumor mechanism, tumor cells have been observed to often overexpress PD-L1 that binds to PD-1 receptors on the activated T cells, thereby inhibiting cytotoxic T cells. Thus, PD-L1 has been known to be part of a crucial immunological escape mechanism, which promotes tumor cell growth, proliferation, and metastasis [3,4]. However, there are conflicting reports on the relationship between PD- L1 expression and prognosis in ovarian cancer. For instance, Hamanishi et al. [5] reported that PD-L1 expression was asso- ciated with poor prognosis in ovarian cancer; however, no re- lationship between PD-L1 expression and prognosis of ovar- ian cancer was observed by Mills et al. [6]. Recently, a meta- analysis on PD-L1 expression and prognosis in ovarian cancer has been published in 2018 [7]. This meta-analysis found that PD-L1 expression may be a negative predictor for prog- nosis of patients with ovarian cancer from Asian countries, while a promising positive predictor for non-Asian patients with ovarian cancer. To gain further clarity on the relationship between PD-L1 expression and ovarian cancer progression, we conducted the present meta-analysis after contemplating high-quality articles that have been recently published.
Materials and methods
1. Literature search
Two authors performed literature search using PubMed, EMBASE, and Cochrane Library databases. Literature search was performed using the following key words: “programmed death ligand 1” or “PD-L1” or “PDL1” or “B7-H1” or “B7H1”
or “CD274,” and “ovarian” or “ovary,” and “cancer” or
“carcinoma” or “neoplasm” or “tumour.” In addition, a
StudyCountry
Dates of diag- nosed
Me- dian ageStudy typeSampleHistologyPD-L1 cut-pointGradeStageNo. of pa- tients
PD-L1 posi- tive
PD-L1 nega- tive
Fol- low-up dura- tion
Overall survival rateProgression-free survival rate HR95% CI P- value Stan- dard errorHR95% CIP- value
Stan- dard error Tai et al.,a 2018 [17]
China2000– 201541 (22–62)Retrospective studyTissueKrukenburg (metastasize from gastric cancer) presence of stainingNA3592617 mon3.2011.273– 8.0500.0130.2041 Tai et al.,b 2018 [17]
China2000– 201541 (22–62)Retrospective studyTissueKrukenburg (metastasize from colorectal cancer)
presence of stainingNA30201017 mon5.1291.567– 16.7910.0070.2628 Li et al.a provided data regarding PD-L1 expression on HGSOC; Li et al.b provided data regarding PD-L1 expression on OCCC. Tai et al.a provided data regarding PD-L1 expression and krukenburg metastasized from gastric cancer. Tai et al.b provided data regarding PD-L1 expression and krukenburg metastasized from colorectal cancer. PD-L1, programmed cell death ligand-1; HR, hazard ratio; 95% CI, 95% confidence interval; IHC, immunohistochemistry; HGSOC, high-grade serous ovarian cancer; EOC, epithelial ovarian cancer; OCCC, ovarian clear cell carcinoma; NA, not applicable.
Table 1.Continued
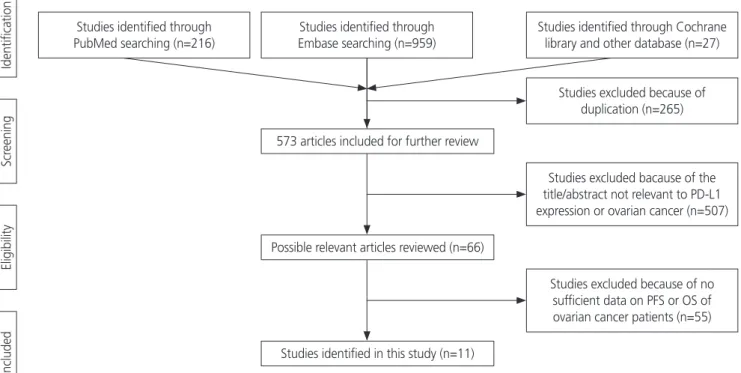
manual search from reference lists of all the eligible stud- ies was conducted to obtain additional references. The final search was conducted on November 7, 2019. Overall, 838 articles were searched using the key words, and 265 articles were excluded due to duplication. Further, 507 articles were excluded because the title and abstract were not relevant to PD-L1 expression and ovarian cancer. Additionally, 55 articles were excluded as sufficient data on overall survival (OS) or progression-free survival (PFS) rate were not available. Finally, 11 articles were included in this meta-analysis. Ethical ap- proval or patient consent was not required for our meta- analysis as only previously published studies were analyzed.
2. Eligibility criteria
The inclusion criteria for the studies in our meta-analysis were as follows: studies focusing on ovarian cancer, involving patients with histologically confirmed ovarian cancer, studies on PD-L1 (B7-H1) expression that was detected by immu- nohistochemistry (IHC) staining of tumor tissue, and studies investigating potential association between PD-L1 expression and OS or PFS of patients with ovarian cancer. IHC scoring system for PD-L1 was developed based on percentage of positive tumor cells and staining intensity. Staining intensity
was graded as 0 (no staining), 1 (weak), 2 (intermediate), or 3 (strong), whereas distribution of the cellular staining was graded as 0 (none), 1 (<10% of cells), 2 (11–50% of cells), 3 (51–75% of cells), or 4(>75% of cells). Scores 0 and 1 were defined as low expression, and scores 2 and 3 were defined as high expression [5-8], and the PD-L1 cut-off point was different in each article (Table 1). All articles included in this meta-analysis were written in English.
3. Data extraction
Two authors, Maria Lee and Jinlan Piao, independently ex- tracted the following information from every study included in our meta-analysis: name of the first author, publication year, country, median age, study type, source of resected tumor histology, FIGO stage and grade, number of patients, number of PD-L1-positive and negative patients, hazard ra- tios (HRs) with corresponding 95% confidence intervals (CIs), OS, and PFS. The end point for PFS was defined as the day of recurrence, while that for OS was defined as the day when the patient was confirmed alive or dead, respectively [9].
4. Assessment of study quality
Two authors independently assessed the quality of the in-
Studies identified through PubMed searching (n=216)
IdentificationScreeningEligibilityIncluded
Studies identified through Embase searching (n=959)
573 articles included for further review
Possible relevant articles reviewed (n=66)
Studies identified in this study (n=11)
Studies identified through Cochrane library and other database (n=27)
Studies excluded because of duplication (n=265)
Studies excluded bacause of the title/abstract not relevant to PD-L1 expression or ovarian cancer (n=507)
Studies excluded because of no sufficient data on PFS or OS of ovarian cancer patients (n=55)
Fig. 1. Flow chart of literature search and study design.
cluded studies using Newcastle-Ottawa Quality Assessment Scale (NOS). Disagreements in scoring were resolved by dis- cussing with a third reviewer. NOS was used to evaluate the following three parameters: selection (0–4 points), compa- rability (0–2 points), and outcome (0–3 points). The highest NOS score was 9 points, and studies scoring greater than 5 were classified as high-quality.
5. Statistical methods
Pooled HRs with corresponding 95% CIs were used to evalu- ate the association between PD-L1 expression and prognosis of patients with ovarian cancer. Subgroup analysis was per- formed based on the race, histologic type of ovarian cancer, and tumor FIGO stage of the enrolled patients with ovar- ian cancer. Random-effects model was implemented when significant heterogeneity (I
2>50% or P<0.1) was detected between the studies. Potential publication bias was visually assessed by Begg’s funnel plot and Egger’s linear test. This meta-analysis was performed using Review Manager 5.3 and STATA 15. P<0.05 was considered to be statistically significant.
Results
1. Search results
A total of 838 articles were screened for this study. After exempting duplicates, the title and abstract were screened for relevance. Articles that were not directly related to the subject of our meta-analysis or that did not provide a poten- tial relationship between PD-L1 expression data and OS or PFS of patients with ovarian cancer were excluded. Finally, 11 articles (13 comparisons) published between 2006 and 2018 with NOS ≥5 were included in our meta-analysis. The screen- ing process is described in Fig. 1.
2. Study characteristics
Characteristics of the included studies are shown in Table 1. In our meta-analysis, 11 studies (13 comparisons) were included, which involved 1,296 patients with ovarian cancer that were examined for PD-L1 expression and prognosis.
The included studies were typically high-quality with NOS ≥5 (Table 2). In all the selected studies, PD-L1 expression levels were detected by IHC staining. The included studies were observed to have 7 patient cohorts with high-grade serous ovarian cancer (HGSOC) [8,10-14], 4 cohorts with ovarian
Table 2.Newcastle-Ottawa Scale for the qualities of 11 enrolled studies Study Selection (score)Comparability (score)Exposure (score) Total scoreAdequate definition of cases
Representa- tiveness of cases Selection of control Definition of controls Control for important or additional factor Ascertainment of exposure Same method of ascertainment for cases and controls
Non- response rate Hamanishi et al., 2007 [5]110111106 Darb-Esfahani et al., 2016 [14]110111106 Chatterjee et al., 2017 [16]110121107 Webb et al., 2016 [10]110021106 Wang et al., 2017 [11]110011105 Zhu et al., 2017 [9]110011105 Li et al., 2017 [8]110111005 Mesnage et al., 2017 [15]110021106 Kim et al., 2018 [13]110121107 Mills et al., 2018 [6]111111107 Tai et al., 2018 [17]110011105 The scores depicted herein are the average of two assessors.
clear cell carcinoma (OCCC) [5,8,9], 2 cohorts with endome- trioid ovarian cancer [5,10], 2 cohorts with mucinous ovarian cancer [5,10], 2 cohorts with epithelial ovarian cancer (EOC) [15,16], 1 cohort with borderline ovarian cancer [16], and 2 cohorts with krukenburg tumor of ovarian cancer [17].
Among the 1,296 patients included in these 11 studies, 640 patients were found to be diagnosed with early stage (FIGO stage I–II) ovarian cancer and 519 patients with advanced stage (FIGO stage III–IV) ovarian cancer (Table 1).
3. Association between PD-L1 expression and OS or PFS in ovarian cancer
Among the 13 potential comparisons, 11 assessments were
observed to analyze the relationship between PD-L1 expres- sion and OS of patients with ovarian cancer. The data were pooled using random-effects model due to significant het- erogeneity between the studies (I
2=78%, P<0.0001). Based on the pooled HR, we found that increase in PD-L1 expres- sion was not significantly associated with OS of patients with ovarian cancer (HR, 1.13; 95% CI, 0.96–1.36; P<0.001;
I
2=78%) (Figs. 2 and 3). Among the 11 included studies, 6 evaluated PD-L1 expression and PFS of patients with ovar- ian cancer. The data were pooled using random-effects model due to significant heterogeneity between the studies (I
2=78%; P<0.001). Our results indicated that increase in PD- L1 expression was not significantly associated with PFS of
HR HR
Study or subgroup log [Hazard ratio] SE Weight IV, Random, 95% CI Year IV, Random, 95% CI
Hamanishi 2006 0.629 0.248 6.9% 1.88 [1.15, 3.05] 2006
Jayanta 2016 0.107 0.0355 13.9% 1.11 [1.04, 1.19] 2016
Webb 2016 -0.313 0.0924 12.4% 0.73 [0.61, 0.88] 2016
Li-1 2017 -0.384 0.2327 7.4% 0.68 [0.43, 1.07] 2017
Li 2017 0.063 0.2424 7.1% 1.07 [0.66, 1.71] 2017
Zhu 2017 0.482 0.1903 8.7% 1.62 [1.12, 2.35] 2017
Wang 2017 0.114 0.1178 11.4% 1.12 [0.89, 1.41] 2017
Kim 2018 0.076 0.1924 8.7% 1.08 [0.74, 1.57] 2018
Tai 2018 0.71 0.2628 6.5% 2.03 [1.22, 3.40] 2018
Tai-1 2018 0.505 0.2041 8.3% 1.66 [1.11, 2.47] 2018
Mills 2018 -0.215 0.1888 8.8% 0.81 [0.56, 1.17] 2018
Total (95% CI) 100% 1.13 [0.95, 1.36]
Heterogeneity: Tau2=0.06; Chi2=44.62, df=10 (P<0.00001); I2=78%
Test for overall effect: Z=1.39 (P=0.16)
0.01 0.1 1 10 100
Favours [experimental] Favours (control)
Fig. 2. Forest plot for overall survival rate of patients with ovarian cancer. HR, hazard ratio; SE, standard error; IV, inverse variance random;
95% CI, 95% confidence interval.
Fig. 3. Begg’s funnel plot (P=0.029) and Egger’s linear regression test (P=0.180) for assessing potential publication bias while establish- ing the potential relationship between programmed cell death ligand-1 expression and overall survival rate in patients with ovarian cancer.
SE, standard error; HR, hazard ratio; SND, standard normal deviate; 95% CI, 95% confidence interval.
SE (log [HR]) SND of effect estimate -202
0 0.1 0.2 0.4 0.4
0.5 0.5 0.7 1 1.5 2
HR
0 10 20 30
Precision
Study Regression line 95% CI for intercept
patients with ovarian cancer (HR, 1.07; 95% CI, 0.88–1.30;
I
2=75%; P=0.51) (Fig. 4).
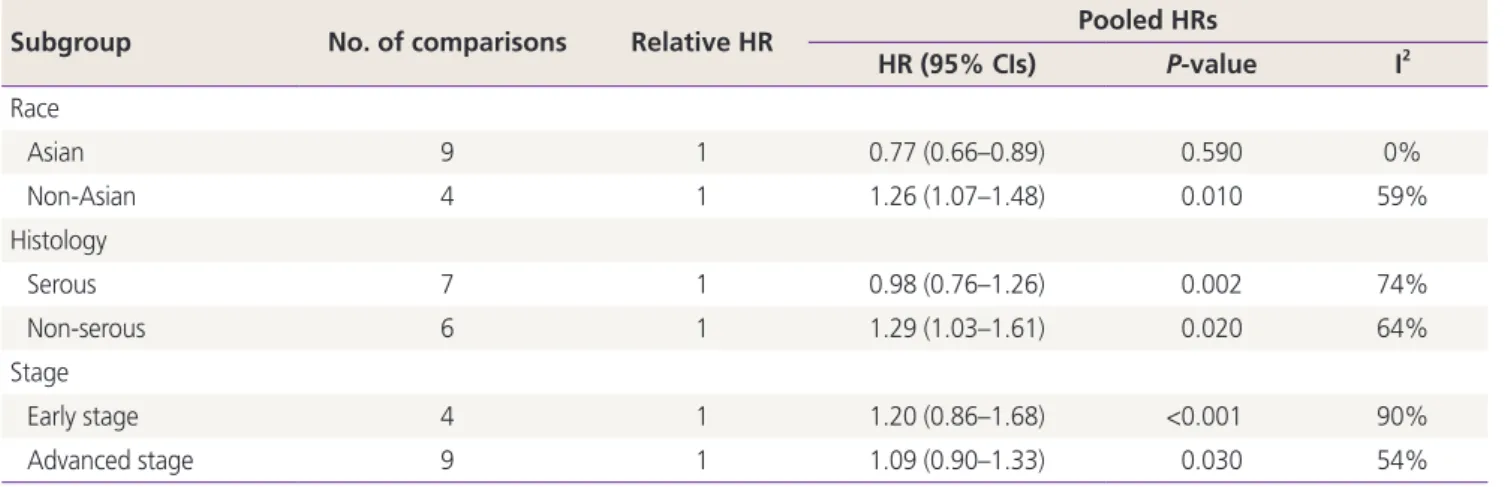
Subgroup analyses showed that higher PD-L1 expression was associated with poor OS of non-Asian patients with ovarian cancer (HR, 1.26; 95% CI, 1.07–1.481; I
2=59%);
however, a similar trend was not observed in Asian patients.
Upregulated PD-L1 expression was found to be a positive predictor for OS in serous ovarian cancer (HR, 0.98; 95%
CI, 0.76–1.26; I
2=74%) and a negative predictor for OS in non-serous ovarian cancer (HR, 1.29; 95% CI, 1.03–1.61;
I
2=64%). In contrast, higher expression of PD-L1 was ob- served to be a negative predictor for early stage (HR, 1.20;
95% CI, 0.86–1.68; I
2=90%) and advanced stage ovarian cancer (HR, 1.09; 95% CI, 0.90–1.33; I
2=54%). Additionally, we found that PD-L1 expression was a negative predictor for PFS of patients with serous (HR, 1.04; 95% CI, 0.65–1.67;
I
2=86%) and non-serous ovarian cancer (HR, 1.12; 95% CI, 0.96–1.29; I
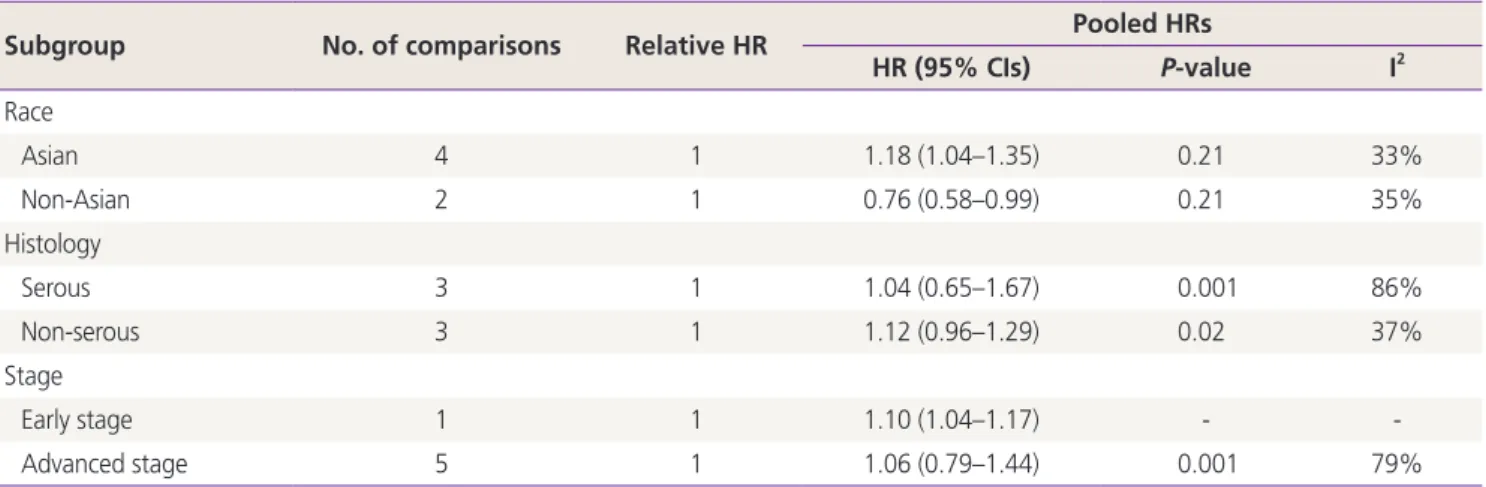
2=37%) (Tables 3 and 4).
4. Publication bias
Funnel plots were used to assess the studies included in our meta-analysis for potential publication bias. As shown in Figs. 3 and 5, funnel plots revealed asymmetry for OS (Begg’s funnel plot, P=0.029) but did not show asymmetry for the PFS (Begg’s funnel plot, P=0.612) of patients with ovarian cancer. Egger’s linear tests were used to identify publication bias in OS (Egger’s test, P=0.180).
Discussion
PD-1 is a member of the CD28 costimulatory receptor super-
HR HR
Study or subgroup log [Hazard ratio] SE Weight IV, Random, 95% CI Year IV, Random, 95% CI Hamanishi 2006 0.4099 0.186 13.2% 1.51 [1.05, 2.17] 2006
Silvia 2015 0.1399 0.1504 15.7% 1.15 [0.86, 1.54] 2015
Jayanta 2016 0.0969 0.0306 24.1% 1.10 [1.04, 1.17] 2016
Mesnage 2017 -0.108 0.1842 13.3% 0.90 [0.63, 1.29] 2017
Zhu 2017 -0.3872 0.128 17.4% 0.68 [0.53, 0.87] 2017
Kim 2018 0.294 0.1413 16.4% 1.34 [1.02, 1.77] 2018
Total (95% CI) 100% 1.07 [0.88, 1.30]
Heterogeneity: Tau2=0.04; Chi2=20.23, df=5 (P=0.001); I2=75%
Test for overall effect: Z=0.66 (P=0.51)
0.01 0.1 1 10 100
Favours [experimental] Favours (control)
Fig. 4. Forest plot for determining progression-free survival rate of patients with ovarian cancer. HR, hazard ratio; SE, standard error; IV, inverse variance random; 95% CI, 95% confidence interval.
Table 3. Subgroup analysis for programmed cell death ligand-1 expression and the outcome of overall survival rate of patients with ovar- ian cancer
Subgroup No. of comparisons Relative HR Pooled HRs
HR (95% CIs) P-value I2
Race
Asian 9 1 0.77 (0.66–0.89) 0.590 0%
Non-Asian 4 1 1.26 (1.07–1.48) 0.010 59%
Histology
Serous 7 1 0.98 (0.76–1.26) 0.002 74%
Non-serous 6 1 1.29 (1.03–1.61) 0.020 64%
Stage
Early stage 4 1 1.20 (0.86–1.68) <0.001 90%
Advanced stage 9 1 1.09 (0.90–1.33) 0.030 54%
HR, hazard ratio; 95% CI, 95% confidence interval.
family. PD-1 transmits inhibitory signals that abrogate T cell receptor-mediated activating signals, thereby preventing fur- ther antigen-mediated activation of T-cells. One of its ligands, known as PD-L1 or CD274, is mainly expressed on the sur- face of tumor cells and antigen-presenting cells in many solid malignancies [18,19]. In addition to tumor cells, high expres- sion levels of PD-L1 have been observed in human tumor- associated antigen-presenting cells, which includes tumor environment-associated DCs, tumor-draining lymph node DCs, macrophages, fibroblasts, and T cells [19-21]. PD-L1 is an important immune regulatory factor, and as a receptor for PD-1, it plays a key role in the immune escape mechanism of
cancer cells. PD-L1 specifically binds to the PD-1 receptor of T cells and impairs the activation and differentiation of T cells.
Tumor-infiltrating immune cells have been shown to induce cytokines such as interferons and vascular endothelial growth factors that upregulate PD-L1 expression [22-25]. PD-L1 up- regulation is known to regulate various intracellular signaling pathways both at the transcriptional and translational levels.
Additionally, this upregulation has been reported to alter the production of various pre-inflammatory factors and cytokines that are secreted in the tumor microenvironment [26,27].
Therefore, PD-L1 overexpression may potentially influence cancer progression and be associated with poor prognoses.
Studies on the expression, regulation, and function of the PD pathway in human cancer microenvironment have provided scientific rationales that have directly supported the current clinical application for blocking the PD pathway [18,20].
Moreover, PD-L1 is known to be expressed and associated with the prognosis of many human cancers such as lung [28], breast [29], hepatocellular [30], cervical [31], and ovarian cancers [8,23,32].
Since PD-1/PD-L1 pathway is suggested to play a pivotal role in the immune escape mechanism and growth of cancer cells [4,33], the relationship between PD-L1 expression and prognosis of ovarian cancer has markedly attracted several researchers and clinicians. Previous reports [34-36] have sug- gested the crucial role of PD-1/PD-L1 inhibition in ovarian cancer treatment. Furthermore, some studies have proposed that PD-L1 may not only be a good therapeutic target but also a prognostic biomarker for ovarian cancer [5,9-11,15,17].
However, other studies have yielded discrepant results. Thus,
Table 4. Subgroup analysis for PD-L1 expression and the outcome of progression-survival rate of patients with ovarian cancerSubgroup No. of comparisons Relative HR Pooled HRs
HR (95% CIs) P-value I2
Race
Asian 4 1 1.18 (1.04–1.35) 0.21 33%
Non-Asian 2 1 0.76 (0.58–0.99) 0.21 35%
Histology
Serous 3 1 1.04 (0.65–1.67) 0.001 86%
Non-serous 3 1 1.12 (0.96–1.29) 0.02 37%
Stage
Early stage 1 1 1.10 (1.04–1.17) - -
Advanced stage 5 1 1.06 (0.79–1.44) 0.001 79%
HR, hazard ratio; 95% CI, 95% confidence interval.
SE (log [HR])
0 0.05 0.1 0.15
0.2 0.2 0.5 1 2 5
HR Funnel plot with 95% confidence limits
Fig. 5. Begg’s funnel plot test (P=0.612) for assessing potential publication bias while establishing the potential relationship between programmed cell death ligand-1 expression and progres- sion-free survival rate in patients with ovarian cancer. SE, standard error; HR, hazard ratio.
the issue still remains controversial concerning ovarian can- cer. A previous meta-analysis that investigated the associa- tion between PD-L1 expression and prognosis of ovarian carcinoma found that PD-L1 expression is a poor-prognosis biomarker in Asian populations; however, it is a good-prog- nosis biomarker in non-Asian patients with ovarian cancer [7].
In this meta-analysis, we included 11 studies (13 compari- sons). From the selected studies, 11 comparisons were found analyzing the relationship between PD-L1 expression and OS of patients with ovarian cancer, while 6 comparisons were found analyzing the relationship between PD-L1 expression and PFS in ovarian cancer. Overall, our meta-analysis showed that PD-L1 expression was not associated with OS or PFS of patients with ovarian cancer. As high heterogeneity was ob- served among the included studies, we performed subgroup analysis to investigate the source of heterogeneity. We found that in Asian patients, PD-L1 expression was not associated with OS in ovarian cancer (HR, 0.77; 95% CI, 0.66–0.89;
P=0.59; I2