ABSTRACT
Objective: Programmed death-ligand 1 (PD-L1) was expressed in various tumors and antibodies targeting its receptor programmed cell death-1 (PD-1) are emerging cancer therapeutics. This study was designed to evaluate the expression of PD-L1 and its correlation with clinicopathologic features and clinical outcomes in ovarian clear cell carcinoma (OCCC).
Methods: The PD-L1 expression was measured by tissue-microarray-based
immunohistochemistry from 122 eligible patients diagnosed with OCCC. The associations of clinicopathologic features with progression-free survival (PFS) and overall survival (OS) were analyzed by Kaplan-Meier method and multivariate analysis was further performed by Cox regression model.
Results: Overall, high PD-L1 expression (PD-L1high) was observed in 44.7% (55/123) of OCCC patients, and was strongly associated with advanced stages (p=0.020), positive ascitic fluid (p=0.016), platinum-resistant (PR) disease (p=0.045), and recurrence (p=0.038).
Moreover, patients with PD-L1high were associated with poorer OS (hazard ratio [HR]=2.877;
p=0.001) and PFS (HR=1.843; p=0.021) than those with low PD-L1 expression (PD-L1low).
In subgroup analysis, PD-L1high patients experienced a poorer PFS (HR=1.926; p=0.044) and OS (HR=2.492; p=0.021) than PD-L1low cases among advanced stages (III–IV), but this difference was not observed in stage I–II patients. Meanwhile, PD-L1high was associated with poorer prognosis than PD-L1low in PR patients (OS, HR=2.253; p=0.037; PFS, HR=1.448;
p=0.233). Multivariate analysis revealed that PD-L1high and advanced stages (III–IV) were adverse independent prognosticators for both PFS (HRPD-L1=2.0; pPD-L1=0.038; HRstage=10.2;
pstage<0.001) and OS (HRPD-L1=3.0; pPD-L1=0.011; HRstage=14.3; pstage<0.001).
Conclusion: PD-L1high might serve as a risk factor for PFS and OS in patients with OCCC. It is possible that immunotherapy targeting PD-L1 pathway could be used in OCCC.
Keywords: Ovarian Neoplasms; Adenocarcinoma, Clear Cell; Antigens, CD274; Prognosis
INTRODUCTION
Epithelial ovarian carcinoma (EOC) has the highest mortality among gynecologic malignancies, accounting for 4.2% of all cancer-related deaths in women [1]. Although EOC is often thought of as a single entity, the different histological subtypes including clear cell carcinoma (CCC), serous adenocarcinoma (SAC), mucinous adenocarcinoma, and endometrioid adenocarcinoma vary in molecular, clinical, and pathological characteristics pISSN 2005-0380·eISSN 2005-0399
Original Article
Received: Jun 15, 2017 Revised: Jun 23, 2017 Accepted: Jul 23, 2017 Correspondence to Xiaohua Wu
Department of Gynecologic Oncology, Fudan University Shanghai Cancer Center, 270 Dong An Road, Shanghai 200032, China.
E-mail: [email protected] Copyright © 2017. Asian Society of Gynecologic Oncology, Korean Society of Gynecologic Oncology
This is an Open Access article distributed under the terms of the Creative Commons Attribution Non-Commercial License (https://
creativecommons.org/licenses/by-nc/4.0/) which permits unrestricted non-commercial use, distribution, and reproduction in any medium, provided the original work is properly cited.
ORCID iDs Jun Zhu
https://orcid.org/0000-0003-1224-2771 Xiaohua Wu
https://orcid.org/0000-0002-6889-3541 Conflict of Interest
No potential conflict of interest relevant to this article was reported.
Author Contributions
Conceptualization: Z.J., W.H., W.X.;
Data curation: Z.J.; Formal analysis: Z.J.;
Funding acquisition: W.X.; Investigation:
B.R., W.Y.; Methodology: Z.J., W.H.; Project administration: Z.J., W.H., W.X.; Resources:
Z.J., W.H.; Software: Z.J.; Supervision: W.X.;
Validation: Z.J., W.H., W.X.; Visualization: Z.J.;
Writing - original draft: Z.J.; Writing - review &
editing: Z.J., W.H., B.R., W.Y., W.X.
Jun Zhu ,1,2 Hao Wen,1,2 Rui Bi,3 Yong Wu,3 Xiaohua Wu 1,2
1Department of Gynecologic Oncology, Fudan University Shanghai Cancer Center, Shanghai, China
2Department of Oncology, Shanghai Medical College, Fudan University, Shanghai, China
3Department of Pathology, Fudan University Shanghai Cancer Center, Shanghai, China
Prognostic value of programmed
death-ligand 1 (PD-L1) expression in
ovarian clear cell carcinoma
[2]. Accounting for approximately 5%–25% of EOCs, ovarian clear cell carcinoma (OCCC) is presented with the highest incidences reported in people of Asiatic origin [3].
Microscopically, it is characterized by cells with clear cytoplasm (that contains glycogen) and hob nail cells (from which the glycogen has been secreted). Typically, early stage OCCC is known to have a favorable outcome; however, patients with advanced disease have poorer prognosis when compared to high-grade serous ovarian cancer (HGSOC) [4]. Data suggested that the standard treatment including the debulking surgery followed by systemic chemotherapy may be less effective in OCCC with advanced stages, owing to its resistance toward chemotherapeutic agents [5,6]. Therefore, improved therapeutic strategies are absolutely required in the management of women with OCCC.
Tumor-induced immune suppression is a key problem that not only promotes tumor development, but also inhibits the efficiency of anti-cancer treatment. One of the major molecular regulators of tumor immune escape is programmed death-ligand 1 (PD-L1, CD274, B7-H1), a cell-surface protein induced in a number of malignancies, which could help tumor cells immune evasion in combination with immonomodulatory properties [7]. Blockage of PD-L1 expression on tumor cells might activate tumor-specific T cell to kill tumor cells by mediating tumor necrosis factor alpha (TNF-α) and interferon gamma (IFN-γ) [8,9]. Previous studies have shown that PD-L1 can be expressed in a number of malignancies including melanoma (MEL), non-small cell lung cancers (NSCLCs), renal cell carcinomas (RCCs), cancers of head and neck, and gastrointestinal malignancies [10-14], and was correlated with unfavorable prognosis and the resistance to anticancer therapies in non-small lung cancers, colorectal and breast cancers [15-17]. Although several literatures showed that PD-L1 expression was upregulated in EOCs, most studies were conducted only in serous ovarian cancer (OC) [18-20]. Therefore, we focused our work to investigate the PD-L1 expression and its correlation with clfinicopathological features in OCCC, and to further explore the prognostic value of PD-L1 expression in OCCC.
MATERIALS AND METHODS
1. Patients
A total of 138 patients diagnosed with OCCC were selected from the archival collections (between 1999 and 2014) of the Department of Pathology at Fudan University Shanghai Cancer Center. The exclusion criteria included patients with previously treated OCCC, patients with malignancies other than OCCC, patients with a simultaneous second primary cancer, patients with a previous history of chemo-radiotherapy due to other diseases and patients without follow-up infomation. Of the whole series, 122 patients with adequate paraffin-embedded tissue for immunohistochemical evaluation were enrolled in the study of the PD-L1 expression. All the 122 cases had undergone primary operation and received no chemotherapy before surgery. The detailed clinical data were collected by reviewing patients' medical charts. In order to confirm the diagnosis, all the microscopic slides were reviewed by the same gynecology-dedicated pathologist (Wu Y) and confirmed by a second experienced gynecologic pathologist (Bi R). Both were blinded to the original diagnosis. The histologic subtype was classified according to the World Health Organization (WHO) definitions [21].
All the 122 patients in the study cohort provided informed consent. The study was approved by the ethics committee at Fudan University Shanghai Cancer Center, Shanghai, China. All of the participants provided written informed consent for the use of their tissue samples.
Patients were staged using the International Federation of Gynecology and Obstetrics (FIGO) 2012 staging system and were further divided into early stage (I–II) and advanced stage (III–IV) for the purpose of statistical analysis. The vast majority of the patients received platinum-based chemotherapy regimens with the number of cycles ranging from 6 to 8.
Operations were performed by gynecologic oncologist to achieve optimal cytoreduction, which was defined as residual disease less than (or including) 1 cm after primary debulking.
The platinum-sensitive (PS) patients were defined as the length of the platinum-free interval (PFI) of more than 6 months after completion of the last platinum-based regimen, while the platinum-resistant (PR) disease with a PFI less than 6 months.
2. Construction of the tissue microarray (TMA)
TMAs were constructed in the present study. In brief, hematoxylin and eosin (H&E) sections were assessed and an appropriate area of tumor was marked on the corresponding paraffin block. Care was taken not to include areas of fibrosis, adipose tissue or necrosis. Duplicate of 0.8 mm diameter cylinders were punched from representative tumor areas of individual donor tissue block, and re-embedded into a recipient paraffin block at a defined position, using a manual tissue arrayer (Beecher Instruments, Silver Spring, MD, USA). Following a review and screening of the representative tumor regions, 3 different areas were selected to cover the intratumoral heterogeneity for each tumor. Four TMA blocks were built at Fudan University Shanghai Cancer Center biorepository facility.
3. Immunohistochemistry (IHC)
TMAs were immunohistochemically stained. Primary antibodies used for IHC included anti-PD-L1 Ab (antibody) (ab205921, 1:50 dilution ratio; Abcam, Cambridge, MA, USA).
The tissue sections were deparaffinized in xylene (2×20 minutes) and subjected to a graded alcohol dehydration (95%, 90%, 80%, and 70%) to water. Heat-mediated antigen retrieval was performed with ethylenediaminetetraacetic acid (EDTA) buffer (pH=8) by microwaves for 23 minutes. To block endogenous peroxidase activity, all sections were treated with 100% methanol containing 0.3% H2O2 at room temperature for 25 minutes. The sections were incubated with rabbit anti-PD-L1 monoclonal Ab overnight at 4°C. Then, the sections were incubated with a biotinylated goat-anti-rabbit secondary Ab (K5007; Dako, Glostrup, Denmark), followed by an incubation with a streptavidin-peroxidase complex solution at room temperature for 50 minutes and counterstained with hematoxylin. Positive controls consisted of placenta tissue for the primary antibody and the normal ovarian tissue was used for the negative control.
4. Assessment of PD-L1 expression
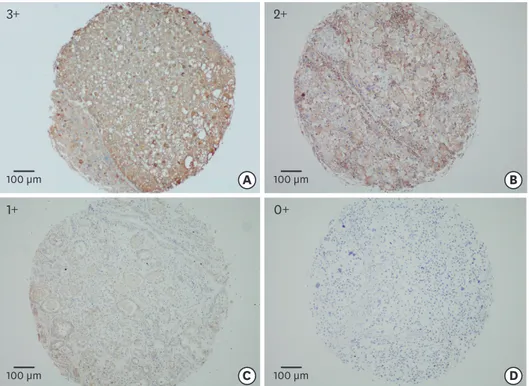
Two gynecological pathologists independently examined the prepared immunohistochemical slides without any prior information on the clinical history of the patients. The proportion of PD-L1-positive cells was estimated as a percentage of the total tumor cells. The tumor cells typically showed membranous staining with a variably strong component of cytoplasmic staining. Immunohistochemical evaluation of PD-L1 in OCCC specimens was based on the intensity and extent of nuclear and cytoplasmic reactivity. A 10% threshold of cell surface PD-L1 expression on tumor cells was defined as positive. The tumor cells typically showed membranous staining with a variably strong component of cytoplasmic staining. Then, we defined samples with barely no positive cells, less than 10% of positive cells, 10%–50% of positive cells, more than 51% of positive cells as negative, weak, moderate, strong expression, respectively. Tumors with moderate and strong staining were considered to be high
expression of PD-L1 [22].
5. Statistical analysis
Statistical comparisons between clinicopathologic features and PD-L1 expression were evaluated using a χ2 test, whereas Fisher's exact test was added as necessary during the statistical analysis. In the analysis of recurrence and survival, the start point was defined as the day surgery was performed. The end of the progression-free survival (PFS) period was defined as the day of recurrence, and that of overall survival (OS) period was defined as the day confirmed alive or dead, respectively. Estimation of PFS and OS was calculated by the Kaplan-Meier method, and the curves were compared using a log-rank test. Possible risk factors for recurrence and OS were analyzed with a Cox proportional hazards model. All of the p-values reported were 2-sided, and a value of p<0.05 was considered statistically significant. Statistical Package for Social Science (SPSS) statistical software (version 20.0;
SPSS Inc., Chicago, IL, USA) and GraphPad Prism (version 5.0; GraphPad Software Inc., La Jolla, CA, USA) were used for all of the analyses.
RESULTS
1. Demographic and clinicopathologic characteristics
Demographics and clinicopathologic characteristics are summarized in Table 1. A total of 122 eligible patients were enrolled with a median postoperative follow-up term of 33.1 months (range, 1.7–163.4 months). The median age with a diagnosis of clear cell histology was 53.0 years (range, 19–83).
At the completion of the primary surgery, 80.5% of the patients (n=99) had no visible residual disease (R0), 14.6% of the patients (n=18) had residual disease ≤1 cm, and 4.9% of the advanced cases (n=6) had residual disease >1 cm. The vast majority (98.4%, n=121) of the patients received adjuvant chemotherapy with platinum-based regimens, while only 2 patients received the traditional Chinese medicine instead of chemotherapy.
2. Immunohistochemical detection of PD-L1 expression in OCCC
PD-L1 was stained using IHC techniques on the cell membrane or in the cytoplasm of epithelial tumor cells and the immunohistochemical PD-L1 expression was depicted in Figs. 1 and 2. Among all 123 cases, 55 cases (44.7%) were categorized as having high PD-L1 expression (PD-L1high) and 68 cases (55.3%) were presented with low PD-L1 expression (PD- L1low). When stratified by FIGO stage, PD-L1high was observed in 22 of 58 stage I cases (37.9%), 7 of 19 stage II cases (36.8%), 20 of 36 stage III cases (55.6%), and 6 of 10 stage IV cases (60.0%). In PS patients, PD-L1high was observed in 31 cases (38.3%), and 50 cases (61.7%) were presented with low expression. While among PR patients, 23 cases (57.5%) were found to have PD-L1high and PD-L1low was displayed in 17 cases (42.5%).
3. Statistical association between PD-L1 expression and clinicopathologic features in OCCC
Table 2 shows the clinicopathologic characteristics in relation to PD-L1 expression. PD-L1high was significantly associated with advanced stages (III–IV) compared to PD-L1low (57.4% vs.
42.6%, p=0.020). Additionally, PD-L1high tended to be associated with positive ascitic fluid rather than negative ascitic fluid (57.1% vs. 42.9%, p=0.016). Recurrent OCCC patient with PR appeared to exhibit elevated expression of PD-L1 (57.5% vs. 42.5%, p=0.045). Recurrent diseases seemed to present PD-L1high than those diseases with no relapse (54.5% vs. 45.5%, p=0.038).
4. Survival analysis according to PD-L1 expression in OCCCs
The PFS and OS curves after surgery for patients who underwent complete resection are shown in Fig. 3. On the whole, patients had an estimated median PFS of 62.9 months (95%
CI=24.1–101.7 months; Fig. 3A) and the 3- and 5-year OS were 74.9% and 60.7%, respectively (Fig. 3B). PD-L1high was associated with significantly shorter median PFS compared with PD- L1low (52.0 months vs. not achieved in the study period; p=0.021; Fig. 3D). Similarly, patients with PD-L1high was correlated with better survival outcome than those with PD-L1low (5-year OS rate, 71.9% vs. 48.2%; p=0.001; Fig. 3C).
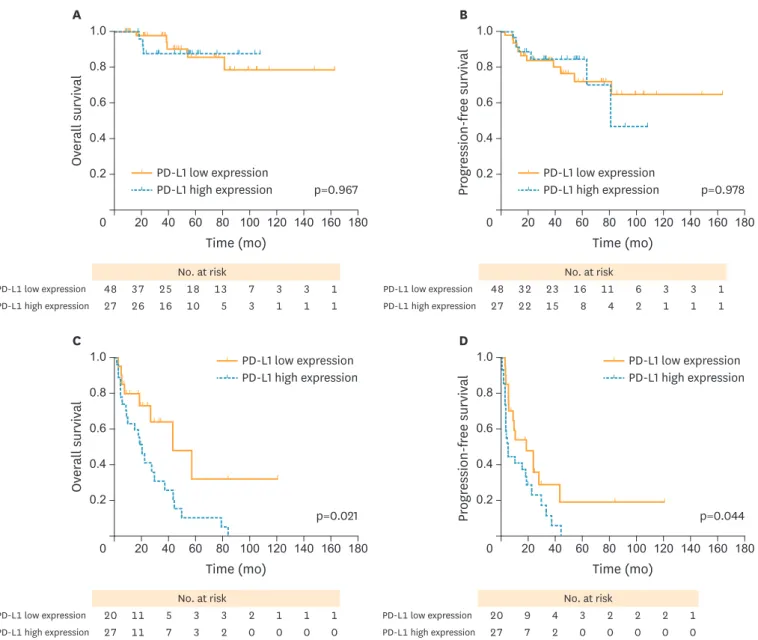
In subgroup analysis, both PFS (p=0.978; Fig. 4B) and OS (p=0.967; Fig. 4A) curves were not significantly different between high and PD-L1low in early stage (I–II) patients. However, patients with PD-L1high experienced a poorer PFS (hazard ratio [HR]=1.926; p=0.044; Fig. 4D) and OS (HR=2.492; p=0.021; Fig. 4C) compared with those with PD-L1low in advanced stages (III–IV). Meanwhile, both PFS (p=0.219; Fig. 5B) and OS (p=0.662; Fig. 5A) curves were not significantly different between PD-L1high and PD-L1low group in PS patients. PD-L1high exhibited Table 1. Univariate analysis of factors associated with PFS and OS
Factors No. Recurrent (%) p-value Death (%) p-value
Age at diagnosis (yr) 0.368 0.848
≤55 76 32 (42.1) 24 (31.6)
>55 46 23 (50.0) 15 (32.6)
Family history of malignancy 0.843 0.702
Yes 30 13 (45.7) 9 (30.0)
None 92 42 (43.3) 30 (32.6)
Menopause 0.753 0.395
Postmenopausal 75 33 (44.0) 23 (30.7)
Premenopausal 47 22 (46.8) 16 (34.0)
BMI 0.880 0.888
≤25 61 27 (44.3) 18 (29.5)
>25 61 28 (45.9) 21 (34.4)
Pretreatment CA125 level (U/mL) 0.002 0.023
<244 55 18 (32.7) 13 (23.6)
≥244 52 30 (57.7) 19 (36.5)
Ascites 0.133 0.077
Negative 68 27 (39.7) 18 (26.5)
Positive 49 25 (51.0) 18 (36.7)
Tumor site 0.001 <0.001
Unilateral 99 39 (39.4) 26 (26.3)
Bilateral 23 16 (69.6) 13 (56.5)
Tumor volume (cm) 0.139 0.038
<10 49 26 (53.1) 21 (42.9)
≥10 73 29 (39.7) 18 (24.7)
Tumor stage <0.001 <0.001
I 57 10 (17.5) 5 (7.9)
II 19 8 (42.1) 6 (30.0)
III 36 28 (77.8) 25 (58.1)
IV 10 9 (90.0) 8 (80.0)
Residual disease (cm) <0.001 <0.001
R0 98 36 (36.7) 23 (23.5)
≤1 18 13 (72.2) 10 (55.6)
>1 6 6 (100.0) 6 (100.0)
Sensitivity to chemotherapy <0.001 <0.001
Sensitive 81 14 (17.3) 7 (8.6)
Insensitive 40 40 (100) 31 (77.5)
PD-L1 expression 0.021 0.001
Low 68 25 (36.8) 13 (19.1)
High 54 30 (55.6) 26 (48.1)
BMI, body mass index; OS, overall survival; PD-L1, programmed death-ligand 1; PFS, progression-free survival; R0, no visible residual disease.
a poorer OS compared with those with PD-L1low in PR cases (median OS, 17.6 vs. 26.6 months;
p=0.037; Fig. 5C), whereas no favoring advantage in PFS was found (p=0.233; Fig. 5D).
A B
C D
100 µm
100 µm
100 µm
100 µm
3+ 2+
1+ 0+
Fig. 1. The overview of staining intensities of the tissue array is shown (3+. 2+, 1+, and 0+), with an example each (A-D) for a membranous and/or for a cytoplasmic staining pattern.
A B C
D E 0 Negative F
Low expression
20 48
36
19
+++
++
+ 40
Cases (n)
60
20
High expression
Fig. 2. Immunohistochemical staining for PD-L1 in OCCC tumor tissues. The staining intensities are shown (0+, 1+, 2+, 3+), with an example each (A-D) for a membranous and/or a cytoplasmic staining pattern. The placenta tissue (E) is used as a positive control for PD-L1 expression. The total number of each staining intensity are shown in (F).
OCCC, ovarian clear cell carcinoma; PD-L1, programmed death-ligand 1.
5. Univariate and multivariate analysis of possible risk factors affecting recurrence and OS in OCCCs
In univariate analysis, tumor recurrence was significantly associated with PD-L1high (HR=1.9;
p=0.021), advanced stages (III–IV, HR=7.8; p<0.001), high level of serum CA125 (HR=2.5;
p=0.002), gross residual diseases (HR=2.9; p<0.001), PR diseases (HR=31.3; p<0.001), and bilateral tumor (HR=1.6; p=0.001). In addition, PD-L1high (HR=2.9; p=0.001), advanced stages (III–IV, HR=11.8; p<0.001), gross residual diseases (HR=4.5; p<0.001), PR diseases (HR=21.0; p<0.001), bilateral tumor (HR=1.9; p<0.001), high level of serum CA125 (HR=2.2;
p=0.023), and large tumor volume (HR=1.9; p=0.038) were predictive of a worse survival outcome (Table 1).
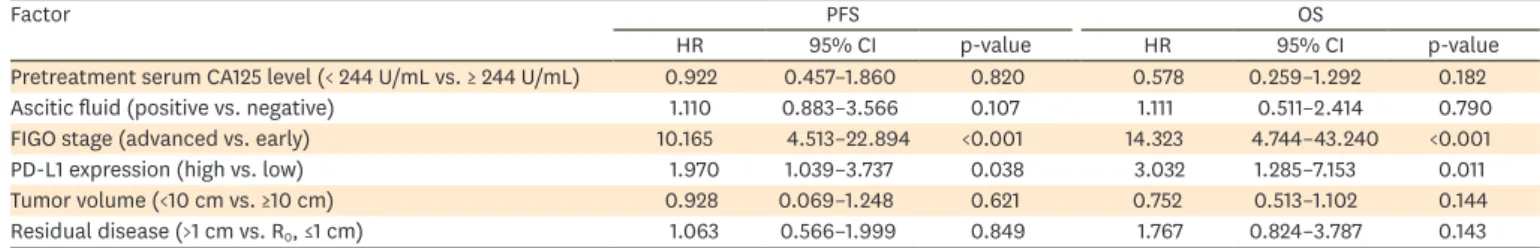
In multivariate analysis, PD-L1high and advanced stages (III–IV) were adverse independent prognosticators for both PFS (HRPD-L1=2.0; pPD-L1=0.038; HRstage=10.2; pstage<0.001, respectively;
Table 3) and OS (HRPD-L1=3.0; pPD-L1=0.011; HRstage=14.3; pstage<0.001, respectively; Table 3).
DISCUSSION
This study demonstrates that PD-L1high was observed in OCCC patients and was significantly associated with advanced stages, positive ascitic fluid, PR disease, and relapse of disease.
Furthermore, PD-L1high exhibited poorer PFS and OS than PD-L1low among OCCC patients.
Table 2. Correlations between the expression of PD-L1 and clinicopathological characteristics in OCCCs
Variables Tumoral PD-L1 expression
Low expression High expression p-value
Age (yr) 0.260
≤55 39 (57.4) 37 (68.5)
>55 29 (42.6) 17 (31.5)
Stage 0.020
Early (I–II) 48 (70.6) 27 (50.0)
Advanced (III–IV) 20 (29.4) 27 (50.0)
BMI 0.068
≤25 29 (42.6) 32 (59.3)
>25 39 (57.4) 22 (40.7)
Menopause status 0.264
Premenopausal 23 (33.8) 24 (44.4)
Postmenopausal 45 (66.2) 30 (55.6)
Pretreatment CA125 (U/mL) 0.699
<244 32 (53.3) 23 (48.9)
≥244 28 (46.7) 24 (51.1)
Ascitic fluid 0.016
Negative 45 (68.2) 23 (45.1)
Positive 21 (31.8) 28 (54.9)
Tumor site 0.245
Unilateral 58 (85.3) 41 (75.9)
Bilateral 10 (14.7) 13 (24.1)
Tumor volume (cm) 0.854
<10 28 (41.2) 21 (38.9)
≥10 40 (58.8) 33 (61.1)
Sensitivity to chemotherapy 0.045
Sensitive 50 (74.6) 31 (57.4)
Insensitive 17 (25.4) 23 (42.6)
Recurrence status 0.038
Relapse 25 (36.8) 30 (55.6)
No relapse 43 (63.2) 24 (44.4)
BMI, body mass index; OCCC, ovarian clear cell carcinoma; PD-L1, programmed death-ligand 1.
More importantly, the unfavorable prognostic effect of PD-L1high was identified as an independent predictor for survival.
In the present study, a significant association between PD-L1high and advanced FIGO stage was identified. FIGO stage was previously confirmed to be strongly correlated with prognosis in OCCC patients. The significant correlation between PD-L1high and advanced disease stage suggested the intense association between PD-L1 expression and tumor malignancy. Of note, a significant correlation between PD-L1high and ascitic fluid was observed, confirming the metastatic behavior of the carcinomatous component. A separate study by Abiko et al.
[23] demonstrated in his study that PD-L1 expression in OC is associated with increased invasiveness and peritoneal dissemination. Maine et al. [24] demonstrated that PD-L1 expression on monocytes in the ascites and blood of patients with malignant OC is strikingly higher than those with benign/borderline disease. Together with our study, these results
PD-L1 low expression PD-L1 high expression PD-L1 low expression
PD-L1 high expression Time (mo)
A B
0 180
Overall survival
1.0
0.6
0.2 0.4 0.8
1.0
0.6
0.2 0.4 0.8
160 140 120 100 80 60 40
20 20 40 60 80 100 120 140 160 180
Time (mo)
0
Progression-free survival
Time (mo)
C D
p=0.001 p=0.021
0 180
Overall survival
1.0
0.6
0.2 0.4 0.8
1.0
0.6
0.2 0.4 0.8
160 140 120 100 80 60 40
20 20 40 60 80 100 120 140 160 180
Time (mo)
0
Progression-free survival
No. at risk
122 80 49 30 20 10 4 3 2 0
No. at risk
122 66 41 25 16 8 4 3 2 0
PD-L1 low expression PD-L1 high expression PD-L1 low expression
PD-L1 high expression Time (mo)
A B
0 180
Overall survival
1.0
0.6
0.2 0.4 0.8
1.0
0.6
0.2 0.4 0.8
160 140 120 100 80 60 40
20 20 40 60 80 100 120 140 160 180
Time (mo)
0
Progression-free survival
Time (mo)
C D
p=0.001 p=0.021
0 180
Overall survival
1.0
0.6
0.2 0.4 0.8
1.0
0.6
0.2 0.4 0.8
160 140 120 100 80 60 40
20 20 40 60 80 100 120 140 160 180
Time (mo)
0
Progression-free survival
No. at risk
PD-L1 low expression 68 47 29 20 15 8 4 3 2 1
PD-L1 high expression 54 34 21 11 6 3 0 0 0 0
No. at risk
PD-L1 low expression 68 40 26 18 13 7 4 2 1 0
PD-L1 high expression 54 27 16 8 4 2 0 0 0 0
Fig. 3. (A, B) PFS and OS curves in patients with OCCC. (C) Patients with PD-L1high (blue dotted line) showed significantly worse PFS compared with those with low expression (yellow solid line). (D) Patients with PD-L1low (yellow solid line) presented a better survival outcome than those with PD-L1high (blue dotted line).
OCCC, ovarian clear cell carcinoma; OS, overall survival; PD-L1, programmed death-ligand 1; PD-L1high, high PD-L1 expression; PD-L1low, low PD-L1 expression; PFS, progression-free survival.
supported that PD-L1 expression possibly reflected the interruption of the antitumor immunity of the host and might further be associated with tumor development in ovarian malignancies.
Currently, PD-L1 is thought as a key mechanism of immunosuppressive effect and allows the tumor to evade immune destruction. Multiple different tumors expressing PD-L1, including NSCLC [25], RCC [26], osteosarcoma [27], and advanced MEL [28], presented a relatively poor prognostic outcomes. However, some other studies exhibited a controversial result of PD-L1 expression on the survival outcome. Kluger et al. [29] reported a better OS in patients with malignant MELs associated with high levels of PD-L1 expression. Also Beckers et al. [30]
Time (mo)
A B
p=0.967 p=0.978
0 180
Overall survival
1.0
0.6
0.2 0.4 0.8
1.0
0.6
0.2 0.4 0.8
160 140 120 100 80 60 40
20 20 40 60 80 100 120 140 160 180
Time (mo)
0
Progression-free survival
Time (mo)
C D
p=0.021 p=0.044
0 180
Overall survival
1.0
0.6
0.2 0.4 0.8
1.0
0.6
0.2 0.4 0.8
160 140 120 100 80 60 40
20 20 40 60 80 100 120 140 160 180
Time (mo)
0
Progression-free survival
PD-L1 low expression PD-L1 high expression
PD-L1 low expression PD-L1 high expression
PD-L1 low expression PD-L1 high expression
PD-L1 low expression PD-L1 high expression Time (mo)
A B
p=0.967 p=0.978
0 180
Overall survival
1.0
0.6
0.2 0.4 0.8
1.0
0.6
0.2 0.4 0.8
160 140 120 100 80 60 40
20 20 40 60 80 100 120 140 160 180
Time (mo)
0
Progression-free survival
Time (mo)
C D
p=0.021 p=0.044
0 180
Overall survival
1.0
0.6
0.2 0.4 0.8
1.0
0.6
0.2 0.4 0.8
160 140 120 100 80 60 40
20 20 40 60 80 100 120 140 160 180
Time (mo)
0
Progression-free survival
PD-L1 low expression PD-L1 high expression
PD-L1 low expression PD-L1 high expression
PD-L1 low expression PD-L1 high expression
PD-L1 low expression PD-L1 high expression No. at risk
PD-L1 low expression 48 37 25 18 13 7 3 3 1
PD-L1 high expression 27 26 16 10 5 3 1 1 1
No. at risk
PD-L1 low expression 48 32 23 16 11 6 3 3 1
PD-L1 high expression 27 22 15 8 4 2 1 1 1
Time (mo)
A B
p=0.967 p=0.978
0 180
Overall survival
1.0
0.6
0.2 0.4 0.8
1.0
0.6
0.2 0.4 0.8
160 140 120 100 80 60 40
20 20 40 60 80 100 120 140 160 180
Time (mo)
0
Progression-free survival
Time (mo)
C D
p=0.021 p=0.044
0 180
Overall survival
1.0
0.6
0.2 0.4 0.8
1.0
0.6
0.2 0.4 0.8
160 140 120 100 80 60 40
20 20 40 60 80 100 120 140 160 180
Time (mo)
0
Progression-free survival
PD-L1 low expression PD-L1 high expression
PD-L1 low expression PD-L1 high expression
PD-L1 low expression PD-L1 high expression
PD-L1 low expression PD-L1 high expression Time (mo)
A B
p=0.967 p=0.978
0 180
Overall survival
1.0
0.6
0.2 0.4 0.8
1.0
0.6
0.2 0.4 0.8
160 140 120 100 80 60 40
20 20 40 60 80 100 120 140 160 180
Time (mo)
0
Progression-free survival
Time (mo)
C D
p=0.021 p=0.044
0 180
Overall survival
1.0
0.6
0.2 0.4 0.8
1.0
0.6
0.2 0.4 0.8
160 140 120 100 80 60 40
20 20 40 60 80 100 120 140 160 180
Time (mo)
0
Progression-free survival
PD-L1 low expression PD-L1 high expression
PD-L1 low expression PD-L1 high expression
PD-L1 low expression PD-L1 high expression
PD-L1 low expression PD-L1 high expression
No. at risk
PD-L1 low expression 20 11 5 3 3 2 1 1 1
PD-L1 high expression 27 11 7 3 2 0 0 0 0
No. at risk
PD-L1 low expression 20 9 4 3 2 2 2 1
PD-L1 high expression 27 7 2 0 0 0 0 0
Fig. 4. PFS and OS curves stratified by FIGO stage between high and low PD-L1 expression (yellow solid lines, PD-L1low; blue dotted lines, PD-L1high, respectively).
(A) OS curves between high and PD-L1low in FIGO stage I/II cases. (B) PFS curves between high and PD-L1low in FIGO stage I/II cases. (C) OS curves between high and PD-L1low in stage III/IV cases. (D) PFS curves between high and PD-L1low in stage III/IV cases. Patients with PD-L1high revealed a worse OS and PFS compared with those with PD-L1low in stage III/IV cases, with significant differences observed.
FIGO, International Federation of Gynecology and Obstetrics; OCCC, ovarian clear cell carcinoma; OS, overall survival; PD-L1, programmed death-ligand 1;
PD-L1high, high PD-L1 expression; PD-L1low, low PD-L1 expression; PFS, progression-free survival.
Time (mo)
A B
p=0.662 p=0.219
0 180
Overall survival
1.0
0.6
0.2 0.4 0.8
1.0
0.6
0.2 0.4 0.8
160 140 120 100 80 60 40
20 20 40 60 80 100 120 140 160 180
Time (mo)
0
Progression-free survival
Time (mo)
C D
p=0.037 p=0.233
0 180
Overall survival
1.0
0.6
0.2 0.4 0.8
1.0
0.6
0.2 0.4 0.8
160 140 120 100 80 60 40
20 10 20 30 40 50
Time (mo)
0
Progression-free survival
PD-L1 low expression PD-L1 high expression
PD-L1 low expression PD-L1 high expression PD-L1 low expression
PD-L1 high expression
PD-L1 low expression PD-L1 high expression Time (mo)
A B
p=0.662 p=0.219
0 180
Overall survival
1.0
0.6
0.2 0.4 0.8
1.0
0.6
0.2 0.4 0.8
160 140 120 100 80 60 40
20 20 40 60 80 100 120 140 160 180
Time (mo)
0
Progression-free survival
Time (mo)
C D
p=0.037 p=0.233
0 180
Overall survival
1.0
0.6
0.2 0.4 0.8
1.0
0.6
0.2 0.4 0.8
160 140 120 100 80 60 40
20 10 20 30 40 50
Time (mo)
0
Progression-free survival
PD-L1 low expression PD-L1 high expression
PD-L1 low expression PD-L1 high expression PD-L1 low expression
PD-L1 high expression
PD-L1 low expression PD-L1 high expression
No. at risk
PD-L1 low expression 50 39 27 19 14 7 4 3
PD-L1 high expression 31 25 18 9 5 3 0 0
No. at risk
PD-L1 low expression 50 27 25 18 13 7 4 3
PD-L1 high expression 31 23 16 8 4 2 0 0
Time (mo)
A B
p=0.662 p=0.219
0 180
Overall survival
1.0
0.6
0.2 0.4 0.8
1.0
0.6
0.2 0.4 0.8
160 140 120 100 80 60 40
20 20 40 60 80 100 120 140 160 180
Time (mo)
0
Progression-free survival
Time (mo)
C D
p=0.037 p=0.233
0 180
Overall survival
1.0
0.6
0.2 0.4 0.8
1.0
0.6
0.2 0.4 0.8
160 140 120 100 80 60 40
20 10 20 30 40 50
Time (mo)
0
Progression-free survival
PD-L1 low expression PD-L1 high expression
PD-L1 low expression PD-L1 high expression PD-L1 low expression
PD-L1 high expression
PD-L1 low expression PD-L1 high expression
Time (mo)
A B
p=0.662 p=0.219
0 180
Overall survival
1.0
0.6
0.2 0.4 0.8
1.0
0.6
0.2 0.4 0.8
160 140 120 100 80 60 40
20 20 40 60 80 100 120 140 160 180
Time (mo)
0
Progression-free survival
Time (mo)
C D
p=0.037 p=0.233
0 180
Overall survival
1.0
0.6
0.2 0.4 0.8
1.0
0.6
0.2 0.4 0.8
160 140 120 100 80 60 40
20 10 20 30 40 50
Time (mo)
0
Progression-free survival
PD-L1 low expression PD-L1 high expression
PD-L1 low expression PD-L1 high expression PD-L1 low expression
PD-L1 high expression
PD-L1 low expression PD-L1 high expression
No. at risk
PD-L1 low expression 18 9 3 2 2 2 1 0
PD-L1 high expression 23 10 4 4 2 1 0 0
No. at risk
PD-L1 low expression 18 9 4 2 1 0
PD-L1 high expression 23 9 5 1 0 0
Fig. 5. PFS and OS curves stratified by the sensitivity to chemotherapy between high and low PD-L1 expression (yellow solid lines, PD-L1low; blue dotted lines, PD- L1high, respectively). (A) OS curves between high and PD-L1low in PS cases. (B) PFS curves between high and PD-L1low in PS cases. (C) OS curves between high and PD-L1low in PR cases. (D) PFS curves between high and PD-L1low in PR cases. Patients with PD-L1high revealed a worse OS and PFS compared with those with PD-L1low in PR cases, with significant differences observed.
OS, overall survival; PD-L1, programmed death-ligand 1; PD-L1high, high PD-L1 expression; PD-L1low, low PD-L1 expression; PFS, progression-free survival; PR, platinum-resistant; PS, platinum-sensitive.
Table 3. Multivariate Cox regression analysis with PFS and OS as endpoint
Factor PFS OS
HR 95% CI p-value HR 95% CI p-value
Pretreatment serum CA125 level (< 244 U/mL vs. ≥ 244 U/mL) 0.922 0.457–1.860 0.820 0.578 0.259–1.292 0.182
Ascitic fluid (positive vs. negative) 1.110 0.883–3.566 0.107 1.111 0.511–2.414 0.790
FIGO stage (advanced vs. early) 10.165 4.513–22.894 <0.001 14.323 4.744–43.240 <0.001
PD-L1 expression (high vs. low) 1.970 1.039–3.737 0.038 3.032 1.285–7.153 0.011
Tumor volume (<10 cm vs. ≥10 cm) 0.928 0.069–1.248 0.621 0.752 0.513–1.102 0.144
Residual disease (>1 cm vs. R0, ≤1 cm) 1.063 0.566–1.999 0.849 1.767 0.824–3.787 0.143
CI, confidence interval; FIGO, International Federation of Gynecology and Obstetrics; HR, hazard ratio; OS, overall survival; PD-L1, programmed death-ligand 1;
PFS, progression-free survival; R0, no visible residual disease.
demonstrated that cytoplasmic tumoral expression of PD-L1 was associated with a lower risk of specific death in triple-negative breast cancer (HR=0.45; p=0.035). Hamanishi et al. [18]
demonstrated the elevated proportion of high expression of PD-L1 in OCs and a significantly poorer prognosis in patients with higher expression than those with lower expression (p=0.016). Although they found that tumoral PD-L1 expression was an independent predictor of poor prognosis in OCs, this study investigated different histological subtypes of OCs. Our result also described an unfavorable prognostic impact of PD-L1high in OCCC, a specified histological subtype of ovarian carcinomas. However, a recent study showed a positive prognostic impact of PD-L1 expression in a cohort of 215 HGSOCs, which is in line with a recent study on a positive prognostic effect of PD-1 positive tumor infiltrating lymphocytes (TILs) in HGSOC [19,20]. These results also confirmed that the effect of PD-L1 on recurrence and survival should be separately investigated based on different histologic subtypes of tumor.
The fact that PD-L1 is expressed in OCCC and that this expression has unfavorable prognostic impact strongly suggest that the PD-L1 may be an applicable prognostic predictor and monitor for OCCC patients in clinical practice. Previous studies in an OC mouse model showed that response to PD-L1 blockade requires a preexisting adaptive immunity in tumors, and tumors without TILs failed to respond [31].This might make the anti-PD-L1 Abs available to OCCC. Anti-PD-L1 Abs have demonstrated durable responses in a number of different advanced malignancies. A phase I trial (NCT00729664) of BMS-936559, an anti-PD-L1 agent, showed that for the evaluable population, overall responses (ORs) were observed in patients with MEL (9/52), RCC (2/17), NSCLC (5/49), and OC (1/17). In 16 patients with ≥1 year of follow-up, stable disease (SD, ≥24 weeks) was observed in 14 patients with MEL, 6 patients with NSCLC, 3 patients with OC, and 7 patients with RCC [32]. Nivolumab, an anti-PD-1 antibody, demonstrated an efficacy in a proportion of relapsed PR OC patients, with the median PFS time was 3.5 months (95% CI=1.7–3.9 months), and the median OS time was 20.0 months [33]. In addition, the underlying mechanisms might be that in EOCs without lymphocyte infiltrates, PD-1/PD-L1 blockade is unlikely to be sufficient, and combinations will be required to mount a tumor-rejection adaptive immune response [34].
To our knowledge, this is the first report investigating PD-L1 expression and its correlation with clinicopathologic and prognostic characteristics in OCCC, a histologic subset of EOCs.
The limitation in this study was that PD-L1 expression in this study was detected only with IHC, and no any other method was used to verify the PD-L1 expression status. Additional researches on proteomic markers or PD-L1 transcriptional levels in cell lines are required to further understand the mechanism of PD-1/PD-L1 pathway in tumoral immune suppression.
Well-designed prospective studies with more patients are necessary in the future to clarify the associations between the expression levels of PD-L1 and the prognostic impact thereof.
In conclusion, the prognostic value of PD-L1 expression in OCCC patients might have the potential to enable more effective clinical approaches, including prognostic surveillance of patients and possible use of anti-PD-L1 Ab immunotherapy.
ACKNOWLEDGMENTS
We'd like to show our sincere gratitude to all the faculty members in our department and all the patients and their families involved in the current study.
REFERENCES
1. Siegel R, Naishadham D, Jemal A. Cancer statistics, 2012. CA Cancer J Clin 2012;62:10-29.
PUBMED | CROSSREF
2. Kurman RJ, Shih IM. The origin and pathogenesis of epithelial ovarian cancer: a proposed unifying theory. Am J Surg Pathol 2010;34:433-43.
PUBMED | CROSSREF
3. Takano M, Tsuda H, Sugiyama T. Clear cell carcinoma of the ovary: is there a role of histology-specific treatment? J Exp Clin Cancer Res 2012;31:53.
PUBMED | CROSSREF
4. Chan JK, Teoh D, Hu JM, Shin JY, Osann K, Kapp DS. Do clear cell ovarian carcinomas have poorer prognosis compared to other epithelial cell types? A study of 1411 clear cell ovarian cancers. Gynecol Oncol 2008;109:370-6.
PUBMED | CROSSREF
5. Ye S, Yang J, You Y, Cao D, Huang H, Wu M, et al. Comparison of clinical characteristic and prognosis between ovarian clear cell carcinoma and serous carcinoma: a 10-year cohort study of chinese patients.
PLoS One 2015;10:e0133498.
PUBMED | CROSSREF
6. Schnack TH, Høgdall E, Nedergaard L, Høgdall C. Demographic clinical and prognostic factors of primary ovarian adenocarcinomas of serous and clear cell histology-a comparative study. Int J Gynecol Cancer 2016;26:82-90.
PUBMED | CROSSREF
7. Chen BJ, Chapuy B, Ouyang J, Sun HH, Roemer MG, Xu ML, et al. PD-L1 expression is characteristic of a subset of aggressive B-cell lymphomas and virus-associated malignancies. Clin Cancer Res 2013;19:3462-73.
PUBMED | CROSSREF
8. Okazaki T, Honjo T. PD-1 and PD-1 ligands: from discovery to clinical application. Int Immunol 2007;19:813-24.
PUBMED | CROSSREF
9. Philips GK, Atkins M. Therapeutic uses of anti-PD-1 and anti-PD-L1 antibodies. Int Immunol 2015;27:39-46.
PUBMED | CROSSREF
10. Freeman GJ, Long AJ, Iwai Y, Bourque K, Chernova T, Nishimura H, et al. Engagement of the PD-1 immunoinhibitory receptor by a novel B7 family member leads to negative regulation of lymphocyte activation. J Exp Med 2000;192:1027-34.
PUBMED | CROSSREF
11. Thompson RH, Gillett MD, Cheville JC, Lohse CM, Dong H, Webster WS, et al. Costimulatory B7-H1 in renal cell carcinoma patients: Indicator of tumor aggressiveness and potential therapeutic target. Proc Natl Acad Sci U S A 2004;101:17174-9.
PUBMED | CROSSREF
12. Liu J, Hamrouni A, Wolowiec D, Coiteux V, Kuliczkowski K, Hetuin D, et al. Plasma cells from multiple myeloma patients express B7-H1 (PD-L1) and increase expression after stimulation with IFN-{gamma}
and TLR ligands via a MyD88-, TRAF6-, and MEK-dependent pathway. Blood 2007;110:296-304.
PUBMED | CROSSREF
13. Droeser RA, Hirt C, Viehl CT, Frey DM, Nebiker C, Huber X, et al. Clinical impact of programmed cell death ligand 1 expression in colorectal cancer. Eur J Cancer 2013;49:2233-42.
PUBMED | CROSSREF
14. Lyford-Pike S, Peng S, Young GD, Taube JM, Westra WH, Akpeng B, et al. Evidence for a role of the PD-1:
PD-L1 pathway in immune resistance of HPV-associated head and neck squamous cell carcinoma. Cancer Res 2013;73:1733-41.
PUBMED | CROSSREF
15. Chen YB, Mu CY, Huang JA. Clinical significance of programmed death-1 ligand-1 expression in patients with non-small cell lung cancer: a 5-year-follow-up study. Tumori 2012;98:751-5.
PUBMED
16. Shi SJ, Wang LJ, Wang GD, Guo ZY, Wei M, Meng YL, et al. B7-H1 expression is associated with poor prognosis in colorectal carcinoma and regulates the proliferation and invasion of HCT116 colorectal cancer cells. PLoS One 2013;8:e76012.
PUBMED | CROSSREF
17. Muenst S, Schaerli AR, Gao F, Däster S, Trella E, Droeser RA, et al. Expression of programmed death ligand 1 (PD-L1) is associated with poor prognosis in human breast cancer. Breast Cancer Res Treat 2014;146:15-24.
PUBMED | CROSSREF
18. Hamanishi J, Mandai M, Iwasaki M, Okazaki T, Tanaka Y, Yamaguchi K, et al. Programmed cell death 1 ligand 1 and tumor-infiltrating CD8+ T lymphocytes are prognostic factors of human ovarian cancer. Proc Natl Acad Sci U S A 2007;104:3360-5.
PUBMED | CROSSREF
19. Darb-Esfahani S, Kunze CA, Kulbe H, Sehouli J, Wienert S, Lindner J, et al. Prognostic impact of programmed cell death-1 (PD-1) and PD-ligand 1 (PD-L1) expression in cancer cells and tumor-infiltrating lymphocytes in ovarian high grade serous carcinoma. Oncotarget 2016;7:1486-99.
PUBMED | CROSSREF
20. Webb JR, Milne K, Nelson BH. PD-1 and CD103 are widely coexpressed on prognostically favorable intraepithelial CD8 T cells in human ovarian cancer. Cancer Immunol Res 2015;3:926-35.
PUBMED | CROSSREF
21. Böcker W. WHO classification of breast tumors and tumors of the female genital organs: pathology and genetics. Verh Dtsch Ges Pathol 2002;86:116-9.
PUBMED
22. Nomi T, Sho M, Akahori T, Hamada K, Kubo A, Kanehiro H, et al. Clinical significance and therapeutic potential of the programmed death-1 ligand/programmed death-1 pathway in human pancreatic cancer.
Clin Cancer Res 2007;13:2151-7.
PUBMED | CROSSREF
23. Abiko K, Mandai M, Hamanishi J, Yoshioka Y, Matsumura N, Baba T, et al. PD-L1 on tumor cells is induced in ascites and promotes peritoneal dissemination of ovarian cancer through CTL dysfunction.
Clin Cancer Res 2013;19:1363-74.
PUBMED | CROSSREF
24. Maine CJ, Aziz NH, Chatterjee J, Hayford C, Brewig N, Whilding L, et al. Programmed death ligand-1 over- expression correlates with malignancy and contributes to immune regulation in ovarian cancer. Cancer Immunol Immunother 2014;63:215-24.
PUBMED | CROSSREF
25. Tokito T, Azuma K, Kawahara A, Ishii H, Yamada K, Matsuo N, et al. Predictive relevance of PD-L1 expression combined with CD8+ TIL density in stage III non-small cell lung cancer patients receiving concurrent chemoradiotherapy. Eur J Cancer 2016;55:7-14.
PUBMED | CROSSREF
26. Zhang Y, Kang S, Shen J, He J, Jiang L, Wang W, et al. Prognostic significance of programmed cell death 1 (PD-1) or PD-1 ligand 1 (PD-L1) Expression in epithelial-originated cancer: a meta-analysis. Medicine (Baltimore) 2015;94:e515.
PUBMED | CROSSREF
27. Lussier DM, Johnson JL, Hingorani P, Blattman JN. Combination immunotherapy with α-CTLA-4 and α-PD-L1 antibody blockade prevents immune escape and leads to complete control of metastatic osteosarcoma. J Immunother Cancer 2015;3:21.
PUBMED | CROSSREF
28. Tjin EP, Krebbers G, Meijlink KJ, van de Kasteele W, Rosenberg EH, Sanders J, et al. Immune-escape markers in relation to clinical outcome of advanced melanoma patients following immunotherapy.
Cancer Immunol Res 2014;2:538-46.
PUBMED | CROSSREF
29. Kluger HM, Zito CR, Barr ML, Baine MK, Chiang VL, Sznol M, et al. Characterization of PD-L1 expression and associated T-cell infiltrates in metastatic melanoma samples from variable anatomic sites. Clin Cancer Res 2015;21:3052-60.
PUBMED | CROSSREF
30. Beckers RK, Selinger CI, Vilain R, Madore J, Wilmott JS, Harvey K, et al. Programmed death ligand 1 expression in triple-negative breast cancer is associated with tumour-infiltrating lymphocytes and improved outcome. Histopathology 2016;69:25-34.
PUBMED | CROSSREF
31. Duraiswamy J, Freeman GJ, Coukos G. Therapeutic PD-1 pathway blockade augments with other modalities of immunotherapy T-cell function to prevent immune decline in ovarian cancer. Cancer Res 2013;73:6900-12.
PUBMED | CROSSREF
32. Brahmer JR, Tykodi SS, Chow LQ, Hwu WJ, Topalian SL, Hwu P, et al. Safety and activity of anti-PD-L1 antibody in patients with advanced cancer. N Engl J Med 2012;366:2455-65.
PUBMED | CROSSREF
33. Hamanishi J, Mandai M, Ikeda T, Minami M, Kawaguchi A, Murayama T, et al. Safety and antitumor activity of anti-PD-1 antibody, nivolumab, in patients with platinum-resistant ovarian cancer. J Clin Oncol 2015;33:4015-22.
PUBMED | CROSSREF
34. Homicsko K, Coukos G. Targeting programmed cell death 1 in ovarian cancer. J Clin Oncol 2015;33:3987-9.
PUBMED | CROSSREF