ABSTRACT
Purpose: The programmed death ligand 1 (PD-L1) SP142 assay with a 1% immune cell (IC)
cutoff is approved for the selection of advanced triple-negative breast cancer (TNBC) patients for atezolizumab treatment. We aimed to evaluate the interobserver concordance of PD-L1 scoring and inter-assay variability of various PD-L1 assays in TNBC.
Methods: Thirty patients with primary TNBC were selected, and SP142, SP263, 22C3, and
E1L3N assays were performed. PD-L1 staining in ICs and tumor cells (TCs) was scored by 10 pathologists who were blinded to the assay. The interobserver concordance among pathologists and the inter-assay variability of the four PD-L1 assays were analyzed. For SP142, the intraobserver concordance among the six pathologists was analyzed after training.
Results: The adjusted means of PD-L1 IC scoring ranged from 6.2% to 12.9% for the four
assays; the intraclass correlations showed moderate (0.584–0.649) reader concordance. The PD-L1 IC scoring with a 1% cutoff resulted in identical scoring in 40.0%–66.7% of cases and a poor to moderate agreement (Fleiss κ statistic [FKS] = 0.345–0.534) for the four assays. The SP142 assay had the widest range of positive rate (56.5%–100.0%), lowest number of cases with identical scoring, and lowest FKS at 1% cutoff. Pairwise comparison of adjusted means showed significantly decreased PD-L1 staining in SP142 compared with the other assays in both ICs and TCs. As for the intraobserver concordance in the SP142 assay, the overall percent agreement was 87.8% with a 1% IC cutoff. After training, the proportion of cases with identical scoring at a 1% IC cutoff increased to 70.0%; the FKS also increased to 0.610.
Conclusion: The concordance of PD-L1 IC scoring among pathologists was low, at the 1%
cutoff for the SP142 assay without training. SP142 showed the lowest PD-L1 expression in both IC and TC.
Original Article
Received: Feb 27, 2021 Revised: Apr 21, 2021 Accepted: May 23, 2021 Correspondence to So Yeon Park
Department of Pathology, Seoul National University Bundang Hospital, 82 Gumi-ro 173-beon-gil, Bundang-gu, Seongnam 13620, Korea.
E-mail: [email protected]
© 2021 Korean Breast Cancer Society This is an Open Access article distributed under the terms of the Creative Commons Attribution Non-Commercial License (https://
creativecommons.org/licenses/by-nc/4.0/) which permits unrestricted non-commercial use, distribution, and reproduction in any medium, provided the original work is properly cited.
ORCID iDs Soomin Ahn
https://orcid.org/0000-0002-1979-4010 Ji Won Woo
https://orcid.org/0000-0003-1659-7123 Hyojin Kim
https://orcid.org/0000-0001-9201-8328 Eun Yoon Cho
https://orcid.org/0000-0001-5849-3600 Ahrong Kim
https://orcid.org/0000-0003-2317-8920 Jee Yeon Kim
https://orcid.org/0000-0002-0503-984X Chungyeul Kim
https://orcid.org/0000-0002-9636-5228 Hee Jin Lee
https://orcid.org/0000-0002-4963-6603 Ji Shin Lee
https://orcid.org/0000-0003-4634-2228
Soomin Ahn
1,2, Ji Won Woo
1, Hyojin Kim
1, Eun Yoon Cho
2, Ahrong Kim
3, Jee Yeon Kim
3, Chungyeul Kim
4, Hee Jin Lee
5, Ji Shin Lee
6,
Young Kyung Bae
7, Youngmee Kwon
8, Wan Seop Kim
9, So Yeon Park
11 Department of Pathology, Seoul National University Bundang Hospital, Seoul National University College of Medicine, Seongnam, Korea
2 Department of Pathology, Samsung Medical Center, Sungkyunkwan University School of Medicine, Seoul, Korea
3Department of Pathology, School of Medicine, Pusan National University, Busan, Korea
4Department of Pathology, College of Medicine, Korea University, Seoul, Korea
5Department of Pathology, University of Ulsan College of Medicine, Asan Medical Center, Seoul, Korea
6Department of Pathology, Chonnam National University Medical School, Gwangju, Korea
7Department of Pathology, Yeungnam University College of Medicine, Daegu, Korea
8Department of Pathology, National Cancer Center, Goyang, Korea
9Department of Pathology, Konkuk University School of Medicine, Seoul, Korea
Programmed Death Ligand 1
Immunohistochemistry in Triple-
Negative Breast Cancer: Evaluation
of Inter-Pathologist Concordance and
Inter-Assay Variability
Young Kyung Bae
https://orcid.org/0000-0002-6689-9413 Youngmee Kwon
https://orcid.org/0000-0002-1370-2496 Wan Seop Kim
https://orcid.org/0000-0001-7704-5942 So Yeon Park
https://orcid.org/0000-0002-0299-7268 Funding
This study was supported by a grant from the National Research Foundation of Korea (NRF)'s Basic Science Research Program to Park SY by the Ministry of Science, ICT and Future Planning (Grant No. NRF- 2018R1A2B6005559) and a grant from Seoul National University Foundation, Inc. to Park SY.
Conflict of Interest
The authors declare that they have no competing interests.
Author Contributions
Conceptualization: Kim H, Park SY; Formal analysis: Ahn S, Woo JW; Resources: Cho EY, Kim A, Kim JY, Kim C, Lee HJ, Lee JS, Bae YK, Kwon Y, Kim WS; Supervision: Park SY;
Writing - original draft: Ahn S; Writing - review
& editing: Park SY.
Keywords: B7-H1 antigen; Immune checkpoint inhibitors; Immunohistochemistry;
Observer variation; Triple negative breast cancer
INTRODUCTION
Immune checkpoint inhibitors targeting the programmed death 1 (PD-1)/programmed death ligand 1 (PD-L1) pathway have become a part of the standard of care in patients with several advanced-stage cancers. PD-L1 expression evaluated through immunohistochemistry (IHC) is used as a crucial biomarker for predicting the response to anti-PD-1/PD-L1 agents in some solid tumors [1]. In breast cancer, the addition of atezolizumab to nab-paclitaxel has shown a clinical benefit in patients with metastatic or locally advanced triple-negative breast cancer (TNBC) with PD-L1 expression in immune cells (ICs) in ≥ 1% of the tumor area [2]. In order to select patients for atezolizumab treatment, the United States Food and Drug Administration (FDA) approved the Ventana SP142 assay as a companion test [3].
The FDA companion test documentation for SP142 in TNBC showed high inter-laboratory reproducibility with nearly 95% overall percent agreement (OPA) between two readers for ICs at a 1% cutoff in central laboratories [3]. However, concerns have been raised regarding the variability of interobserver reproducibility in actual practice. Although the inter-pathologist concordance for the assessment of PD-L1 in tumor cells (TCs) is high, the concordance rate has been lower for IC evaluation in many tumors [4-7]. According to some recent studies on TNBC, the scoring of ICs revealed poor reproducibility among multiple pathologists [8-10].
Currently, four standardized PD-L1 IHC assays (22C3, 28-8, SP142, and SP263) have been developed specifically for pembrolizumab, nivolumab, atezolizumab, and durvalumab, respectively. Even in breast cancer alone, several ongoing clinical trials have been conducted, each with a different companion or complementary PD-L1 assay [6,11,12]. These assays employ different antibody clones, staining platforms, staining protocols, scoring methods, and cutoffs, causing confusion among pathologists and clinicians alike. In addition, not all platforms were available in all laboratories. Therefore, efforts have been made to harmonize PD-L1 assays for lung cancer [13]. However, in TNBC, there is a relative lack of studies evaluating the inter-assay variability of PD-L1 assays. Here, we aimed to evaluate the interobserver concordance of PD-L1 scoring among 10 pathologists using 30 TNBC resection specimens. For SP142, the intraobserver concordance was also analyzed after training. In addition, we tested the inter-assay variability of the three FDA-approved PD-L1 assays (SP142, SP263, and 22C3) and one research use-only antibody (E1L3N).
METHODS
Case selection and study design
We reviewed the histological slides of patients with TNBC that were at least 0.5 cm in size and were surgically resected without neoadjuvant chemotherapy at Seoul National University Bundang Hospital between 2018 and 2019. From these patients, we selected 30 with well-fixed tumors and had tumor-infiltrating lymphocytes in part of the tumor. The amount of tumor-infiltrating lymphocytes ranged from 5% to 80%, with a mean of 35%.
The tissue samples were stained with four PD-L1 assays (SP142, SP263, 22C3, and E1L3N)
using a single representative tumor block. Four PD-L1 stained slides and the corresponding
hematoxylin and eosin slides were scanned using a high-resolution digital slide scanner at
200× magnification (3DHISTECH Pannoramic 250; 3DHISTECH Ltd., Budapest, Hungary), and the slides were evaluated using Collibio software (Pixcelldata Ltd., Dublin, Ireland) by 10 experienced breast pathologists from eight different institutions in South Korea. The participating pathologists had a mean of 16.8 years of experience (range: 6–26 years). This study was exempted from Institutional Review Board (IRB) deliberation (IRB no. X-2006-621- 901), and the requirement for obtaining an informed consent was waived.
IHC
All 30 TNBC cases were negative for estrogen receptor (ER) and progesterone (PR) expression (< 1% nuclear staining) as well as human epidermal growth factor receptor 2 (HER2). In cases with equivocal (2+) HER2 staining, negative HER2 status was confirmed by HER2 silver in situ hybridization. The following antibodies were used: ER (1:100; clone SP1; LabVision, Fremont, USA), PR (1:70; PgR 636; Dako, Carpinteria, USA), and HER2 (ready to use; 4B5;
Ventana Medical Systems, Tucson, USA).
Four PD-L1 assays were performed for each case. Formalin-fixed, paraffin-embedded tissue sections (4 µm thick) were dried at 60°C for 30 minutes. The PharmDx assay (Dako) involved staining with an anti-PD-L1 22C3 mouse monoclonal primary antibody and was performed using the EnVision FLEX visualization system (Agilent, Santa Clara, USA) on an Autostainer Link 48 system (Dako), along with positive and negative controls, as per the manufacturer's instructions [14]. For the SP142 assay, the sections were stained with an anti-PD-L1 (SP142) rabbit monoclonal primary antibody using the OptiView DAB IHC Detection Kit (Ventana Medical Systems, Tucson, USA), followed by the OptiView Amplification Kit on the Ventana BenchMark XT automated platform (Ventana Medical Systems) [14]. For the SP263 assay, the sections were stained with anti-PD-L1 (SP263) rabbit monoclonal primary antibody using the OptiView DAB IHC Detection on the Ventana BenchMark XT automated staining platform [14]. For the E1L3N assay, the sections were stained with an anti-PD-L1 (E1L3N) rabbit XP monoclonal primary antibody (1:100; Cell Signaling Technology, Danvers, USA) using the OptiView DAB IHC Detection Kit on the Ventana BenchMark XT automated platform [14].
Scoring of PD-L1 assays
The type of PD-L1 assay was anonymized, and PD-L1 expression was evaluated in both ICs and TCs with no special training other than following the manufacturer's instructions (Ventana PD-L1 assay interpretation guideline). The ICs were scored as the proportion of tumor area covered with any discernible PD-L1 staining of any intensity. The ICs that were counted included lymphocytes, macrophages, dendritic cells, and granulocytes. The tumor area was defined as the area occupied by TCs, as well as their associated intratumoral and contiguous peritumoral stroma. For TCs, positive PD-L1 staining was defined as complete and/or partial circumferential linear cellular membrane staining at any intensity that could be differentiated from the background and diffuse cytoplasmic staining, as previously described [15]. The ICs and TCs were scored in both continuous scores (0%–100%) and five categorical scores (< 1%, 1%–4%, 5%–9%, 10%–49%, and ≥ 50%). For 22C3, the combined positive score (CPS) was also calculated by dividing the number of PD-L1-stained cells (TCs and ICs) by the total number of viable TCs and multiplying the value by 100 [16].
To evaluate the intraobserver reproducibility and the impact of training, six participating
pathologists, who were trained in scoring SP142 in TNBC after the first assessment, re-
evaluated the SP142 assays. Training consisted of presentation covering the biology of PD-L1,
development of the assay, cellular expression, and demonstration of PD-L1 interpretation in the clinical samples of TNBC in a half day.
Statistical analysis
Statistical analysis was performed using SAS version 9.4 (SAS Institute, Cary, USA) and R 3.6.1 (Vienna, Austria; http://www.R-project.org/) with the “irr” and “psych” packages. For statistical analyses, a score of less than 1% was regarded as 0%. The intraclass correlation coefficient (ICC) was used to assess the interobserver variability for continuous scores of both ICs and TCs. The Fleiss κ statistic (FKS) was used to assess the interobserver variability for categorical scores after dichotomization based on the cutoff values of 1%, 10%, and 50%.
The FKSs and ICCs below 0.50 were considered poor, those between 0.50 and 0.75 were considered moderate, those between 0.75 and 0.90 were considered good, and those above 0.90 were considered excellent. To assess the inter-assay variability, we initially determined the mean score of the 10 pathologists for each assay and compared each antibody in pairwise comparisons to show the mean difference of each antibody; then, the Wilcoxon signed rank test and a mixed effects model were used to determine the statistical significance. The intraobserver reproducibility was assessed using pairwise comparisons and OPA. Statistical significance was set at p < 0.05.
RESULTS
Interobserver concordance of PD-L1 scores in ICs
Table 1 summarizes the PD-L1 IC scores measured by continuous variables and their
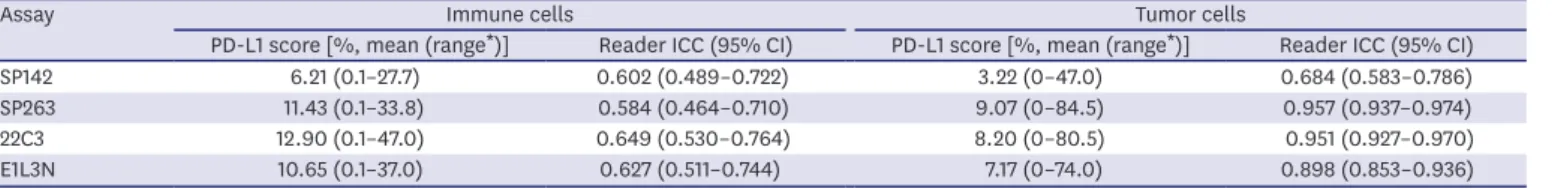
interobserver concordance. The PD-L1 IC scores for each tumor reported by the 10 pathologists using the four assays are presented in Figure 1. The mean values of PD-L1 IC scores of the 30 cases evaluated by 10 pathologists were 12.90% (range of mean scores, 0.1%–47.0%) for 22C3, 11.43% (0.1%–33.8%) for SP263, 10.65% (0.1%–37.0%) for E1L3N, and 6.21% (0.1%–27.7%) for SP142. The ICC of 30 cases evaluated by 10 pathologists was in the moderate range in all four assays. The highest ICC was 0.649 (95% confidence interval [CI], 0.530–0.764) for 22C3, followed by 0.627 (95% CI, 0.511–0.744) for E1L3N, 0.602 (95%
CI, 0.489–0.722) for SP142, and 0.584 (95% CI, 0.464–0.710) for SP263.
Next, the interobserver concordance at 1%, 10%, and 50% cutoffs among the 10 pathologists was analyzed; the results are summarized in Table 2. At the 1% cutoff, the positive rate by mean scores was lowest in the SP142 assay: 80.0% for SP142, 86.7% for E1L3N, 93.3% for SP263, and 93.3% for 22C3. The mean positive rates assessed by each pathologist at a 1%
cutoff were as follows: 81.7% (range, 56.7%–100.0%) for SP142, 88.0% (76.7%–100.0%) for SP263, 87.7% (73.3%–96.7%) for 22C3, and 82.3% (63.3%–93.3%) for E1L3N. The proportions of cases with identical scoring at 1% cutoff were 40.0% for SP142, 66.7% for SP263 and 22C3, and 53.3% for E1L3N. The OPA between two pathologists for the SP142 assay
Table 1. Mean value and ICC of PD-L1 scores using four assaysAssay Immune cells Tumor cells
PD-L1 score [%, mean (range*)] Reader ICC (95% CI) PD-L1 score [%, mean (range*)] Reader ICC (95% CI)
SP142 6.21 (0.1–27.7) 0.602 (0.489–0.722) 3.22 (0–47.0) 0.684 (0.583–0.786)
SP263 11.43 (0.1–33.8) 0.584 (0.464–0.710) 9.07 (0–84.5) 0.957 (0.937–0.974)
22C3 12.90 (0.1–47.0) 0.649 (0.530–0.764) 8.20 (0–80.5) 0.951 (0.927–0.970)
E1L3N 10.65 (0.1–37.0) 0.627 (0.511–0.744) 7.17 (0–74.0) 0.898 (0.853–0.936)
PD-L1 = programmed death ligand 1; ICC = intraclass correlation coefficient; CI = confidence interval.
*
Range of mean scores.at a 1% cutoff was additionally analyzed and ranged from 56.7% to 96.7%, with a mean of 80.3%. Of the four assays, SP142 showed a poor level of agreement with the lowest FKS value (0.345) at a 1% cutoff. Although SP263 (FKS = 0.460) and 22C3 (FKS = 0.442) also showed a poor level of agreement at a 1% cutoff, E1L3N showed a moderate range of agreement (FKS
A
SP142PD-L1 IC score
0
T29 T28
25 50
T23T15T21T12 T9 T14T11T16T24T30 T3 T8 T7 T10 T6 T20T13 T1 T26T17T19T22 T4 T5 T25T18T27 T2
100 75
B
SP263PD-L1 IC score
0
T29 T28
25 50
T23T12T21T15 T9 T14T11T16T24T27T22T30T26 T8 T10 T7 T20 T3 T6 T13T25T19T17 T1 T4 T18 T5 T2
100 75
D
E1L3NPD-L1 IC score
0
T12 T5
25 50
T29T23T15T21 T9 T22T30T24T16T11T14T26 T6 T27 T8 T10T20T25T13 T7 T17T19 T1 T3 T4 T18 T2 T28
100 75
C
22C3PD-L1 IC score
0
T23 T5
25 50
T12T21T29T15T24T22T11T14T20T27 T9 T30T16T26T10T19 T8 T3 T6 T25 T7 T13 T1 T18T17 T4 T2 T28
100 75
Figure 1. Box plots of PD-L1 immune cell scores in each tumor assessed by 10 pathologists using four PD-L1 assays. (A) SP142, (B) SP263, (C) 22C3, and (D) E1L3N.
PD-L1 = programmed death ligand 1.
Table 2. Positive rate, proportion of cases with identical scoring, and Fleiss κ statics of programmed death ligand 1 score at 1%, 10%, and 50% cutoffs using four assays
Assay Immune cells Tumor cells
1% cutoff 10% cutoff 50% cutoff 1% cutoff 10% cutoff 50% cutoff
Positive rate by mean score
SP142 24/30 (80.0%) 5/30 (16.7%) 0/30 (0%) 6/30 (20.0%) 3/30 (10.0%) 0/30 (0%)
SP263 28/30 (93.3%) 15/30 (50.0%) 0/30 (0%) 16/30 (53.3%) 5/30 (16.7%) 3/30 (10.0%)
22C3 28/30 (93.3%) 14/30 (46.7%) 0/30 (0%) 15/30 (50.0%) 4/30 (13.3%) 2/30 (6.7%)
E1L3N 26/30 (86.7%) 16/30 (53.3%) 0/30 (0%) 15/30 (50.0%) 3/30 (10.0%) 2/30 (6.7%)
Positive rate by each pathologist (%, mean [range])
SP142 81.7 (56.7–100.0) 25.0 (13.3–40.0) 0.3 (0–3.3) 18.0 (10.0–30.0) 8.0 (3.3–16.7) 2.3 (0–6.7) SP263 88.0 (76.7–100.0) 41.7 (3.3–73.3) 1.3 (0–3.3) 46.3 (23.3–53.3) 16.0 (10.0–23.3) 9.3 (6.7–10.0) 22C3 87.7 (73.3–96.7) 48.7 (16.7–80.0) 3.0 (0–10.0) 45.3 (23.3–63.3) 17.0 (10.0–26.7) 6.7 (6.7) E1L3N 82.3 (63.3–93.3) 45.0 (13.3–73.3) 2.7 (0–6.7) 39.0 (16.7–46.7) 14.7 (10.0–23.3) 6.7 (3.3.–10.0) Proportion of cases with identical scoring
SP142 12/30 (40.0%) 17/30 (56.7%) 29/30 (96.7%) 19/30 (63.3%) 26/30 (86.7%) 28/30 (93.3%)
SP263 20/30 (66.7%) 8/30 (26.7%) 28/30 (93.3%) 15/30 (50.0%) 24/30 (80.0%) 29/30 (96.7%)
22C3 20/30 (66.7%) 6/30 (20.0%) 27/30 (90.0%) 13/30 (43.3%) 22/30 (73.3%) 30/30 (100.0%)
E1L3N 16/30 (53.3%) 12/30 (40.0%) 27/30 (90/0%) 13/30 (43.3%) 23/30 (76.7%) 28/30 (93.3%)
Fleiss κ statistic
SP142 0.345 0.492 Not available* 0.659 0.627 0.464
SP263 0.460 0.440 Not available* 0.653 0.713 0.930
22C3 0.442 0.377 Not available* 0.591 0.688 1.000
E1L3N 0.534 0.502 Not available* 0.572 0.698 0.893
*Impossible to estimate due to the small number of positive cases.
= 0.534). The positive rate, proportion of cases with identical scoring, and FKS varied at 10%
and 50% cutoffs across the four assays.
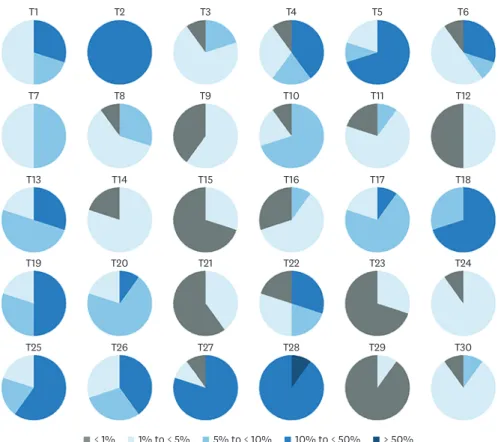
PD-L1 IC staining by SP142 assay in each tumor evaluated by categorical scores is shown in
Figure 2. The PD-L1 IC score belonged to one category in 1 (3.3%) case, two categories in11 (36.7%) cases, three categories in 15 (50%) cases, and four (13.3%) categories in 3 cases.
As the SP142 assay is currently approved as a companion diagnostic method for selecting patients for atezolizumab treatment, the interobserver variability of the SP142 assay was analyzed in depth, and the IHC slides for the discordant cases at 1% cutoff were reviewed.
The primary reason for the discordance was the difference in the interpretation of 1%
positivity among pathologists. All cases exhibited PD-L1-positive ICs in at least a few cells.
Although some pathologists considered it 1% positive when any IC was present, others gave it 1% positivity only when a considerable number of positive ICs compatible with 1% were present (Figure 3). In some cases, it was difficult to distinguish the ICs from TCs. The results of PD-L1 IC staining using the other assays for each tumor assessed by categorical scores are shown in Supplementary Figure 1.
Inter-assay variability of PD-L1 IC scoring between four assays
To analyze the inter-assay variability, we used the mean scores of the 10 pathologists for each assay and then compared each assay in pairwise comparisons to show the mean difference between the other assays (Table 3; Supplementary Figure 2). Of the four assays, SP142 showed the lowest IC score. The E1L3N and SP263 assays were not statistically different, and the SP142 assay showed the greatest difference compared with the other three assays. SP142
T1 T2 T3 T4 T5 T6
T7 T8 T9 T10 T11 T12
T13 T14 T15 T16 T17 T18
T19 T20 T21 T22 T23 T24
T25 T26 T27 T28 T29 T30
< 1% 1% to < 5% 5% to < 10% 10% to < 50% ≥ 50%
Figure 2. Categorical estimation of programmed death ligand 1 immune cell scores in each tumor using SP142 assay.
showed a significantly lower number of ICs than SP263 (mean difference: −5.21%; p < 0.001), 22C3 (mean difference: −6.69%; p < 0.001), and E1L3N (mean difference: −5.18%; p < 0.001).
At a 1% cutoff for ICs, all SP142-positive cases were also positive for SP263, 22C3, and E1L3N.
The numbers of SP142 (−) SP263 (+), SP142 (−) 22C3 (+), and SP142 (−) E1L3N (+) cases at 1%
cutoff were 4 (12.9%), 4 (12.9%), and 2 (6.5%), respectively (Supplementary Figure 3).
Interobserver concordance of PD-L1 scores in TCs
The PD-L1 TC scores in each tumor evaluated by 10 pathologists using the four assays are presented in Figure 4. The mean values of PD-L1 TC scores of 30 cases evaluated by 10 pathologists were 9.07% (range of mean scores, 0%–84.5%) for SP263, 8.20% (0%–80.5%) for 22C3, 7.17% (0%–74.0%) for E1L3N, and 3.22% (range 0%–47.0%) for SP142 (Table 1).
A
B
Figure 3. Representative image of PD-L1 staining by SP142 assay. (A) A case (T2) with PD-L1 staining on immune cells in 10% to 50% of tumor area (average, 19%), resulting in complete agreement at 1% immune cell cutoff among 10 pathologists. (B) A case (T12) showing PD-L1 staining in a few immune cells (T12). This case shows an overall percentage agreement of 50% at 1% immune cell cutoff among 10 pathologists.
PD-L1 = programmed death ligand 1.
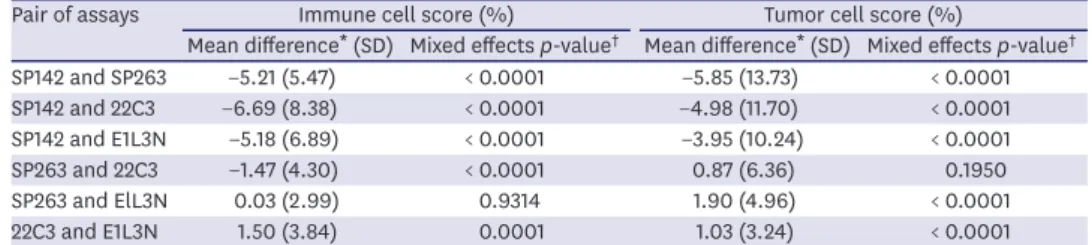
Table 3. Pairwise comparison of programmed death ligand 1 scores of the four assays
Pair of assays Immune cell score (%) Tumor cell score (%)
Mean difference* (SD) Mixed effects p-value† Mean difference* (SD) Mixed effects p-value† SP142 and SP263 −5.21 (5.47) < 0.0001 −5.85 (13.73) < 0.0001
SP142 and 22C3 −6.69 (8.38) < 0.0001 −4.98 (11.70) < 0.0001
SP142 and E1L3N −5.18 (6.89) < 0.0001 −3.95 (10.24) < 0.0001
SP263 and 22C3 −1.47 (4.30) < 0.0001 0.87 (6.36) 0.1950
SP263 and ElL3N 0.03 (2.99) 0.9314 1.90 (4.96) < 0.0001
22C3 and E1L3N 1.50 (3.84) 0.0001 1.03 (3.24) < 0.0001
SD = standard deviation.
*Mean difference of 30 cases assessed by 10 pathologists; †mixed-effects linear model (pathologists as random effects) after log-transformation.
SP142 showed the lowest mean TC value. Overall, the ICCs among 10 pathologists in TCs were higher than those in ICs (Table 1). The ICC was lowest in the SP142 assay (ICC = 0.684).
E1L3N showed good concordance (ICC = 0.898), while 22C3 (ICC = 0.951) and SP263 (ICC = 0.957) revealed excellent levels of concordance.
At the 1% cutoff, the positivity rates for TC were 20.0% for SP142, 53.3% for SP263, 50.0% for 22C3, and 50.0% for E1L3N based on the mean scores of 10 pathologists. The mean positivity rates for TCs by each pathologist at 1% cutoff were as follows: 18.0% (10.0%–30.0%) for SP142, 46.3% (23.3%–53.3%) for SP263, 45.3% (23.3%–63.3%) for 22C3, and 39.0% (16.7%–
46.7%) for E1L3N. The proportion of cases with identical scoring at a 1% cutoff was highest in SP142 (63.3%), followed by SP263 (50.0%), 22C3 (43.3%), and E1L3N (43.3%). The FKS scores in TC were mostly higher than those in ICs at the 1%, 10%, and 50% cutoffs (Table 2).
Inter-assay variability of PD-L1 TC scoring between four assays
The results of the pairwise comparison of PD-L1 expression in TCs are summarized in Table 3.
Of the four assays, SP142 showed the lowest value. SP263 and 22C3 assays showed no statistical difference, while the SP142 assay showed the greatest level of difference with the other three assays. The expression of SP142 in TCs were significantly lower than those of SP263 (mean difference: −5.85%; p < 0.001), 22C3 (mean difference: −4.98%; p < 0.001), and E1L3N (mean difference: −3.95%; p < 0.001). The CPS using 22C3 assay ranged from 0 to 95 with a mean CPS of 21.
Intraobserver concordance of PD-L1 scoring in ICs and TCs
After training, 30 samples were re-assessed by six participating pathologists, resulting in 180 pairwise comparisons (Table 4). The OPA between the two assessments for the SP142 assay
A
SP142PD-L1 TC score
0
T1 T5
25 50
T10T11T13T16T17T19T21T23T24T28T29 T3 T4 T6 T8 T9 T12T14T15T20T30 T7 T26 T2 T25T18T22T27
100 75
B
SP263PD-L1 TC score
0
T1 T27
25 50
T13T21T23T24T28T29 T8 T9 T11 T3 T16T19T17T10T30T15T26 T4 T7 T6 T20T12T25T14 T2 T18T22 T5
100 75
D
E1L3NPD-L1 TC score
0
T1 T27
25 50
T13T17T19T21T23T24T28T29 T9 T11 T8 T10T16T30T26T15 T4 T6 T12T20 T7 T3 T25T14 T2 T18T22 T5
100 75
C
22C3PD-L1 TC score
0
T1 T5
25 50
T11T19T21T23T28 T9 T3 T8 T24T13T16T29T30T10T17T15T26T20T12 T4 T6 T25T14 T7 T18 T2 T22T27
100 75
Figure 4. Box plots of PD-L1 tumor cell scores in each tumor assessed by 10 pathologists using four PD-L1 assays (A. SP142, B. SP263, C. 22C3, and D. E1L3N).
PD-L1 = programmed death ligand 1.
at a 1% IC cutoff was 87.8% (95% CI, 82.2%–91.8%). The OPA at the 10% and 50% IC cutoffs was 81.1% and 98.3%, respectively. The OPA at a 1% TC cutoff was 87.2% (95% CI, 81.6%–
91.3%). The OPA at the 10% TC cutoff was higher than that in IC.
To evaluate the impact of training on interobserver concordance, results of assessments performed before and after training were compared. The proportion of cases with identical scoring at a 1% IC cutoff increased from 40.0% to 70.0% after training. The FKS also increased from 0.345 to 0.610 at a 1% IC cutoff (Supplementary Table 1).
DISCUSSION
In this study, we evaluated the interobserver concordance and inter-assay variability of PD- L1 scoring for ICs and TCs in 30 primary TNBC samples. First, regarding the interobserver concordance in IC scoring, the ICC for the four assays showed moderate reader concordance (0.584–0.649). The ICC for SP142 was 0.602. When a 1% cutoff was applied to ICs, the proportion of cases with identical scoring ranged from 40.0% to 66.7%, and a poor to moderate agreement (FKS = 0.345–0.534) was reached for the four assays. In particular, the SP142 assay showed the widest range of positive rate by each pathologist and the lowest proportion of cases with identical scoring and the lowest FKS at a 1% cutoff. By contrast, in TC scoring, a moderate to excellent (ICC, 0.684–0.957) reader concordance was reached among the pathologists for the four assays. The values of FKS in TCs were mostly higher than those in ICs.
Interobserver concordance is a major issue in the reliable assessment of PD-L1 expression in tumors for the proper management of patients [6]. The interobserver concordance is high for TCs and low for ICs in multiple tumor types, regardless of the type of assay [4,6,17,18].
We also observed a low interobserver concordance in IC scoring in TNBC, similar to other tumor types. The FDA companion test documentation for SP142 in TNBC showed high inter- laboratory reproducibility with nearly 95% overall OPA between two readers for ICs (at 1%
cutoff ) in central laboratories [3]. However, recent studies on TNBC have revealed that the concordance rate may not be as high in a real clinical setting. In previous studies on TNBC, the ICCs of ICs using SP142 were 0.560, 0.805, and 0.956 [7-9], and OPA ranged from 41%
to 98% [3,7,8,19]. Notably, according to a recent study conducted by 19 pathologists who did not receive special training similar to our study, the OPA for SP142 assay reached a low plateau of 41% in 9 observers by Observers Needed to Evaluate Subjective Tests (ONEST) plots [8]. In our study, ICC of ICs for SP142 assay was 0.602, and the OPA between two
Table 4. Intra-observer reproducibility of programmed death ligand 1 scoring in immune cells and tumor cells using SP142 assayVariables Immune cells Tumor cells
1% cutoff (n = 180) 10% cutoff (n = 180) 50% cutoff (n = 180) 1% cutoff (n = 180) 10% cutoff (n = 180) 50% cutoff (n = 180) Results of pairwise comparison*
Negative-Negative 28 (15.6%) 116 (64.4%) 177 (98.3%) 137 (76.1%) 163 (90.6%) 174 (96.7%)
Negative-Positive 15 (8.3%) 30 (16.7%) 2 (1.1%) 6 (3.3%) 0 (0.0%) 0 (0.0%)
Positive-Negative 7 (3.9%) 4 (2.2%) 1 (0.6%) 17 (9.4%) 3 (1.7%) 4 (2.2%)
Positive-Positive 130 (72.2%) 30 (16.7%) 0 (0.0%) 20 (11.1%) 14 (7.8%) 2 (1.1%)
Measures of agreement
OPA (95% CI) 87.8%
(82.2%–91.8%) 81.1%
(74.8%–86.2%) 98.3%
(95.2%–99.4%) 87.2%
(81.6%–91.3%) 98.3%
(95.2%–99.4%) 97.8%
(94.4%–99.1%) OPA = overall percent agreement; CI = confidence interval.
*Results are given in the order: First assessment-Second assessment.
pathologists at a 1% cutoff ranged from 56.7% to 96.7% with a mean of 80.3%. In addition, at a 1% cutoff, the positive rate of SP142 evaluated by each pathologist ranged from 56.7% to 100.0%, and the proportion of cases with identical scoring was 40.0%. Similar to our study, Reisenbichler et al. [8] also reported that the positive interpretation of PD-L1 with the SP142 assay ranged from 41% to 81% for each pathologist, and only 38% of cases showed complete concordance in two categories (< 1% vs. ≥ 1%). In summary, the interobserver concordance of PD-L1 expression in ICs in TNBC did not appear to be high in the real-world setting. In a review of our discordant cases of SP142 scoring in ICs (at 1% cutoff ), the main reason for the discordance involved the interpretation of the 1% criterion. The 1% cutoff criterion can be subjective among the pathologists.
To further evaluate the intraobserver concordance, samples used in the SP142 assay were re-assessed by six participating pathologists after training. The OPA between the two assessments at 1% IC cutoff was 87.8% (95% CI, 82.2%–91.8%). To evaluate the impact of training on interobserver concordance, results of assessments performed before and after training were compared. The proportion of cases with identical scoring increased by 30%, and the FKS also increased from 0.345 to 0.610 at a 1% IC cutoff. Our data suggest that training can improve the consistency of pathologists' assessments. More comprehensive guidelines defining the 1% criterion should be provided to pathologists to increase the intra- and interobserver reliability. Alternatively, the use of digital analysis may aid in obtaining consistent scores.
Next, we evaluated the inter-assay variability of four PD-L1 assays (SP142, SP263, 22C3, and E1L3N) and found that SP142 stained the least for both ICs and TCs in TNBC samples. This finding is consistent with those of several comparative studies on multiple tumor types reporting the lowest levels of PD-L1 staining in SP142 compared with other assays for both TCs and ICs [4,6,17]. In ICs, only the E1L3N and SP263 assays were not significantly different, while the SP142 assay showed the greatest difference compared with the other three assays in our study. In TCs, the SP142 assay showed the greatest difference compared with the other three assays. Some studies on lung cancer have reported a higher sensitivity of SP263 for TC detection compared with 22C3 and 28-8 [20,21]; however, SP263 and 22C3 assays showed no significant difference in TC expression in the current study.
Recently, Rugo et al. compared the PD-L1 IC expression of SP142, SP263, and 22C3 and correlated the clinical outcome of atezolizumab according to the results of each assay in TNBC [22]. At their evaluated cutoffs, 22C3 and SP263 assays identified more patients with PD-L1 (+) tumors than the SP142 assay [22], similar to our study. It is clinically noteworthy that SP142 (+) other PD-L1 assay (+) tumors showed treatment response to atezolizumab, while SP142 (–) other PD-L1 assay (+) tumors showed no significant clinical benefit [22]. In TNBC, SP142 is the only FDA-approved assay showing a strong correlation with the clinical benefits of atezolizumab, and SP142 does not seem to be replaceable with other assays so far. In our study, all SP142 (+) cases (at IC 1% cutoff ) were also positive for SP263, 22C3, and E1L3N. The numbers of SP142 (−) SP263 (+), SP142 (−) 22C3 (+), and SP142 (−) E1L3N (+) cases at 1% cutoff were 4 (12.9%), 4 (12.9%), and 2 (6.5%), respectively. However, our study is limited due to the fact that the treatment outcomes could not be evaluated because the patients included in the current study did not receive atezolizumab.
This study had several limitations. First, the sample size was small, and all of the samples
evaluated in our study were primary resection specimens. Moreover, we intentionally
selected cases with tumor-infiltrating lymphocytes in at least part of the tumor to detect PD-L1-expressing ICs. Therefore, the positive rate could be higher than those reported in other studies. For SP142, the positive rate according to the mean score was 80.0%, while the mean positive rate assessed by each pathologist on ICs at a 1% cutoff was 81.7%. In other TNBC studies, the positive rate using SP142 ranged from 32% to 78% [2,3,8,9,23,24], while the positive rate was 41% in the IMpassion130 trial [2]. The tissues used for PD-L1 testing in the published trial included both primary and metastatic tumors, as the FDA approved the assay to be tested on either primary or metastatic tumors [2,8]. Previous studies have shown that the number of tumor-infiltrating lymphocytes was lower in metastatic lesions than in primary tumors [8,25], and PD-L1 expression was lower in metastatic tumors [8,25-27].
Accordingly, ICC and FKS could be affected by high PD-L1 positivity. In addition, it is also important to evaluate the concordance in cases with low tumor-infiltrating lymphocytes or in PD-L1-negative cases. Future studies evaluating the inter- and intraobserver variability are warranted using a large TNBC cohort, including these cases. Second, the interpretation guidelines for the SP142 assay were applied to the other three assays. The interpretation method for ICs varies among different assays. For example, the 22C3 assay counts
lymphocytes and macrophages as ICs, and the CPS is more widely used for 22C3. Meanwhile, the SP142 assay counts lymphocytes, macrophages, dendritic cells, and granulocytes as ICs. Third, special pathology training was not provided to pathologists. The interpretation guidelines available from the online VENTANA product were provided to 10 pathologists.
Most studies reporting high OPA, including the FDA companion test documentation for SP142, have been performed between two specially trained readers [3]. Considering that special training on PD-L1 scoring was not provided to all pathologists, we believe that our results reflect the real-world situation more accurately. Lastly, we randomly selected 10% and 50% IC cutoffs for high PD-L1 expression. In general, IC categorization using 1%, 5%, and 10% cutoffs is widely used in solid tumors [28]. PD-L1 analytic studies with relevant cutoffs are expected in a large TNBC cohort.
In conclusion, our results showed that the interobserver concordance of PD-L1 IC scoring was low before training, especially with the FDA recommended cutoff of 1% in the SP142 assay.
Hence, a detailed interpretation guideline or special training is warranted to increase the interobserver reliability. Of the four assays evaluated, SP142 revealed the lowest positivity of PD- L1 expression in both ICs and TCs, similar to the results of previous studies on other cancers.
ACKNOWLEDGMENTS
We would like to thank Dr. Yul Ri Chung for editing the manuscript.
SUPPLEMENTARY MATERIALS
Supplementary Table 1
Positive rate, proportion of cases with identical scoring, and Fleiss κ statics of programmed death ligand 1 scores in SP142 assay after training
Click here to view
Supplementary Figure 1
Categorical estimation of programmed death ligand 1 immune cell scores in each tumor using the other three assays. (A) SP263, (B) 22C3, and (C) E1L3N.
Click here to view
Supplementary Figure 2
Inter-assay variability of PD-L1 immune cell scores among the four assays.
Click here to view
Supplementary Figure 3
Venn diagrams summarizing the results at 1% cutoff using the four programmed death ligand 1 assays in immune cells.
Click here to view
REFERENCES
1. Yi M, Jiao D, Xu H, Liu Q, Zhao W, Han X, et al. Biomarkers for predicting efficacy of PD-1/PD-L1 inhibitors. Mol Cancer 2018;17:129.
PUBMED | CROSSREF
2. Schmid P, Adams S, Rugo HS, Schneeweiss A, Barrios CH, Iwata H, et al. Atezolizumab and nab- paclitaxel in advanced triple-negative breast cancer. N Engl J Med 2018;379:2108-21.
PUBMED | CROSSREF
3. U.S. Food and Drug Administration. Summary of safety and effectiveness data (SSED) PMA P160002/
S009. Silver Spring: U.S. Food and Drug Administration; 2019. https://www.accessdata.fda.gov/cdrh_
docs/pdf16/p160002s009b.pdf.
4. Tsao MS, Kerr KM, Kockx M, Beasley MB, Borczuk AC, Botling J, et al. PD-L1 immunohistochemistry comparability study in real-life clinical samples: results of blueprint phase 2 project. J Thorac Oncol 2018;13:1302-11.
PUBMED | CROSSREF
5. Rimm DL, Han G, Taube JM, Yi ES, Bridge JA, Flieder DB, et al. A prospective, multi-institutional, pathologist-based assessment of 4 immunohistochemistry assays for PD-L1 expression in non-small cell lung cancer. JAMA Oncol 2017;3:1051-8.
PUBMED | CROSSREF
6. Gonzalez-Ericsson PI, Stovgaard ES, Sua LF, Reisenbichler E, Kos Z, Carter JM, et al. The path to a better biomarker: application of a risk management framework for the implementation of PD-L1 and TILs as immuno-oncology biomarkers in breast cancer clinical trials and daily practice. J Pathol 2020;250:667-84.
PUBMED | CROSSREF
7. Downes MR, Slodkowska E, Katabi N, Jungbluth AA, Xu B. Inter- and intraobserver agreement of programmed death ligand 1 scoring in head and neck squamous cell carcinoma, urothelial carcinoma and breast carcinoma. Histopathology 2020;76:191-200.
PUBMED | CROSSREF
8. Reisenbichler ES, Han G, Bellizzi A, Bossuyt V, Brock J, Cole K, et al. Prospective multi-institutional evaluation of pathologist assessment of PD-L1 assays for patient selection in triple negative breast cancer.
Mod Pathol 2020;33:1746-52.
PUBMED | CROSSREF
9. Noske A, Ammann J, Wagner DC, Denkert C, Lebeau A, Sinn P, et al. Reproducibility and concordance of 4 clinically deleloped programmed death-ligand 1 (PD-L1) immunohistochemistry (IHC) assays in triple negative breast cancer (TNBC). Ann Oncol 2019;30:104.
CROSSREF
10. Solinas C, den Eynden GV, Wind AD, Richard F, Boisson A, Garaud S, et al. Reliability of immune biomarker assessment in breast cancer: A report on interobserver variability from studies at a single institution. Cancer Res 2018;78 Suppl:1624.
11. Nanda R, Chow LQ, Dees EC, Berger R, Gupta S, Geva R, et al. Pembrolizumab in patients with advanced triple-negative breast cancer: phase Ib KEYNOTE-012 study. J Clin Oncol 2016;34:2460-7.
PUBMED | CROSSREF
12. Voorwerk L, Slagter M, Horlings HM, Sikorska K, van de Vijver KK, de Maaker M, et al. Immune induction strategies in metastatic triple-negative breast cancer to enhance the sensitivity to PD-1 blockade: the TONIC trial. Nat Med 2019;25:920-8.
PUBMED | CROSSREF
13. Adam J, Le Stang N, Rouquette I, Cazes A, Badoual C, Pinot-Roussel H, et al. Multicenter harmonization study for PD-L1 IHC testing in non-small-cell lung cancer. Ann Oncol 2018;29:953-8.
PUBMED | CROSSREF
14. Kim H, Kwon HJ, Park SY, Park E, Chung JH. PD-L1 immunohistochemical assays for assessment of therapeutic strategies involving immune checkpoint inhibitors in non-small cell lung cancer: a comparative study. Oncotarget 2017;8:98524-32.
PUBMED | CROSSREF
15. Phillips T, Simmons P, Inzunza HD, Cogswell J, Novotny J Jr, Taylor C, et al. Development of an automated PD-L1 immunohistochemistry (IHC) assay for non-small cell lung cancer. Appl Immunohistochem Mol Morphol 2015;23:541-9.
PUBMED | CROSSREF
16. DAKO Agilent Technologies. Interpretation manual: PD-L1 IHC 22C3 pharmDx interpretation manual – triple-negative breast cancer (TNBC). Santa Clara: DAKO Agilent Technologies; 2018. https://www.agilent.
com/cs/library/usermanuals/public/29389_22c3_pharmdx_tnbc_interpretation_manual_kn355.pdf.
17. Hendry S, Salgado R, Gevaert T, Russell PA, John T, Thapa B, et al. Assessing tumor-infiltrating lymphocytes in solid tumors: a practical review for pathologists and proposal for a standardized method from the International Immunooncology Biomarkers Working Group: Part 1: assessing the host immune response, TILs in invasive breast carcinoma and ductal carcinoma in situ, metastatic tumor deposits and areas for further research. Adv Anat Pathol 2017;24:235-51.
PUBMED | CROSSREF
18. Schwamborn K, Ammann JU, Knüchel R, Hartmann A, Baretton G, Lasitschka F, et al. Multicentric analytical comparability study of programmed death-ligand 1 expression on tumor-infiltrating immune cells and tumor cells in urothelial bladder cancer using four clinically developed immunohistochemistry assays. Virchows Arch 2019;475:599-608.
PUBMED | CROSSREF
19. Dennis E, Kockx M, Harlow G, Cai Z, Bloom K, ElGabry E. Effective and globally reproducible digital pathologist training program on PD-L1 immunohistochemistry scoring on immune cells as a predictive biomarker for cancer immunotherapy in triple negative breast cancer. Cancer Res 2020;80 Suppl:PD5-02.
20. Munari E, Rossi G, Zamboni G, Lunardi G, Marconi M, Sommaggio M, et al. PD-L1 assays 22C3 and SP263 are not interchangeable in non-small cell lung cancer when considering clinically relevant cutoffs:
an interclone evaluation by differently trained pathologists. Am J Surg Pathol 2018;42:1384-9.
PUBMED | CROSSREF
21. Hendry S, Byrne DJ, Wright GM, Young RJ, Sturrock S, Cooper WA, et al. Comparison of four PD-L1 immunohistochemical assays in lung cancer. J Thorac Oncol 2018;13:367-76.
PUBMED | CROSSREF
22. Rugo HS, Loi S, Adams S, Schmid P, Schneeweiss A, Barrios CH, et al. Performance of PD-L1
immunohistochemistry (IHC) assays in unresectable locally advanced or metastatic triple-negative breast cancer (mTNBC): post-hoc analysis of IMpassion130. Ann Oncol 2019;30:851.
CROSSREF
23. Scott M, Scorer P, Barker C, Al-Masri H. Comparison of patient populations identified by different PD-L1 assays in in triple-negative breast cancer (TNBC). Ann Oncol 2019;30 Suppl 3:iii4.
CROSSREF
24. Carter JM, Polley MY, Sinnwell JP, Leon-Ferre RA, Couch FJ, Kalari KR, et al. Frequency, characteristics and prognostic factors of PD-L1+ triple negative breast cancer using the PD-L1 SP142 companion assay.
Cancer Res 2020;80 Suppl:PD1-08.
25. Ogiya R, Niikura N, Kumaki N, Yasojima H, Iwasa T, Kanbayashi C, et al. Comparison of immune microenvironments between primary tumors and brain metastases in patients with breast cancer.
Oncotarget 2017;8:103671-81.
PUBMED | CROSSREF
26. Cimino-Mathews A, Thompson E, Taube JM, Ye X, Lu Y, Meeker A, et al. PD-L1 (B7-H1) expression and the immune tumor microenvironment in primary and metastatic breast carcinomas. Hum Pathol 2016;47:52-63.
PUBMED | CROSSREF
27. Szekely B, Bossuyt V, Li X, Wali VB, Patwardhan GA, Frederick C, et al. Immunological differences between primary and metastatic breast cancer. Ann Oncol 2018;29:2232-9.
PUBMED | CROSSREF
28. Vennapusa B, Baker B, Kowanetz M, Boone J, Menzl I, Bruey JM, et al. Development of a PD- L1 complementary diagnostic immunohistochemistry assay (SP142) for atezolizumab. Appl Immunohistochem Mol Morphol 2019;27:92-100.
PUBMED | CROSSREF