Korean Circulation Journal
Introduction
There may be differences between office blood pressure (BP) and out-of-office BP (home BP or ambulatory BP). These differences may have implications for long-term prognosis.
1)2)High BP is
a well-known cardiovascular disease risk factor, and sustained hypertension (HT) is related to increased cardiovascular events.
3)Similarly, masked hypertension and isolated out-of-office HT, also show increased cardiovascular events compared to white coat hypertension (WCH) and normotension (NT).
4)5)WCH, often called isolated office HT, has been associated with adverse cardiovascular events and target organ damage compared to NT in some studies.
6-8)Long-term follow-up of WCH data reveal an association with target organ damage or stroke independent of mean arterial pressure.
8)9)However, other studies did not find such a relationship.
4)5)Recently, besides high BP, blood pressure variability (BPV) is being reported as another independent risk factor for cardiovascular events.
9)10)BPV refers to the fluctuation of BP with time. BPV is defined as either the overall variability during a period of time, such as the standard deviation (SD), or the average of the absolute difference between serial readings, such as average real variability (ARV).
9)BPV has the potential to be a strong predictor of stroke, independent
Print ISSN 1738-5520 • On-line ISSN 1738-5555
Higher Blood Pressure Variability in White Coat Hypertension;
from the Korean Ambulatory Blood Pressure Monitoring Registry
In Sook Kang, MD
1, Wook Bum Pyun, MD
1, Jinho Shin, MD
2, Sang-Hyun Ihm, MD
3, Ju Han Kim, MD
4, Sungha Park, MD
5, Kwang-Il Kim, MD
6, Woo-Shik Kim, MD
7, Soon Gil Kim, MD
2, and Gil Ja Shin, MD
11Department of Internal Medicine, School of Medicine, Ewha Womans University, Seoul, 2Department of Internal Medicine, College of Medicine, Hanyang University, Seoul, 3Department of Internal Medicine, College of Medicine, The Catholic University of Korea, Seoul, 4Department of Internal Medicine, School of Medicine, Chonnam University, Gwangju, 5Department of Internal Medicine, School of Medicine, Yonsei University, Seoul, 6Department of Internal Medicine, School of Medicine, Seoul National University, Seongnam, 7Department of Internal Medicine, School of Medicine Kyung Hee University, Seoul, Korea
Background and Objectives: Blood pressure variability (BPV) was recently shown to be a risk factor of stroke. White coat hypertension
(WCH) used to be regarded as innocuous, but one long-term follow-up study reported that WCH increased stroke rate compared to normotension (NT). In this study, we aimed to evaluate the relationship between WCH and BPV.
Subjects and Methods: We analyzed 1398 subjects from the Korean Ambulatory Blood Pressure Registry, who were divided into NT
(n=364), masked hypertension (n=122), white coat hypertension (n=254), and sustained hypertension (n=658) groups.
Results: Baseline characteristics were similar among groups. The average real variability (ARV), a highly sensitive BPV parameter, was
highest in the WCH group, followed by the sustained hypertension, masked hypertension, and NT groups. The results persisted after being adjusted for covariates. The WCH vs. sustained hypertension results (adjusted mean±standard error) were as follows: 24-h systolic ARV, 22.9±0.8 vs. 19.4±0.6; 24-h diastolic ARV, 16.8±0.6 vs. 14.3±0.5; daytime systolic ARV, 21.8±0.8 vs. 16.8±0.6; and daytime diastolic ARV, 16.2±0.6 vs. 13.4±0.5 (p<0.001 for all comparisons).
Conclusion: From the registry data, we found that subjects with WCH or masked hypertension had higher BPV than NT. However, long-term
follow-up data assessing the clinical influences of WCH on stroke are needed. (Korean Circ J 2016;46(3):365-373)
KEY WORDS: Blood pressure monitoring; Ambulatory; Blood pressure variability; White coat hypertension.
Received: January 13, 2015 Revision Received: July 15, 2015 Accepted: August 11, 2015
Correspondence: Wook Bum Pyun, MD, Division of Cardiology, Department of Internal Medicine, Ewha Womans University School of Medicine, Anyangcheon-ro 1071, Yangcheon-gu, Seoul 07985, Korea Tel: 82-2-2650-5308, Fax: 82-2-2650-5424
E-mail: [email protected]
• The authors have no financial conflicts of interest.
This is an Open Access article distributed under the terms of the Creative Commons Attribution Non-Commercial License (http://creativecommons.
org/licenses/by-nc/3.0) which permits unrestricted non-commercial use, distribution, and reproduction in any medium, provided the original work is properly cited.
of mean systolic BP.
11-13)Increased large artery stiffness and left ventricular mass can be present in subjects with high BPV.
14)15)WCH may be a marker of a reaction to stress, such as a visit to the doctor’s office that manifests with a BP surge and results in BPV.
16)The purpose of this study is to evaluate the relationship between WCH and BPV. We postulate that subjects with WCH, which plays a controversial role in cardiovascular events, may have higher BPV than those with NT.
Subjects and Methods
Study population
This study was conducted using data from the Korean Ambulatory BP Monitoring (Kor-ABP) Registry. This data was compiled in a multicenter observational study involving 23 secondary and tertiary hospitals. From 2009 to 2013, 5302 subjects were enrolled in this registry. The methodology used in the registry and details regarding inclusion and exclusion criteria are published by Kang et al.
17)Only qualified recordings with more than 80% valid BP measurements were included in this study. After excluding outlying and missing data, the number of eligible subjects was 2367. We further excluded subjects who had a medical history of HT (n=900) and selected subjects for this study who had no known medical history of HT (n=1467). After exclusion of the subjects with a medical history of
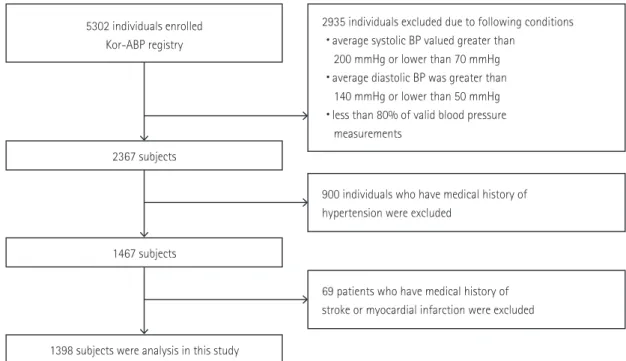
myocardial infarction and stroke, 1398 subjects remained in the final analysis (Fig. 1).
The study protocol was reviewed and approved by the institutional review board of each participating institution. Ambulatory BP monitoring (ABPM) data were collected from the patients of referral hospitals after obtaining written informed consent.
Blood pressure parameters and classification of subjects After resting for at least 5 minutes, office BP was measured by a physician in the referral hospital outpatient clinic using a validated automated device (UA-767, A & D company, San Jose, CA, USA), with the subject in a sitting position and arm supported at heart level. The average of two measurements was used for the analysis.
High office BP was defined as an average systolic BP≥140 mmHg or an average diastolic BP≥90 mmHg.
Daytime and nighttime BPs were calculated using the narrow fixed 30-minute interval method from the ABPM. However, the permissible limit of BP measuring frequency was more than every 30 minutes in the daytime and every 60 minutes in the nighttime.
Variable intervals were permitted according to the referral center preferences within the limit (mean±SD, daytime: 19.87±7.0 min and nighttime: 34.16±10.5 min). The average of daytime BP values was calculated using the BP values obtained from 6 a.m. to 10 p.m., and nighttime BP values were calculated using the BP values from 10 p.m. to 6 a.m. High average daytime ambulatory BP was defined as an average daytime systolic BP≥135 mmHg or an average daytime
Fig. 1. Flow chart of study population. Kor-ABP: Korean ambulatory blood pressure, BP: blood pressure.
5302 individuals enrolled Kor-ABP registry
2367 subjects
1467 subjects
1398 subjects were analysis in this study
2935 individuals excluded due to following conditions
・average systolic BP valued greater than 200 mmHg or lower than 70 mmHg
・average diastolic BP was greater than 140 mmHg or lower than 50 mmHg
・less than 80% of valid blood pressure measurements
900 individuals who have medical history of hypertension were excluded
69 patients who have medical history of stroke or myocardial infarction were excluded
diastolic BP≥85 mmHg. Pulse pressure was calculated by subtracting the mean diastolic BP from the mean systolic BP. All subjects were classified into four groups according to their office BP and average daytime ambulatory BP
5)18): (1) NT (office BP<140/90 mmHg and average daytime ambulatory BP<135/85 mmHg), (2) WCH (high office BP and average daytime ambulatory BP<135/85 mmHg), (3) masked hypertension (MHT, office BP<140/90 mmHg and high average daytime ambulatory BP), and (4) sustained hypertension (SHT, high office BP and high average daytime ambulatory BP).
Definitions of blood pressure variability
The SD of daytime and nighttime (systolic and diastolic) BP was calculated.
The ARV of BP was calculated using the following formula
19):
where N is the number of valid BP measurements and K is the order of measurements from each subject in the ABPM data corresponding to a given subject.
The coefficient of variation (CoV) was calculated from the ratio of the SD to the mean.
Statistical analyses
Baseline characteristics of subjects were compared using the chi-square test for categorical variables and one-way analysis of variance (ANOVA) test for continuous variables. Values of continuous variables were expressed as the mean±SD. A paired t-test was used to determine whether there was any difference between the SD and ARV values among groups. The significant values by one-way ANOVA BPV were entered into the general linear model to perform analysis of covariance for adjusting confounding variables, including sex, age, given medical history of diabetes mellitus, body mass index (BMI), serum creatinine, and cholesterol level. We performed post-hoc analysis with the least significant difference test. Adjusted values of continuous variables were expressed as the adjusted mean±standard error. A value of p<0.05 was considered statistically significant. Statistical analysis was performed using Statistical Package for Social Science version 19.0 (SPSS Inc., Chicago, IL, USA).
Results
Characteristics of the four groups
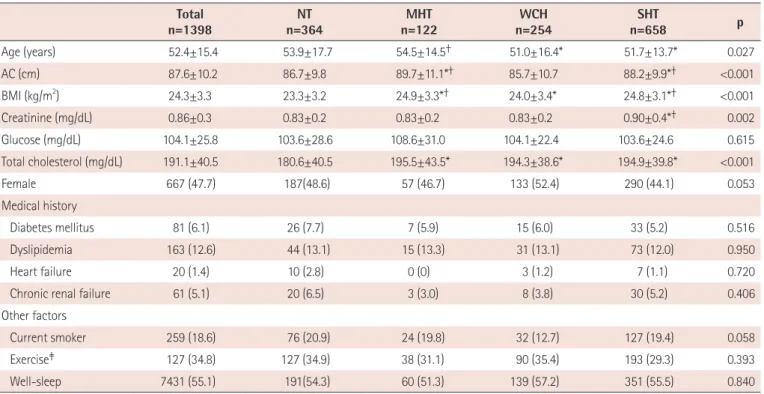
The mean age of the total 1398 subjects was 52.4±15.4 years and 47.7% were female. The average BMI of the four groups was
Table 1. Baseline characteristics Total
n=1398 NT
n=364 MHT
n=122 WCH
n=254 SHT
n=658 p
Age (years) 52.4±15.4 53.9±17.7 54.5±14.5† 51.0±16.4* 51.7±13.7* 0.027
AC (cm) 87.6±10.2 86.7±9.8 89.7±11.1*† 85.7±10.7 88.2±9.9*† <0.001
BMI (kg/m2) 24.3±3.3 23.3±3.2 24.9±3.3*† 24.0±3.4* 24.8±3.1*† <0.001
Creatinine (mg/dL) 0.86±0.3 0.83±0.2 0.83±0.2 0.83±0.2 0.90±0.4*† 0.002
Glucose (mg/dL) 104.1±25.8 103.6±28.6 108.6±31.0 104.1±22.4 103.6±24.6 0.615
Total cholesterol (mg/dL) 191.1±40.5 180.6±40.5 195.5±43.5* 194.3±38.6* 194.9±39.8* <0.001
Female 667 (47.7) 187(48.6) 57 (46.7) 133 (52.4) 290 (44.1) 0.053
Medical history
Diabetes mellitus 81 (6.1) 26 (7.7) 7 (5.9) 15 (6.0) 33 (5.2) 0.516
Dyslipidemia 163 (12.6) 44 (13.1) 15 (13.3) 31 (13.1) 73 (12.0) 0.950
Heart failure 20 (1.4) 10 (2.8) 0 (0) 3 (1.2) 7 (1.1) 0.720
Chronic renal failure 61 (5.1) 20 (6.5) 3 (3.0) 8 (3.8) 30 (5.2) 0.406
Other factors
Current smoker 259 (18.6) 76 (20.9) 24 (19.8) 32 (12.7) 127 (19.4) 0.058
Exercise‡ 127 (34.8) 127 (34.9) 38 (31.1) 90 (35.4) 193 (29.3) 0.393
Well-sleep 7431 (55.1) 191(54.3) 60 (51.3) 139 (57.2) 351 (55.5) 0.840
Values are presented as mean±standard deviation or n (%). *p<0.05 vs. normal, †p<0.05 vs. WCH. ‡Exercise more than three times per week.
NT: normotension, MHT: masked hypertension, WCH: white coat hypertension, SHT: sustained hypertension, AC: abdominal circumference, BMI: body mass index
24.3±3.3 kg/m
2. The most common group was SHT (n=658, 47.1%), followed by NT (n=364, 26.0%), WCH (n=254, 18.2%), and MHT (n=122, 8.7%). The baseline clinical characteristics of the groups are listed in Table 1. There were no significant differences in the proportion of female subjects, glucose levels, exercise, sleep quality, and medical history of diabetes mellitus between the groups.
Subjects in the NT and MHT groups were older than those in the WCH and SHT groups (p=0.027). The WCH group had the smallest average abdominal circumference (85.7±10.7 cm, p<0.001). The proportion of cigarette smokers was lower in the WCH group than
the other groups (p=0.005). Compared to the NT group, the other three groups had higher lower density-cholesterol levels (p<0.001).
Office blood pressure and ambulatory blood pressure moni- toring
By definition, office BPs were higher in the WCH and SHT groups than in the NT and MHT groups. The results of ABPM were higher in the MHT and SHT groups than in the other two groups. Additionally, the difference in systolic office BP within the NT and MHT versus the WCH and SHT groups was significant (all p<0.001, Table 2). The
Table 2. Blood pressure values
Total NT MHT WCH SHT p
Office SBP 142.8±20.9 119.9±13.0 129.3±9.2*†‡ 148.7±13.4* 155.7±15.6*† <0.001
Office DBP 88.5±15.3 75.1±9.3 78.1±9.0*†‡ 91.3±12.5* 96.8±13.5*† <0.001
Office HR 77.2±14.2 73.4±12.5 75.9±12.1†‡ 79.0±16.6* 79.0±14.1* <0.001
ABP-DSBP 138.6±16.0 122.8±10.6 146.3±9.0*†‡ 129.0±8.2* 149.6±11.4*† <0.001
ABP-DDBP 87.7±12.2 76.6±6.9 92.8±10.2*† 80.4±6.2* 96.2±9.3*† <0.001
ABP-DHR 76.3±9.7 73.4±9.7 78.1±9.8*† 74.8±9.1 78.0±9.5*† <0.001
ABP-NSBP 125.2±17.3 113.8±14.0 130.6±14.4*†‡ 116.8±13.2* 133.8±15.7*† <0.001
ABP-NDBP 78.0±11.9 69.9±9.5 80.3±9.9*†‡ 71.9±8.8* 84.4±10.5*† <0.001
ABP-NHR 63.6±9.3 62.7±9.4 63.8±8.9 62.4±9.5 64.7±9.1*† <0.001
ABP-DPP 50.6±9.8 46.2±7.8 53.5±10.1*† 48.6±7.2* 53.2±10.6*† <0.001
Values are presented as mean±standard deviation. *p<0.05 vs. NT, †p<0.05 vs. WCH, ‡p<0.05 vs. SHT. NT: normotension, MHT: masked hypertension, WCH: white coat hypertension, SHT: sustained hypertension, SBP: systolic blood pressure, DBP: diastolic blood pressure, HR: heart rate, ABP: 24 hour am- bulatory blood pressure, DSBP: daytime SBP, DDBP: daytime DBP, DRR: daytime heart rate, NSBP: nighttime SBP, NDBP: nighttime DBP, NHR: nighttime heart rate, DPP: daytime pulse pressure
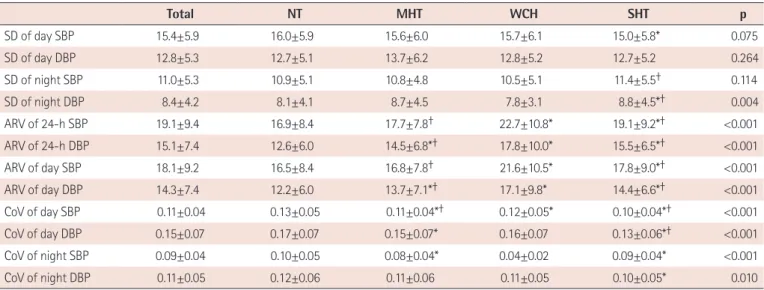
Table 3. Blood pressure variability
Total NT MHT WCH SHT p
SD of day SBP 15.4±5.9 16.0±5.9 15.6±6.0 15.7±6.1 15.0±5.8* 0.075
SD of day DBP 12.8±5.3 12.7±5.1 13.7±6.2 12.8±5.2 12.7±5.2 0.264
SD of night SBP 11.0±5.3 10.9±5.1 10.8±4.8 10.5±5.1 11.4±5.5† 0.114
SD of night DBP 8.4±4.2 8.1±4.1 8.7±4.5 7.8±3.1 8.8±4.5*† 0.004
ARV of 24-h SBP 19.1±9.4 16.9±8.4 17.7±7.8† 22.7±10.8* 19.1±9.2*† <0.001
ARV of 24-h DBP 15.1±7.4 12.6±6.0 14.5±6.8*† 17.8±10.0* 15.5±6.5*† <0.001
ARV of day SBP 18.1±9.2 16.5±8.4 16.8±7.8† 21.6±10.5* 17.8±9.0*† <0.001
ARV of day DBP 14.3±7.4 12.2±6.0 13.7±7.1*† 17.1±9.8* 14.4±6.6*† <0.001
CoV of day SBP 0.11±0.04 0.13±0.05 0.11±0.04*† 0.12±0.05* 0.10±0.04*† <0.001
CoV of day DBP 0.15±0.07 0.17±0.07 0.15±0.07* 0.16±0.07 0.13±0.06*† <0.001
CoV of night SBP 0.09±0.04 0.10±0.05 0.08±0.04* 0.04±0.02 0.09±0.04* <0.001
CoV of night DBP 0.11±0.05 0.12±0.06 0.11±0.06 0.11±0.05 0.10±0.05* 0.010
Values are presented as mean±standard deviation. *p<0.05 vs. NT, †p<0.05 vs. WCH. NT: normotension, MHT: masked hypertension, WCH: white coat hy- pertension, SHT: sustained hypertension, SD: standard deviation, SBP: systolic blood pressure, DBP: diastolic blood pressure, ARV: average real variability, CoV: coefficient of variation
MHT group had higher office BP values than the NT group, and the SHT group had higher office BP values than the WCH group (p<0.001). Similarly in ABPM, the difference in 24-h systolic and diastolic BP was evident within NT and WCH groups versus the MHT and SHT groups (all p<0.001).
Blood pressure variability
The BPV values are presented in Table 3. With regard to daytime systolic BPV, the SD of the NT group was highest, followed by the WCH, MHT, and SHT groups, although only the NT and SHT groups showed significant differences. Contrary to SD, the daytime systolic BP ARV of the NT and SHT groups showed lower mean
Table 4. Values of adjusted blood pressure variability
NT MHT WCH SHT p
SD of day SBP 16.0±0.5 15.2±0.7 15.7±0.5 15.1±0.4 0.289
SD of day DBP 12.8±0.4 13.7±0.7 12.7±0.5 12.7±0.4 0.445
SD of night SBP 11.3±0.4 10.9±0.7 10.9±0.5 11.7±0.4 0.309
SD of night DBP 8.4±0.3 8.7±0.5 7.9±0.4 8.7±0.3* 0.123
ARV of 24-h SBP 16.7±0.7 17.0±1.1† 22.9±0.8* 19.4±0.6*† <0.001
ARV of 24-h DBP 11.4±0.6 14.0±0.9*† 16.8±0.6* 14.3±0.5*† <0.001
ARV of day SBP 16.4±0.7 16.1±1.1† 21.8±0.8* 18.2±0.6*† <0.001
ARV of day DBP 11.2±0.6 13.5±0.9*† 16.2±0.6* 13.4±0.5*† <0.001
CoV of day SBP 0.13±0.003 0.11±0.005*† 0.12±0.003* 0.10±0.002*† <0.001
CoV of day DBP 0.17±0.004 0.15±0.007* 0.16±0.005 0.14±0.003*† <0.001
CoV of night SBP 0.10±0.003 0.08±0.005* 0.09±0.003 0.08±0.002* 0.001
CoV of night DBP 0.12±0.003 0.11±0.006 0.11±0.004 0.10±0.002* 0.003
Values are presented as adjusted mean±standard error. Values are adjusted for sex, age, given medical history of diabetes mellitus, body mass index, serum creatinine, and cholesterol level. *p<0.05 vs. NT, †p<0.05 vs. WCH. NT: normotension, MHT: masked hypertension, WCH: white coat hypertension, SHT: sus- tained hypertension, SD: standard deviation, SBP: systolic blood pressure, DBP: diastolic blood pressure, ARV: average real variability, CoV: coefficient of variation
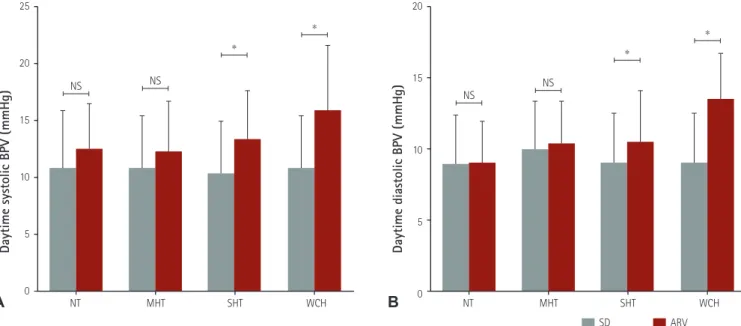
Fig. 2. The differences between SD and ARV within groups. The WCH group showed a large difference in the SD and ARV, which was followed by SHT.
The NT and MHT groups did not show differences in daytime systolic BPV (A) or daytime diastolic BPV (B). *p<0.001. SD: standard deviation, ARV: average real variability, WCH: white coat hypertension, SHT: sustained hypertension, NT: normotension, MHT: masked hypertension, BPV: blood pressure variability, NS: non-significant.
25
20
15
10
5
0
NT MHT SHT WCH
SD
Daytime systolic BPV (mmHg)
20
15
10
5
0 NT
NS NS NS NS
* *
* *
MHT SHT WCH
Daytime diastolic BPV (mmHg)
ARV
A B
values compared to the other two groups. The WCH group had the highest value. A similar pattern was present in the daytime diastolic BPV. Even though there was no significant difference in the SD of daytime diastolic BP, the means of the ARV were highest in the WCH group, followed by the SHT, MHT, and NT groups (Table 3 and Fig. 2). There was no significant difference between the SD and ARV values in the NT and MHT groups (Fig. 2A and 2B). However, the SHT and WCH groups had a significantly higher
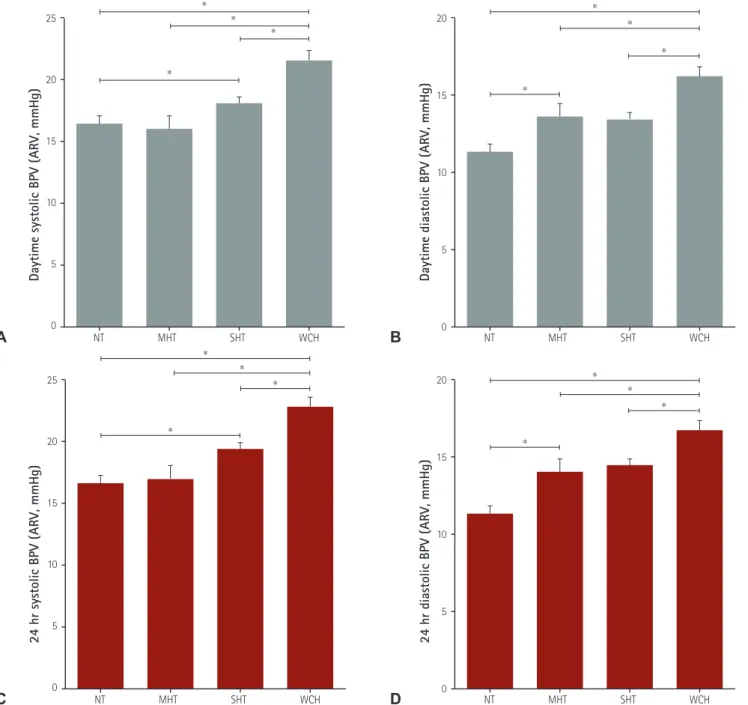
ARV than SD (p<0.001); this difference was highest in the WCH group (Fig. 2A and 2B). After adjusting for the covariates of sex, age, diabetes mellitus, BMI, serum creatinine, and cholesterol level, ARV means still showed significant differences between groups (Table 4). Additionally, the ARV values of 24-h systolic and diastolic BP showed similar patterns (Fig. 3); the highest values were in the WCH group, followed by the SHT, MHT, and NT groups. However, the SD lost significance after adjusting for covariates, with only
25
20
15
10
5
0 NT
*
*
*
*
MHT SHT WCH
Daytime systolic BPV (ARV, mmHg)
20
15
10
5
0 NT
*
*
*
*
MHT SHT WCH
Daytime diastolic BPV (ARV, mmHg)
24 hr systolic BPV (ARV, mmHg)
20
15
10
5
0 NT
*
*
*
*
MHT SHT WCH
24 hr diastolic BPV (ARV, mmHg)
25
20
15
10
5
0 NT
*
*
*
*
MHT SHT WCH
Fig. 3. The difference in ARV between groups. The WCH group shows the highest value of ARV compared to the other three groups. ARV values represent means adjusted for sex, age, diabetes mellitus, body mass index, serum creatinine, and cholesterol level. (A) Daytime SBP ARV, (B) daytime DBP ARV, (C) 24-hour SBP ARV, (D) 24-hour DBP ARV. *p<0.001. ARV: average real variability, WCH: white coat hypertension, SBP: systolic blood pressure, DBP:
diastolic blood pressure, BPV: blood pressure variability, NT: normotension, MHT: masked hypertension, SHT: sustained hypertension.
A
C
B
D
nighttime diastolic BPV between the WCH and SHT groups showing a statistically significant difference (7.9±0.4 vs. 8.7±0.3, p=0.002, Table 4). Daytime CoV was higher in the NT and WCH groups than the MHT and ST groups (Tables 3 and 4).
Discussion
We evaluated the relationship between WCH and BPV by using data from the Kor-ABP Registry. There are several BPV indexes.
In this study, the NT and MHT groups had similar BPV values, whether presented as SD or ARV. The NT and WCT groups had a lower mean 24-h BP and had a higher CoV than the SHT and MHT groups. However, both the SD and CoV have a limitation: they cannot evaluate time series variability. The ARV is more reliable than the SD due to the presence of time series variability.
10)19)Our data show that the SHT and WCH groups had a higher ARV than SD.
These results persisted after adjusting for confounding variables, including sex, age, medical history of diabetes mellitus, BMI, serum creatinine, and cholesterol level.
Age and sex are closely related to BPV, and antihypertensive drugs including calcium channel blockers are known to decrease BPV.
9)We adjusted BPV by using confounding variables based on previous studies on BPV
5)20)with the variables that showed statistical differences in the baseline characteristics. We did not consider antihypertensive medication as a confounding variable, since our study population did not include treated hypertensive patients.
WCH is the isolated office HT in untreated patients, and it is distinguished from the white coat effect based on the antihypertensive treatment.
21)However, Fagard and Cornelissen.
4)mentioned that most of the studies about WCH with CV outcomes include patients undergoing antihypertensive treatment, which is a study limitation.
In the baseline characteristics of this study, the WCH group had a younger mean age than the NT and MHT groups, a smaller abdominal circumference and BMI, and lower cholesterol and glucose levels than the MHT group. Their office BP level was compatible with grade 1 HT, with an average BP of 148.7/91.3 mmHg. Similar to our data, previous studies also reported patients with WCH usually have an office systolic BP of 140-159 mmHg or an office diastolic BP of 90-99 mmHg.
22)23)Additionally, female sex, being a nonsmoker, lower BMI, favorable lipid profile, and a smaller value of left ventricular mass (LVM) were suggested as independent predictors of WCH.
Echo data was available for 639 of the 1398 subjects (data was not shown); the adjusted LVM index in the WCH group was smaller (94.6±3.3 g/m
2) than the SHT group (102.9±6.6 g/m
2, p=0.013) and similar to the two other groups (NT, 95.7±2.8; MHT, 94.4±3.3).
Contrary to our study, a recent report showed that short-term BPV compared to home BP was higher in the MHT and ST groups than the WCH and NT groups.
20)This study had several differences compared to our current study, including the study population, the device for measuring out-of-office BP, and the index of BPV. They investigated elderly people who were ≥73 years old, assessed BPV with SD from 18 measurements of home BP, and included about 50% of patients taking antihypertensive medication. As mentioned in our results, the average age of our study was 52.4 years, participants were not taking antihypertensive medication, and we evaluated BPV with ARV from 24-h ABPM. Hence, the different age, study population, measuring patterns, and index for BPV may have resulted in the different results.
BPV includes both short-term and long-term changes in BP, which can be measured by ABPM and visit-to-visit variability, respectively. Our data measured short-term BPV with ABPM. BPV, which represents the fluctuations in BP, depends on sympathetic vascular modulation and changes in arterial distensibility.
24)25)A cohort study suggested that high BPV is associated with impaired endothelial function.
26)BPV has been reported as a strong predictor of stroke, independent of mean systolic BP.
11-13)Specific organs, in particular the vessels of the brain, are susceptible to transient elevations in BP. Therefore, stroke risk may be increased with BP surges related to WCH, compared to a normotensive control.
16)27)BPV is closely associated with primary and secondary outcomes of stroke.
12)13)16)19)27)28)However, fluctuations of BP in WCH are usually transient rather than persistent. The influence on adverse cardiovascular outcomes could be minimal compared to the effect of sustained high BP.
16)Cardiovascular risk is known to be the highest in subjects with SHT, followed in order by MH, WCH, and
NT.
4)5)8)Hence, the highest ARV in the WCH group suggests one
reason for cardiovascular or cerebrovascular risk in WCH, and it does not mean that WCH has the highest risk compared to the other groups. Moreover, many factors influenced WCH with BPV including age, sex, partial or true WCH, and whether the WCH was treated or untreated. Another study about long-term CV outcomes showed only a partial WCH-related increase in CV events compared to NT.
6)Hence, a long-term follow up study of WCH with high BPV is needed for confirmation of the current study results.
This study had several limitations. First, it was based on data
from secondary and tertiary hospitals, and did not include primary
clinics. Additionally, this is a cross-sectional observational study
with no follow-up data. Thus, it was difficult to establish any causal
or temporal relationships. Based on previous data and this study,
we suggest using ARV as one of risk factors of WCH-related long-
term vascular accidents. However, long-term prospective studies
are needed for confirmation. In addition, the incidence of stroke
displays differences between races.
29)30)All participants in the current study were Korean, and the results therefore cannot be generalized to other ethnic groups.
In conclusion, our data showed that the WCH and MHT groups had the higher ARV values, as calculated from the average absolute difference between consecutive measurements, compared to NT.
However, long-term follow-up data are needed for the determination of clinical influences of WCH in stroke.
Acknowledgements
This study was supported and organized by the Korean Society of Hypertension and the Working Group on Blood Pressure Monitoring in the Korean Society of Hypertension.
References
1. Julius S, Mejia A, Jones K, et al. “White coat” versus “sustained”
borderline hypertension in Tecumseh, Michigan. Hypertension 1990;16:617-23.
2. Verdecchia P, Schillaci G, Boldrini F, Zampi I, Porcellati C. Variability between current definitions of ‘normal’ ambulatory blood pressure.
Implications in the assessment of white coat hypertension.
Hypertension 1992;20:555-62.
3. Bonow RO, Mann DL, Zipes DP, Libby P. Braunwald’s Heart Disease.
9th ed. Philadelphia; Elsevier Health Sciences; 2012. p.218.
4. Fagard RH, Cornelissen VA. Incidence of cardiovascular events in white-coat, masked and sustained hypertension versus true normotension: a meta-analysis. J Hypertens 2007;25:2193-8.
5. Ohkubo T, Kikuya M, Metoki H, et al. Prognosis of “masked”
hypertension and “white-coat” hypertension detected by 24-h ambulatory blood pressure monitoring 10-year follow-up from the Ohasama study. J Am Coll Cardiol 2005;46:508-15.
6. Mancia G, Bombelli M, Brambilla G, et al. Long-term prognostic value of white coat hypertension: an insight from diagnostic use of both ambulatory and home blood pressure measurements. Hypertension 2013;62:168-74.
7. Glen SK, Elliott HL, Curzio JL, Lees KR, Reid JL. White-coat hypertension as a cause of cardiovascular dysfunction. Lancet 1996;348:654-7.
8. Mancia G, Facchetti R, Bombelli M, Grassi G, Sega R. Long-term risk of mortality associated with selective and combined elevation in office, home, and ambulatory blood pressure. Hypertension 2006;47:846-53.
9. Rothwell PM. Limitations of the usual blood-pressure hypothesis and
importance of variability, instability, and episodic hypertension.
Lancet 2010;375:938-48.
10. Pierdomenico SD, Di Nicola M, Esposito AL, et al. Prognostic value of different indices of blood pressure variability in hypertensive patients. Am J Hypertens 2009;22:842-7.
11. Rothwell PM, Howard SC, Dolan E, et al. Prognostic significance of visit-to-visit variability, maximum systolic blood pressure, and episodic hypertension. Lancet 2010;375:895-905.
12. Poortvliet RK, Ford I, Lloyd SM, et al. Blood pressure variability and cardiovascular risk in the PROspective Study of Pravastatin in the Elderly at Risk (PROSPER). PLoS One 2012;7:e52438.
13. Endo K, Kario K, Koga M, et al. Impact of early blood pressure variability on stroke outcomes after thrombolysis: the SAMURAI rt- PA Registry. Stroke 2013;44:816-8.
14. Schillaci G, Bilo G, Pucci G, et al. Relationship between short-term blood pressure variability and large-artery stiffness in human hypertension:
findings from 2 large databases. Hypertension 2012;60:369-77.
15. Zakopoulos NA, Tsivgoulis G, Barlas G, et al. Impact of the time rate of blood pressure variation on left ventricular mass. J Hypertens 2006;24:2071-7.
16. Franks PW. White-coat hypertension and risk of stroke: do the data really tell us what we need to know? Hypertension 2005;45:183-4.
17. Kang IS, Pyun WB, Shin J, Kim JH, Kim SG, Shin GJ. Association between central obesity and circadian parameters of blood pressure from the korean ambulatory blood pressure monitoring registry: Kor- ABP registry. J Korean Med Sci 2013;28:1461-7.
18. Chobanian AV, Bakris GL, Black HR, et al. Seventh report of the Joint National Committee on Prevention, Detection, Evaluation, and Treatment of High Blood Pressure. Hypertension 2003;42:1206-52.
19. Mena L, Pintos S, Queipo NV, Aizpúrua JA, Maestre G, Sulbarán T. A reliable index for the prognostic significance of blood pressure variability. J Hypertens 2005;23:505-11.
20. Cacciolati C, Tzourio C, Hanon O. Blood pressure variability in elderly persons with white-coat and masked hypertension compared to those with normotension and sustained hypertension. Am J Hypertens 2013;26:367-72.
21. Myers MG. Pseudoresistant hypertension attributed to white-coat effect. Hypertension 2012;59:532-3.
22. Björklund K, Lind L, Vessby B, Andrén B, Lithell H. Different metabolic predictors of white-coat and sustained hypertension over a 20-year follow-up period: a population-based study of elderly men.
Circulation 2002;106:63-8.
23. Sorof JM, Poffenbarger T, Franco K, Portman R. Evaluation of white coat hypertension in children: importance of the definitions of normal ambulatory blood pressure and the severity of casual hypertension. Am J Hypertens 2001;14(9 Pt 1):855-60.
24. Parati G, Di Rienzo M, Mancia G. Neural cardiovascular regulation
and 24-hour blood pressure and heart rate variability. Ann N Y Acad Sci 1996;783:47-63.
25. Pickering TG. Variability of blood pressure. Blood Press Monit 1998;3:141-5.
26. Diaz KM, Veerabhadrappa P, Kashem MA, et al. Relationship of visit- to-visit and ambulatory blood pressure variability to vascular function in African Americans. Hypertens Res 2012;35:55-61.
27. Verdecchia P, Reboldi GP, Angeli F, et al. Short- and long-term incidence of stroke in white-coat hypertension. Hypertension 2005;45:203-8.
28. Mancia G, Fagard R, Narkiewicz K, et al. 2013 ESH/ESC guidelines for
the management of arterial hypertension: the Task Force for the Management of Arterial Hypertension of the European Society of Hypertension (ESH) and of the European Society of Cardiology (ESC).
Eur Heart J 2013;34:2159-219.
29. Hong KS, Bang OY, Kang DW, et al. Stroke statistics in Korea: part I.
Epidemiology and risk factors: a report from the korean stroke society and clinical research center for stroke. J Stroke 2013;15:2-20.
30. Mozaffarian D, Benjamin EJ, Go AS, et al. Executive summary: heart disease and stroke statistics—2015 update: a report from the American Heart Association. Circulation 2015;131:434-41.