Introduction
Central serous chorioretinopathy (CSC) is an ophthalmic disease that typically occurs unilaterally in young male pa- tients and is characterized by decreased visual acuity and distorted vision. Active CSC is characterized by detachment
of the neurosensory retina due to the accumulation of serous fluid between the photoreceptors and the retinal pigment epi- thelium (RPE) with focal RPE leakage [1].
The pathogenesis of CSC remains unclear [2]. There are several opinions regarding this, but among them, RPE dys- function is important. In 1965, a study confirmed leakage at
만성 중심장액맥락망막병증에서 빠른 진동 안전위도검사의 효용성
Usefulness of Fast Oscillation Electrooculography in Chronic Central Serous Chorioretinopathy
주진호1, 최정한2, 문상웅1
Jin-Ho Joo1, Jeong Han Choi2, Sang Woong Moon1
1강동경희대학교병원 안과, 2미소아이안과
1Department of Ophthalmology, Kyung Hee University Hospital at Gangdong, Seoul, Korea
2Miso Eye Clinic, Seoul, Korea
Purpose: To confirm retinal pigment epithelium (RPE) function by using fast oscillation electrooculography (FO EOG) in patients with central serous chorioretinopathy (CSC) compared with normal controls.
Methods: We retrospectively reviewed 22 eyes of CSC patients (7 with the acute form and 15 with the chronic form) and 20 eyes of normal controls who underwent FO EOG. The FO was measured in four groups of subjects: acute CSC, chronic CSC, fellow eyes, and nor- mal controls. Light trough (LT) voltage, dark-peak voltage, and peak-to-trough (PT) ratios were recorded. Central macular thickness was also measured using spectral domain-optical coherence tomography. The CSC group and the normal group were compared.
Results: In CSC eyes, the LT voltage decreased and the PT ratio increased significantly compared to the normal eyes (p = 0.013 and 0.024, respectively). We further divided the CSC group into acute (n = 7) and chronic (n = 15). In the chronic CSC group, the LT voltage decreased and the PT ratio increased statistically significantly compared to the normal eyes (p = 0.028 and 0.028, respectively).
Conclusions: In CSC eyes, RPE function is altered as it progresses to chronic, and this functional change can be confirmed through the amplitude of the LT revealed by FO ERG.
Keywords: Central serous chorioretinopathy; Chronic; Electrooculography; Fast oscillation
Address reprint requests to Sang Woong Moon, MD, PhD
Department of Ophthalmology, Kyung Hee University Hospital at Gangdong, #892 Dongnam-ro, Gangdong-gu, Seoul, Korea
Tel: 82-2-440-7751, Fax: 82-2-440-7756 E-mail: [email protected]
Received: 2020. 10. 28.
Revised: 2020. 10. 30.
Accepted: 2020. 11. 1.
the RPE level on fluorescein angiography (FA) in patients with CSC, and both the RPE and choroid were considered to be involved in the disease [3]. Since then, RPE hyperperme- ability is thought to be one of the causes of CSC.
CSC can appear as an acute or chronic form, and the cri- teria for distinguishing between the two forms are not clear;
however, cases that last between 3 and 6 months are defined as chronic. Acute CSC has a good prognosis, while chronic CSC has a poor prognosis. Chronic CSC is a more severe condition of RPE alteration, and prolonged detachment caus- es damage to photoreceptors and the RPE, leading to perma- nent vision loss [4-6].
The RPE comprises a single layer of pigmented cells, located between the retinal photoreceptor and the choriocap- illaris. The RPE forms part of the blood/retina barrier and plays an important role in maintaining the normal photore- ceptor function. If the RPE function is defective, retinal de- generative diseases such as age-related macular degeneration or CSC may occur [7,8].
Clinicians usually receive a lot of information for CSC diagnosis via imaging tests such as optical coherence tomog- raphy (OCT), FA, and indocyanine green angiography. How- ever, these can determine the anatomical abnormalities and progression of the retina, but do not evaluate RPE function.
The electro-oculogram (EOG) is a method for evaluating RPE function. This is an electrophysiological test of the outer retina and RPE, in which changes in the electrical po- tential across the RPE are recorded [9]. In previous studies, subnormal EOG was observed in patients with chronic CSC [10]. In another study, an EOG test was performed in an active CSC patient, and the results of the test did not show differences between the normal eye and the opposite eye [11].
However, to our knowledge, no studies have analyzed the two CSC eye types together.
In 2017, the newly revised International Society for Clini- cal Electrophysiology of Vision (ISCEV) standards for clini- cal EOG were released, and fast oscillation (FO) of the EOG was officially added. The advantage of FO of EOG is that the test time is shorter, making it easier for patients to be test- ed. Slow oscillations (SO) of the EOG are recorded during 15 minutes of dark adaption followed by 15 minutes of light adaption. On the other hand, the FO of the EOG has the ad- vantage of greater compliance because the total inspection time is 15 minutes. The purpose of this study was to confirm RPE function using the FO of the EOG test in patients with
CSC. Also, it aimed to analyze acute CSC and chronic CSC patients compared to normal patients.
Materials and Methods
Subjects
The current research followed the tenets of the Declaration of Helsinki, and all patients provided informed consent after explanation of the study protocol. The Institutional Review Board (KHNMC-2020-05-005) approved this retrospective study. This retrospective study involved a series of 22 eyes with CSC and 20 normal controls who visited the Kyung Hee University Hospital at Gangdong from March 2018 to July 2019. Of the 22 CSC patients, 7 had acute CSC and 15 had chronic CSC which had lasted for more than 6 months. All acute CSC patients had subretinal fluid (SRF), and chronic CSC patients had no SRF. In this study, we defined chron- ic CSC as a case in which SRF was present for more than 6 months and widespread tracts of RPE atrophy were pres- ent. Patients who had CSC in both eyes were excluded for comparison with the fellow eye.
Ocular examinations
All patients underwent a complete ophthalmologic examina- tion, including an assessment of best-corrected visual acuity (BCVA), slit-lamp examination, fundus examination, color fundus photography, OCT, FA, and EOG. Snellen BCVA was recorded and converted to logMAR BCVA for analysis.
The OCT images were obtained using SD-OCT (Spectralis;
Heidelberg Engineering, Heidelberg, Germany), and the central macular thickness (CMT) was assessed and record- ed. The FA images were obtained with Heidelberg retinal angiography (HRA-Ⅱ; Heidelberg Engineering, Heidelberg, Germany). According to the standard guidelines of the IS- CEV (2017 update), the FO of EOG values for all subjects were recorded with the RETIport system (RETIport; Roland Consult, Brandenburg, Germany) [9].
Electro-oculogram recording
After cleaning the skin of the eyes, silver/silver chloride electrodes filled with a conductive gel were placed close to the medial and lateral canthi of each eye. The electrode im- pedance between any pair of electrodes was checked before the test and did not exceed 5 kΩ. The amplifier was set at
500 µV/div. The subjects were seated with his/her head posi- tioned on a chin rest at the opening of a Ganzfeld dome. The room lights were switched off during testing.
When recording the FO EOG, two red fixation lights, sep- arated horizontally 15 degrees apart (30 degrees total) from the center on the back of the dome, were turned 50 times at 1.5-second intervals to change the left and right lights, which took 75 seconds per cycle. First, the dome light was brightly lit to finish one cycle; then the dome light was turned off and another cycle was performed. A total of 12 cycles (15 min- utes) were performed to improve the accuracy of our test.
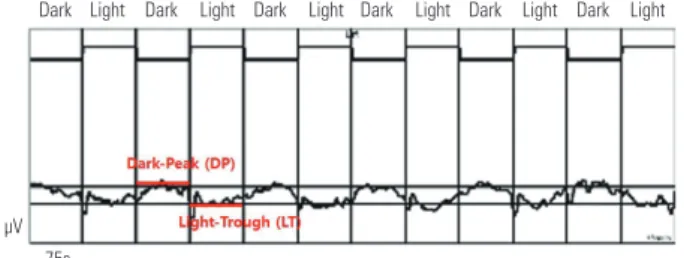
FO data were analyzed using the RETIport system soft- ware. The FO amplitude was calculated from the average of the peak-to-trough (PT) ratios from each dark-light cycle. As a result of analysis throughout the program, the PT ratio, the dark-peak (DP) amplitude, and light-trough (LT) values were recorded. The following parameters were derived from the sinusoidal wave fit: FO amplitude calculated from the differ- ence between the absolute amplitudes of the peak and trough of the sine wave fit, the PT ratio calculated from the ratio of absolute amplitudes of the peak and trough of the sine wave fit, and the phase of the sine wave measured relative to the time the light was turned on for the light phase (Fig. 1) [9].
Statistical methods
Statistical analysis was performed using the Statistical Package for the Social Sciences software 25.0 (IBM Corp., Armonk, NY, USA). Since the sample size was small for all comparative analyses, a nonparametric test was performed.
The Wilcoxon signed rank test was used when comparing the opposite eye with the CSC eye, and the Mann-Whitney test
was used when comparing CSC eyes with the normal eyes.
The Kruskal-Wallis test was used to compare the three groups.
A p-value <0.05 was considered statistically significant.
Results
In total, 22 eyes in 22 patients with CSC were enrolled (22 men [100.0%]). The average age of the participants was 49.14 ± 10.79 years (range, 30-68) years. Twenty eyes from 10 normal controls were enrolled (10 men [100.0%]). The av- erage age of the control group was 44.10 ± 10.72 years (range, 28-60) years. There was no statistically significant difference in age between the CSC and normal groups (p = 0.226). We compared visual acuity and CMT values among the three groups: affected eye, fellow eye, and control eye. There was no statistically significant difference in BCVA and CMT val- ues between the three groups (Kruskal-Wallis test; p = 0.265, p = 0.116). The mean BCVA (logMAR) values were 0.15 ± 0.17 and 0.07 ± 0.08 for the eyes with CSC and the fellow eye group, respectively (p = 0.060). The mean BCVA (log- MAR) values of the normal controls were 0.07 ± 0.09, and this value for the normal group was not statistically different from the CSC group or the fellow eye group (p = 0.088, p = 0.251, respectively). The mean CMT values measured using OCT were 285.32 ± 38.47 μm in the CSC group and 270.27
± 10.22 μm in the fellow eye group, and there was no statisti- cally significant difference in CMT between the two groups (p = 0.724). The mean CMT values for the normal controls were 265.60 ± 7.32 μm. There was a statistically significant
Dark
μV 75s
Light Dark Light Dark Light Dark Light Dark Light Dark Light
Figure 1. Fast oscillation (FO) recoding from a normal eye with 12 cycles of dark and light intervals (75 seconds each). The dark-peak (DP) and light-trough (LT). The FO amplitude was calculated from the av- erage of the peak-to-trough ratios from each of the dark-light cycles.
The FO peak-to-trough ratio is computed from the amplitude of the DP divided by the amplitude of the LT.
Table 1. Demographic and clinical characteristics of patients with central serous chorioretinopathy and normal controls
22 Patients (22 eyes)
10 Controls
(20 eyes) p-value Age (years) 49.58 ± 10.79 44.10 ± 10.72 0.226* S ex
(male:female)
100:0 100:0 -
Affected eye Fellow eye Controls p-value BCVA (logMAR) 0.15 ± 0.17 0.07 ± 0.08 0.07 ± 0.09 0.265† CMT (μm) 285.32 ± 38.47270.27 ± 10.22 265.60 ± 7.32 0.116† Values are presented as mean ± standard deviation.
BCVA = best corrected visual acuity; logMAR = logarithm of mini- mal angle of resolution; CMT = central macular thickness.
*Mann-Whitney U test; †Kruskal-Wallis test.
difference in CMT between the CSC group and the normal controls (p = 0.014), but there was no statistically significant difference in CMT between the fellow eye and the normal controls (t-test; p = 0.468) (Table 1).
FO EOG differences in CSC group and normal controls We compared and analyzed the FO EOG parameters in the three groups; eyes with CSC, fellow eyes, and normal con- trols. Table 2 shows the FO EOG values for the three groups.
The PT ratio, DP amplitude, and the amplitude of LT values in the three groups were compared between groups using t-tests. A statistically significant difference in PT ratio values and the amplitude of LT were observed (p = 0.013, p = 0.024)
between the CSC and control groups. All other parameters were not statistically different (p > 0.05).
Further analysis by classifying the CSC group into acute and chronic types
We further divided the CSC group (n = 22) into the acute group (n = 7) and chronic group (n = 15) and subgroup anal- yses were conducted to increase statistical precision (Table 3, 4). The average prevalence period for acute CSC was 1.5 months and that of chronic CSC was 25.0 months. Statistical analysis between each of the four groups was performed by Mann-Whitney test. Fig. 2A shows the FO PT ratios for the four groups (acute CSC [A], chronic CSC [C], fellow eye [F],
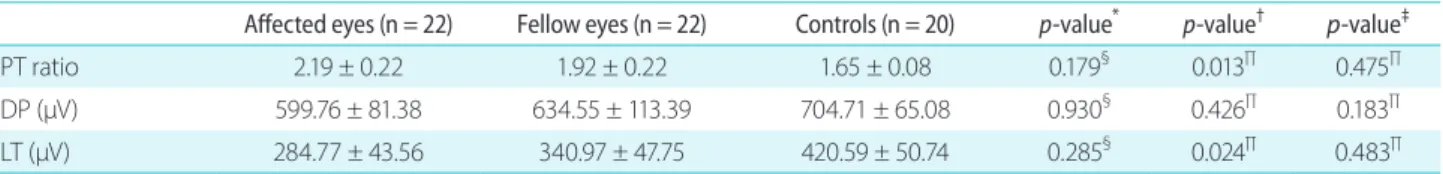
Table 2. Parametric values for fast oscillation electro-oculography in eyes with CSC, fellow eyes, and normal controls
Affected eyes (n = 22) Fellow eyes (n = 22) Controls (n = 20) p-value* p-value† p-value‡
PT ratio 2.19 ± 0.22 1.92 ± 0.22 1.65 ± 0.08 0.179§ 0.013∏ 0.475∏
DP (µV) 599.76 ± 81.38 634.55 ± 113.39 704.71 ± 65.08 0.930§ 0.426∏ 0.183∏
LT (µV) 284.77 ± 43.56 340.97 ± 47.75 420.59 ± 50.74 0.285§ 0.024∏ 0.483∏
Values are presented as mean ± standard deviation.
CSC = central serous chorioretinopathy; PT = peak-to-trough; DP = dark-peak; LT = light-trough.
*Comparison of eyes between the CSC group and fellow eyes group; †Comparison of eyes between the CSC group and control group;
‡Comparison of fellow eyes group and control group; §Wilcoxon signed rank test; ∏Mann-Whitney U test.
Table 3. Parametric values for fast oscillation electro-oculography in eyes with acute CSC, and normal controls
Acute CSC (n = 7) Chronic CSC (n = 15) Controls (n = 20) p-value* p-value† p-value‡
PT ratio 1.76 ± 0.06 2.36 ± 0.27 1.65 ± 0.08 0.381§ 0.485§ 0.028§
DP (µV) 635.32 ± 108.12 585.42 ± 87.83 704.71 ± 65.08 0.571§ 0.733§ 0.594§
LT (µV) 356.35 ± 61.21 256.00 ± 40.25 420.59 ± 50.74 0.571§ 0.635§ 0.028§
Values are presented as mean ± standard deviation.
CSC = central serous chorioretinopathy; PT = peak-to-trough; dP = dark-peak; LT = light-trough.
*Comparison of the acute CSC group and chronic CSC group; †Comparison of the acute CSC group and control group; ‡Comparison of the chronic CSC group and control group; §Mann-Whitney test.
Table 4. Parametric values for fast oscillation electro-oculography in eyes with acute and CSC, and fellow eyes
Acute CSC (n = 7) Chronic CSC (n = 15) Fellow eyes (n = 22) p-value* p-value†
PT ratio 1.76 ± 0.06 2.36 ± 0.27 1.92 ± 0.22 0.970‡ 0.149‡
DP (µV) 635.32 ± 108.12 585.42 ± 87.83 634.55 ± 113.39 0.958‡ 0.980‡
LT (µV) 356.35 ± 61.21 256.00 ± 40.25 340.97 ± 47.75 0.981‡ 0.268‡
Values are presented as mean ± standard deviation.
CSC = central serous chorioretinopathy; PT = peak-to-trough; DP = dark-peak; LT = light-trough.
*Comparison of the acute CSC group and fellow eyes group; †Comparison of the chronic CSC group and fellow eye; ‡Mann-Whitney test.
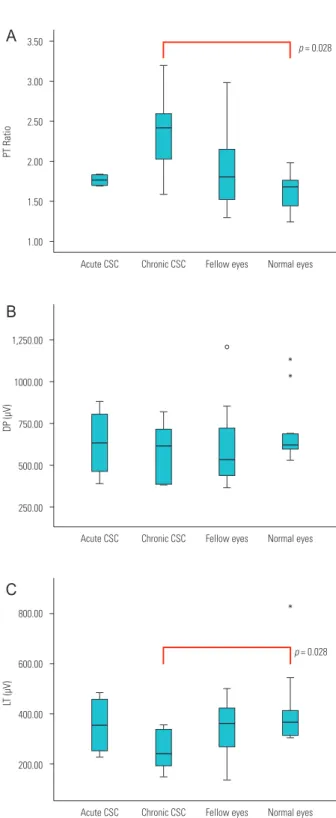
and normal control [N]). A statistically significant difference was observed between the chronic CSC group and the nor- mal control group (p = 0.028). Fig. 2B shows the DP ampli- tude for the FO in each group. No differences were observed between the groups. Fig. 2C shows the LT amplitude for the FO in each group. A statistically significant difference was observed between the chronic CSC group and the normal control group (p = 0.028). The acute CSC group did not show a statistically significant difference between the fellow eye group or the normal control group.
Discussion
Despite the advancements in imaging technology and re- search on CSC, understanding of the pathophysiology of this disease is still lacking and unclear. Several hypotheses on the pathophysiology of CSC have been suggested based on clinical findings. The most important among these are the choroid, RPE, and hormonal factors [2].
The first hypothesis emphasizes the role of the choroid.
This suggests that the thickness of the choroid is increased by hyperpermeability in CSC eyes due to which tissue hy- drostatic pressure is increased, the RPE detaches, and SRF forms between the RPE and the retina. Inner choroid stain- ing is seen in the mid-phase by Indocyanine green angiogra- phy which is one of the main pieces of evidence for choroidal hyperpermeability [5,6,12,13].
The second hypothesis is that RPE dysfunction plays an important role in the pathophysiology of CSC. This suggests that diffuse loss of RPE cells, which can be seen on fundus autofluorescence (FAF), causes a loss of the RPE barrier and its pumping function, thus permitting chronic SRF ac- cumulation. This was the most widely accepted hypothesis before the involvement of choroidal pathology was accepted.
Leakage in the focal area through the RPE is a character- istic of CSC, and this is an important first rationale for the pathophysiology of the disease. Subretinal fluid was thought to accumulate from pinpoint leaks that appeared to be focal defects in the RPE [2].
One study showed that focal RPE defects appear to facil- itate fluid movement from, rather than into, the subretinal space to the choroid [14]. This alternate hypothesis suggested that the focal loss of polarity of RPE cells causes fluid pump- ing into the subretinal space [15]. However, this hypothesis
3.50
3.00 2.50 2.00 1.50 1.00
PT Ratio
Chronic CSC
Acute CSC Fellow eyes Normal eyes
*
*
* p = 0.028
800.00
600.00
400.00
200.00
LT (μV)
Chronic CSC
Acute CSC Fellow eyes Normal eyes p = 0.028 1,250.00
1000.00
750.00
500.00
250.00
DP (μV)
Chronic CSC
Acute CSC Fellow eyes Normal eyes
A
B
C
Figure 2. Each panel shows the individual data for the fast oscilla- tion electro-oculogram (FO EOG) for subjects in the acute central serous chorioretinopathy (CSC) group (A, n = 7), chronic CSC group (C, n = 15), fellow eye group (F, n = 22), and normal controls (N, n = 20). Each measure is shown as follows: (A) peak-to-trough (PT) ratio, (B) dark-peak (DP) amplitude, and (C) the light-trough (LT) amplitude.
Differences between groups were analyzed using the Mann-Whitney test, and the significance level is indicated.
has its limitations with respect to explaining the occurrence of pigment epithelial detachment (PED) and the occurrence of depolarized RPE cells only in certain areas.
Many studies have attempted to reveal the abnormality of RPE function through various investigations in CSC eyes.
FA imaging for CSC shows focal fluorescein leaks at the RPE level [3]. OCT can also easily image and present any abnormalities in the RPE. In OCT, PED, hypothesized to be a crack in the RPE layer, which is considered to be the area where fluorescein is transferred from the choroid, is also fre- quently observed in the area around the leaks shown by FA [16]. Also, RPE abnormalities were observed in asymptom- atic fellow eyes, despite the presence of a superficially nor- mal macula [17]. Changes in RPE can also be evaluated with FAF. In FAF, lipofuscin that has accumulated in the RPE shows as hyper autofluorescence, and RPE atrophy results in hypo autofluorescence. Prolonged accumulation of autofluo- rescent materials in the subretinal space may cause damage to the RPE in patients with CSC [18].
The role of the RPE in CSC is still unclear. It is thought that tissue hydrostatic pressure in the choroid increases, disrupting the barrier function of the RPE, thereby allowing fluid to accumulate between the retina and the RPE. Repeat- ed accumulation of SRF slowly destroys RPE function.
We performed FO EOG in CSC patients and compared it between fellow eyes and normal control eyes. As a result, in the chronic CSC group, the PT ratio value was significantly increased and the LT amplitude value decreased (p = 0.028, p = 0.028). The DP amplitude in patients with chronic CSC was also decreased compared to that in the controls, but there was no statistically significant difference (p = 0.594).
The increase in the PT ratio was due to the obvious decrease in LT amplitude in CSC eyes. In acute CSC, the DP ampli- tude and the LT value were lower than that in control eyes, but these were not statistically different (p = 0.733, p = 0.635, respectively). The results in the fellow eye group were the same (p = 0.193, p = 0.475). The fellow eye group showed either the presence of SRF or no symptoms, but on an aver- age, the EOG value was decreased compared to that in the control eyes; however, it showed similar values to that in the acute CSC group.
Previous studies have attempted to confirm RPE func- tion in CSC patients using slow oscillation EOG. Patients with active CSC showed no significant differences when compared with the unaffected or normal eyes [11]. The pa-
tients with active CSC in this study had a short duration of disease that was 1.5 to 9 weeks after the onset of symptoms.
In another study, subnormal EOG values were observed in patients with CSC who had been followed up for at least 3 years, had visual field defects, and had extensive and se- vere RPE damage [10]. The results of these two studies are consistent with our results.
Another study that used multifocal electroretinogram (ERG) was conducted in patients with CSC. In this study, the amplitude decreased in those with active CSC, and when the SRF was removed, the value increased slightly but remained lower than normal [19]. Persistent functional impairment of the retina was found by multifocal ERG in patients with CSC after resolution of the SRF. Therefore, the longer the dura- tion of the disease, the more the RPE function is damaged, which is significantly different from the normal EOG value seen in chronic CSC. Also, the amplitude value obtained by multifocal ERG was lower than normal in the fellow eyes [19]. Although the EOG values in the fellow eye or eyes with acute CSC were not statistically different from normal eyes, we considered that EOG can explain that these values in acute CSC and the opposite eye are slightly lower than in a normal eye.
EOG can assess RPE function, and also the interaction between the RPE and photoreceptors. This is done by noting changes in the corneoretinal standing potential (the differ- ence between the retina and electropositive cornea) during the dark-adapted and light-adapted states. This standing po- tential is an indirect measure of the transepithelial potential (TEP) of the RPE. The TEP is equivalent to the difference in the membrane potential of the basolateral and apical mem- branes of the RPE. The change in resistance between these two membranes or the membrane potential can alter the am- plitude of the TEP. Retinal adaptation to changes in ambient light changes the standing potential. The slow oscillation EOG utilizes the RPE response to changes in illumination, 15 minutes of dark adaptation, which is then followed by 15 minutes of light adaptation [9].
However, the FO procedure is slightly different: 60-75 seconds of dark adaptation and 60-75 seconds of light adap- tation is repeated. The FO is explained by a different mech- anism. Short-term changes in the light and dark conditions form continuous oscillations that depend on changes in ion permeation in the apical and basal membranes. In the light, the transport of chloride ions to the RPE is reduced, thereby
reducing TEP production. In the dark, ionic homeostasis causes the TEP to return to normal. The FO result shows a decrease in the standing potential in the presence of light (LT) which increases in darkness (DP) [9]. Therefore, for a prolonged time, RPE damage leads to a decrease in the LT in the FO, which results in a significant decrease in patients with chronic CSC compared to normal controls. Our find- ings suggest a reduction in the activity of RPE chloride ions in chronic CSC eyes. We believe that this can be considered as evidence of a change in RPE function in patients with CSC.
The limitation of this study is its small sample size. We thought that it would be necessary to further increase the number of patients to confirm the statistical relationship be- tween disease duration and changes in RPE function.
CSC can occur in an acute or chronic form. Acute CSC often improves spontaneously over time, but chronic CSC does not. Chronic CSC shows advanced stages of RPE alter- ation, leading to a distinct and permanent loss of visual acuity.
Atrophy of the underlying RPE and prolonged detachment may be caused by photoreceptor and RPE damage, resulting in unfavorable visual acuity. In the case of CSC patients, we often experience cases in which the patient didn’t know the exact duration of their disease. At this time, we thought that it could be helpful to distinguish whether CSC is the acute or chronic type by evaluating RPE function using FO EOG. We concluded that the RPE function is altered in CSC eyes, espe- cially in the chronic form, and a decrease in RPE function was confirmed by the decrease in the amplitude of LT of FO EOG.
Acknowledgements
Jin-Ho Joo and Jeong Han Choi contributed equally to this work. These authors are co-first author.
Conflicts of Interest
The authors declare no conflicts of interest relevant to this article.
References
1. Wang M, Munch IC, Hasler PW, et al. Central serous chorioreti- nopathy. Acta Ophthalmol 2008;86:126-45.
2. Nicholson B, Noble J, Forooghian F, Meyerle C. Central serous chorioretinopathy: update on pathophysiology and treatment.
Surv Ophthalmol 2013;58:103-26.
3. Maumenee AE. Macular diseases: clinical manifestations. Trans Am Acad Ophthalmol Otolaryngol 1965;69:605-13.
4. Otsuka S, Ohba N, Nakao K. A long-term follow-up study of severe variant of central serous chorioretinopathy. Retina 2002;22:25-32.
5. Spaide RF, Campeas L, Haas A, et al. Central serous chorio- retinopathy in younger and older adults. Ophthalmology 1996;103:2070-80.
6. Yannuzzi LA. Central serous chorioretinopathy: a personal per- spective. Am J Ophthalmol 2010;149:361-3.
7. Bok D. The retinal pigment epithelium: a versatile partner in vi- sion. J Cell Sci Suppl 1993;17:189-95.
8. Strauss O. The retinal pigment epithelium in visual function.
Physiol Rev 2005;85:845-81.
9. Constable PA, Bach M, Frishman LJ, et al. ISCEV Standard for clinical electro-oculography (2017 update). Doc Ophthalmol 2017;134:1-9.
10. Castro-Correia J, Coutinho MF, Rosas V, Maia J. Long-term fol- low-up of central serous retinopathy in 150 patients. Doc Oph- thalmol 1992;81:379-86.
11. Gupta LY, Marmor MF. Electrophysiology of the retinal pigment epithelium in central serous chorioretinopathy. Doc Ophthalmol 1995;91:101-7.
12. Prünte C, Flammer J. Choroidal capillary and venous conges- tion in central serous chorioretinopathy. Am J Ophthalmol 1996;121:26-34.
13. Piccolino FC, Borgia L, Zinicola E, Zingirian M. Indocyanine green angiographic findings in central serous chorioretinopathy. Eye (Lond) 1995;9(Pt 3):324-32.
14. Negi A, Marmor MF. Experimental serous retinal detachment and focal pigment epithelial damage. Arch Ophthalmol 1984;102:445-9.
15. Spitznas M. Pathogenesis of central serous retinopathy: a new working hypothesis. Graefes Arch Clin Exp Ophthalmol 1986;224:321-4.
16. Mitarai K, Gomi F, Tano Y. Three-dimensional optical coherence tomographic findings in central serous chorioretinopathy. Grae- fes Arch Clin Exp Ophthalmol 2006;244:1415-20.
17. Gupta P, Gupta V, Dogra MR, et al. Morphological changes in the retinal pigment epithelium on spectral-domain OCT in the un- affected eyes with idiopathic central serous chorioretinopathy.
Int Ophthalmol 2010;30:175-81.
18. Maruko I, Iida T, Ojima A, Sekiryu T. Subretinal dot-like precipi- tates and yellow material in central serous chorioretinopathy.
Retina 2011;31:759-65.
19. Moschos M, Brouzas D, Koutsandrea C, et al. Assessment of
central serous chorioretinopathy by optical coherence tomog- raphy and multifocal electroretinography. Ophthalmologica 2007;221:292-8.