With chronic obstructive pulmonary disease (COPD), the assessment of normal lung volume is important for monitoring the course and severity of the disease. In COPD, it is mainly destruction (or failure to repair) the
lung parenchyma that leads to emphysema and it is im- portant to detect structural alterations that occur to varying degrees in the small bronchi and membranous bronchioli (i.e., airways <2 mm in diameter) (1). The structural alterations in these two sites are considered to be the most important contributors to the airflow limita- tion and accelerated decline of FEV1 in COPD.
Consequently, sequential measurements of FEV1 are mostly used for monitoring the progress of the disease.
However, no single pulmonary function test exists to evaluate all the parameters necessary to diagnose and
Quantitative Assessment of Lung Volumes using Multi- detector Row Computed Tomography (MDCT) in Patients
with Chronic Obstructive Pulmonary Disease (COPD)
1Sang Min Lee, M.D., Jin Hur, M.D., Tae Hoon Kim, M.D., Sang Jin Kim, M.D., Hyung Jung Kim, M.D.2
1Department of Radiology, Yonsei University College of Medicine
2Department of Pulmonology, Yonsei University College of Medicine Received March 11, 2008 ; Accepted July 8, 2008
Address reprint requests to : Jin Hur, M.D., Department of Diagnostic Radiology and Research Institute of Radiological Science, Yonsei University College of Medicine, Severance Hospital, 250 Seongsanno (134 Sinchon-dong), Seodaemun-gu, Seoul 120-752, South Korea.
Tel. 82-2-2228-7400 Fax. 82-2-393-3035 E-mail: [email protected]
Purpose: To evaluate the clinical value of the multi-detector row computed tomogra- phy (MDCT) in the quantitative assessment of lung volumes and to assess the relation- ship between the MDCT results and disease severity as determined by a pulmonary function test (PFT) in Chronic Obstructive Pulmonary Disease (COPD) patients.
Materials and Methods: We performed a PFT and MDCT on 39 COPD patients. Using the GOLD classification, we divided the patients into three groups according to dis- ease severity; stage I (mild, n=10), stage II (moderate, n=15), and stage III (severe, n=14). Using the pulmo-CT software program, we measured the proportion of lung volumes with attenuation values below -910 and -950 HU.
Results: The mean FEV1 (% of predicted) and FEV1/FVC was 82.2±2% and 66.2±
3% in stage I, 53.5±11% and 52±6% in stage II, and 32.3±7% and 44.2±13% in stage III, respectively. Differences in lung volume percentages at each of the thresh- olds (-910 and -950 HU) among the 3 stages were statistically significant (p<0.01, p<0.01) and correlated well with the FEV1 and FEV1/FVC (r=-0.803, r=-0.766, r=
-0.817, and r=-0.795, respectively).
Conclusion: The volumetric measurement obtained by MDCT provides an accurate means of quantifying pulmonary emphysema.
Index words :Chronic obstructive pulmonary disease Computed tomography (CT)
Lung volume measurements Chest
assess the severity, prognosis, and course of the disease.
High-resolution computed tomography (HRCT) is known to be a useful method for quantifying the extent of emphysema. Several reports have shown the relation- ship between the HRCT scan and the pulmonary func- tion test (PFT) in the analysis of COPD (2-7). With the recent advances in multi-detector row computed tomog- raphy (MDCT) technology, volumetric data can be ac- quired more quickly and easily for use in the evaluation of lung volume (8). Because the range of CT values in the lung is strongly influenced by the content of air per voxel, the extent of emphysema can be accurately deter- mined by a quantitative volumetric CT that analyzes the range, frequency, and distribution of CT values using MDCT at a certain threshold.
The purpose of this study was to evaluate the clinical usefulness of MDCT for the quantitative assessment of lung volumes and to assess the relationship between MDCT results and the severity of COPD disease as de- termined by the PFT.
Materials and Methods
Patients Selection
Between August 2004 and December 2006, 39 pa- tients with COPD underwent a PFT and MDCT. The study patients included 32 men and 7 women, aged from 50 to 71 years (mean age, 62 years).
The diagnosis of COPD was made based on a clinical examination, chest radiographs, and lung function para- meters from the Global Initiative for Chronic Obstructive Lung Disease (GOLD) Workshop Report (9). We excluded patients who had severe cardiac dis- ease, diffuse or focal parenchymal abnormalities affect- ing more than one segment, or pleural effusion.
The study patients were divided into three groups ac- cording to disease severity based on the criteria set by the GOLD workshop report (9); stage I: (n=10, mild, FEV1/FVC < 70% of predicted, FEV1/predicted FEV1
> 0.8), stage II: (n=15, moderate, FEV1/FVC < 70% of predicted, 0.3 ≤FEV1/predicted FEV1 < 0.8) and stage III:(n=14, severe, FEV1/FVC < 70% of predicted, FEV1/predicted FEV1 < 0.3 or FEV1/predicted FEV1
< 0.5 with respiratory failure or clinical signs of right heart failure).
This study was approved by the institutional review boards.
Pulmonary Function Test
A PFT was performed prior to the MDCT examina- tions in a dedicated pulmonary function laboratory, un- der the supervision of a certified pulmonary technolo- gist. For all patients, the interval between the PFT and MDCT was less than 2 weeks.
The PFT indexes were measured using a spirometer (Vmax 229, Sensormedics, U.S.A.). The PFT parameters included the vital capacity (VC), forced expiratory vol- ume in 1 sec (FEV1), ratio of the forced expiratory vol- ume in 1 sec to the forced vital capacity (FEV1/FVC), and diffusing capacity of the lung for carbon monoxide (DLCO). The values for VC, FEV1, FEV1/FVC, and DL- CO were expressed as percentages of the predicted val- ues (percentage of predicted).
MDCT examination
A MDCT scan was performed using a sixteen-slice he- lical CT (Somatom Sensation 16, software version VA20, Siemens Medical Solutions, Forchheim, Germany) with- out intravascular contrast material administration. The CT scan was performed in the supine position, from the lung apices to the level of the adrenal gland during inspi- ration. To obtain thin-section CT images, we used the following parameters: 120 kVp, 180 mAs, 1 mm table feed/rotation, 1 mm collimation, and 0.5 mm interval.
The image data were reconstructed with a 1.0 mm thickness using a bone algorithm.
Volumetric assessment technique (densitometry) The MDCT scans were evaluated using the Pulmo-CT software (Pulmo, Wizard, Siemens Medical Solutions, Germany). The boundaries of each lung were automati- cally determined by a density-discriminating software program. The trachea, main-stem bronchi, mediastinal structures, and soft tissues were selectively removed by the pulmo-CT software. Manual corrections of lung con- tour tracing were usually needed at the carina level due to the irregular shape of the hilar bronchovascular struc- tures. Furthermore, we manually removed the soft tis- sue structures, main bronchus, and vessels, which could not be done automatically using the pulmo-CT software.
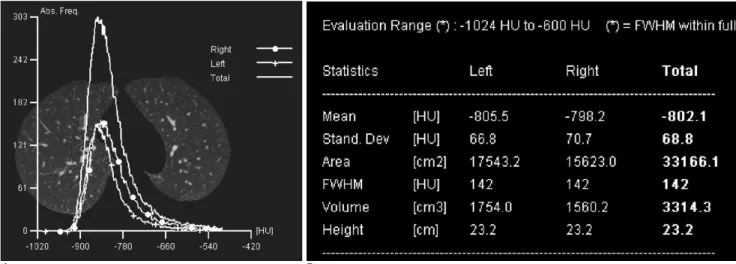
Lung density values were calculated according to the threshold values. The numeric analysis of lung attenua- tion was demonstrated in different forms including his- tograms, and tables (Fig. 1).
The threshold limits for total lung volume ranged from -600 to -1024 HU in order to exclude soft tissue surrounding the lung and large vessels within the lung
(10). The volume, attenuation distribution, mean attenu- ation, and SD of attenuation of the whole lung volume were demonstrated using a histogram display. The his- togram provided a frequency distribution of voxels with specific attenuation numbers (in HU) in the lung. The percentage of voxels with attenuation values below a specific level was defined as the lower attenuation vol- ume at that threshold. Using the pulmo-CT software program, we measured the proportion of lung volumes with attenuation values below the -910 and -950 HU thresholds. The thresholds for the assessment of abnor- mally low attenuation of the lung were made on the ba- sis of previous studies (2-6).
The percentages of abnormally low attenuation of lung volumes were calculated using the following for- mula: percentage of low attenuation of lung volume =
100*[hypo-attenuating volume (l)/total lung volume (l)].
Statistical analysis
The percentages of the abnormally low attenuation lung volumes were compared among the three COPD groups using a one-way ANOVA via the Student- Newman-Keuls method. Further, the percentages of the abnormally low attenuation lung volumes were tested for a possible relationship with the PFT results using a Pearson’s correlation. P-values less than 0.05 were con- sidered statistically significant.
The SPSS software (Version 10.0 Statistical Package for the Social Sciences, Chicago, IL) was used for the sta- tistical evaluations.
Results
The PFT results of 39 COPD patients are summarized in Table 1. A total of 10 patients in stage I, 15 in stage II, and 14 in stage III had mean FEV1 (% of predicted) and FEV1/FVC of 82.2 ± 2% and 66.2 ± 3%, 53.5 ± 11%
and 52 ± 6%, and 32.3 ± 7% and 44.2 ± 13%, respec- tively.
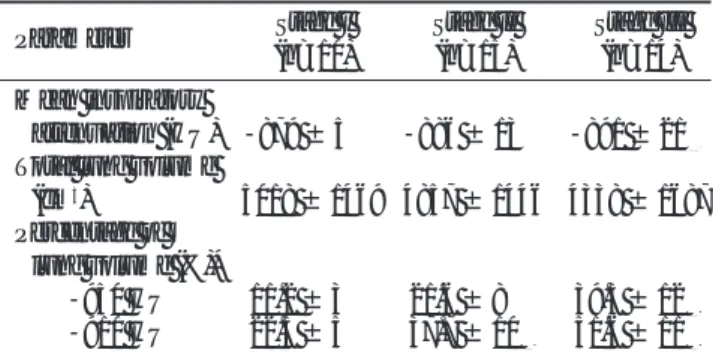
Table 2 shows the CT densitometry results of the 39 patients with COPD. The values for the lower attenua- tion volume at the -910 and -950 HU thresholds at in- spiration were 22.5 ± 5% and 11.2 ± 3% in stage I, 37.7
± 10% and 21.6 ± 8% in stage II, and 51.6 ± 11% and 39.3 ± 12% in stage III, respectively. The differences in lung volume percentages at a threshold of -910 HU among the three stages were statistically significant (22.5 ± 5%, 37.7 ± 10%, and 51.6 ± 11%, for stage I, II and III, respectively, p<0.01). The differences in the
A B
Fig. 1. Demonstration of pulmo-CT results with a histogram (A) and table (B).
Table 1. Results from the Pulmonary Function Tests in 39 Patients with Chronic Obstructive Pulmonary Disease
Parameter Stage I Stage II Stage III (n=10) (n=15) (n=14) VC (% of predicted) 101.3 ± 4 85.4 ± 13 71.9 ± 15 FEV1(% of predicted) 082.2 ± 2 53.5 ± 11 32.3 ± 70 FEV1/FVC(% of predicted) 066.2 ± 3 52.0 ± 60 44.2 ± 13 DLCO(% of predicted) 072.5 ± 2 48.3 ± 10 36.7 ± 12 VC: Vital capacity, FEV1: forced expiratory volume in 1 second, FEV1/FVC: the ratio of the forced expiratory volume in 1 second to the forced vital capacity, DLCO: diffusing capacity of the lung for carbon monoxide.
Stage I: (FEV1/FVC <70% of predicted, FEV1/predicted FEV1
>0.8)
Stage II: (FEV1/FVC <70% of predicted, 0.3≤FEV1/predicted FEV1 <0.8)
Stage III: (FEV1/FVC <70% of predicted, FEV1/predicted FEV1
<0.3 or FEV1/predicted FEV1 <0.5 with respiratory failure or clinical signs of right heart failure)
percentage of lung volume at a threshold of -950 HU among the three stages were statistically significant (11.2 ± 3%, 21.6 ± 8%, and 39.3 ± 12%, for stage I, II and III, respectively, p<0.01).
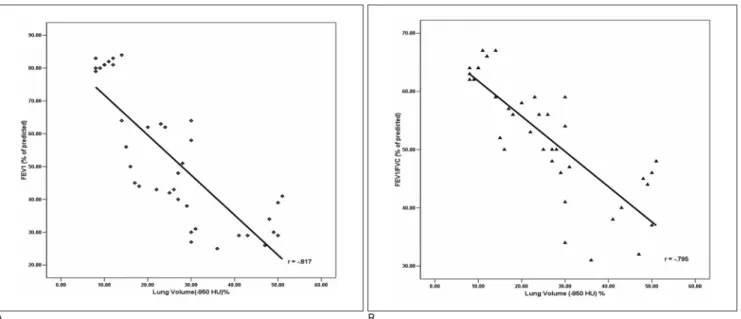
The percentage of lung volumes at a threshold of -910 HU showed a strong correlation with the FEV1 (% of predicted) and FEV1/FVC (% of predicted) (r=-0.803
and r=-0.766, respectively (Fig. 2). The percentage of lung volumes at a threshold of -950 HU correlated well with the FEV1 (% of predicted) and FEV1/FVC (% of predicted) (r=-0.817 and r=-0.795, respectively) (Fig.
3).
Discussion
In the present study, we found that quantitative mea- surements of lung volumes by MDCT correlated well with disease severity as determined by a PFT. This find- ing suggests that the volumetric measurements obtained by MDCT provides an accurate means of quantifying lung volume and could be used for the diagnosis and monitoring of the progression of emphysema in COPD patients.
Many studies have assessed the use of CT for the quantitative analysis of structural abnormalities caused by airway obstruction and emphysema in COPD pa- tients (2-6). Inspiration CT shows the extent of emphy- sema (4, 5), while the expiratory CT reflects the expira- tory airflow limitation and the subsequent air trapping (6). In previous studies, it has been shown that the severity of anatomical emphysematous changes in the HRCT correlate well with a PFT (2, 3), According to Arakawa A et al. (3), a good correlation exists between the inspiratory and expiratory volumetric measure- ments of abnormally low attenuated lung volume and the percentage of FEV1, FEV1/FVC, and DLCO. Several Table 2. Results from CT Densitometry in 39 Patients with
Chronic Obstructive Pulmonary Disease
Parameter Stage I Stage II Stage III
(n=10) (n=15) (n=14)
Mean inspiratory
attenuation (HU) -879 ± 5000 -886 ± 1300 -891 ± 2100 Total lung volume
(cm3) 5018 ± 1469 4857 ± 1446 4338 ± 1687 Percentage of
lung volume (%)*
-950 HU 11.2 ± 300 21.6 ± 80 0 39.3 ± 120 -910 HU 22.5 ± 500 37.7 ± 100 51.6 ± 110 Stage I: (FEV1/FVC <70% of predicted, FEV1/predicted FEV1
>0.8)
Stage II: (FEV1/FVC <70% of predicted, 0.3≤FEV1/predicted FEV1 <0.8)
Stage III: (FEV1/FVC <70% of predicted, FEV1/predicted FEV1
<0.3 or FEV1/predicted FEV1 <0.5 with respiratory failure or clinical signs of right heart failure)
N= number of patients
Note: Mean values ± standard deviation (SD) are indicated.
*Percentages of abnormally low attenuation of lung volumes were calculated using the following formulas: percentage of low attenuation of lung volume = 100 * [hypo-attenuating volume (l)/total lung volume (l)].
A B
Fig. 2. The relationship between the lung volume percentage at a threshold of -910 HU and the pulmonary function tests (PFT) in 39 patients with COPD.
A. Correlation between the lung volume percentages at a threshold of -910 HU and FEV1 (% of predicted), (r=-0.803).
B. Correlation between the lung volume percentages at a threshold of -910 HU and FEV1/FVC (% of predicted), (r=-0.766).
studies have demonstrated that expiratory CT assess- ments correlate more closely with the peripheral airway obstruction in COPD (11-13). However, one recent re- port (14) demonstrated that the inspiratory CT was equal to the expiratory CT with respect to its ability to quantify an abnormally low attenuation of the lungs caused by pulmonary emphysema. Our results also re- vealed a good correlation between inspiratory volumet- ric measurements of abnormally low attenuated lung volume and PFT parameters.
The low attenuation thresholds that have been most widely used to identify emphysema on conventional 10- mm-thick CT sections are -900 or -910 HU (7). Using thin section CT scans at 1-mm collimation without intra- venous administration of contrast material, Gevenois et al. (4, 5) found that a lower attenuation threshold of -950 HU correlated best with morphologic emphyse- ma. The low attenuation thresholds that were used in our study were -910 and -950 HU, because we used thin section CT scans at 1-mm collimation without intra- venous administration of contrast material.
Advances with MDCT and the workstation made it possible to obtain and analyze the lung volume data in order to generate histograms of attenuation in Hounsfield units for the lung (8). The measurement of CT pixel attenuation values provides an objective method for quantifying the severity of emphysema.
Various techniques have been performed to separate the
lung from other soft tissues in order to reduce the time involved in this analysis, but with techniques available on most modern workstations, 3D lung models can be generated with volumetric data acquired by MDCT.
The lungs are easily separated from the soft-tissue struc- tures including the trachea, main stem bronchi, and esophagus, with minimal post-processing. With this model, the range of emphysema is readily determined by moving a boundary line to the defined threshold on a histogram of attenuation values that represent the whole lung. CT densitometry shows the difference in lung density between the dependent and nondependent portion. The differences are smallest for lung volumes near the total lung capacity (15).
In clinical practice, the severity and progression of emphysema are usually assessed on the basis of clinical symptoms and spirometric findings, which indicate global airflow obstruction. However, both of these para- meters are relatively insensitive to small changes in the amount of emphysematous tissue in the lung. A variety of pharmacologic and endobronchial treatments of pa- tients with smoking-related emphysema also are under development (16-19). With the advent of these new treatments, it is important to have a sensitive and accu- rate test to assess the degree of pulmonary emphysema for the early detection of the disease, monitoring the re- sponse to treatment, and initial drug validation. As a re- sult, a quantitative chest CT has been proposed as a sen-
A B
Fig. 3. The relationship between the lung volume percentage at a threshold of -950 HU and the pulmonary function tests (PFT) in 39 patients with COPD.
A. Correlation between the lung volume percentages at a threshold of -950 HU and FEV1 (% of predicted), (r=-0.817).
B. Correlation between the lung volume percentages at a threshold of -950 HU and FEV1/FVC (% of predicted), (r=-0.795).
sitive test for quantifying emphysematous changes with- in the lung (20, 21). Our results showed a good correla- tion between abnormally low attenuated lung volume measurements and disease severity, which is reflected by the physiologic values from the pulmonary function test. Therefore, we believe that volumetric scanning of the entire lung via the MDCT is useful and representa- tive of underlying pulmonary function.
Our study had the following limitations. Firstly, the study population was too small to generalize the results.
Secondly, we did not include normal control subjects.
Thirdly, the MDCT scans were performed during inspi- ration. Although several studies have demonstrated that expiratory parameters correlate more closely with air- flow obstruction and air trapping than inspiratory para- meters, in our study, the quantitative lung volumes ob- tained during inspiration correlated well with the PFT parameters. Fourthly, CT densitometry is influenced by the level of inspiration during CT. We did not use spiro- metric gating to control for lung volume during CT ac- quisition. Hence, we cannot exclude the possibility that an inadequate inspiratory effort by the patient could lead to an increase in lung attenuation, potentially simu- lating the histogram metric changes correlated to lung fi- brosis. These limitations will need to be addressed in fu- ture studies.
In conclusion, the volumetric measurements obtained by MDCT can provide accurate quantification of lung volume in COPD patients. In addition, the measure- ments with MDCT correlate well with disease severity, as determined by a PFT. Therefore, we believe that vol- umetric scanning of the entire lung by MDCT is a promising tool for the diagnosis and monitoring of the progression of emphysema in COPD patients.
References
1. Jeffery PK. Remodeling in asthma and chronic obstructive lung disease. Am J Respir Crit Care Med 2001;164(10 pt 2):S28-S38 2. Spiropoulos K, Trakada G, Kalamboka D, Kalogeropoulou C,
Petsas T, Efremidis G, et al. Can high resolution computed tomog- raphy predict lung function in patients with chronic obstructive pulmonary disease? Lung 2003;181:169-181
3. Arakawa A, Yamashita Y, Nakayama Y, Kadota M, Korogi H, Kawano O, et al. Assessment of lung volumes in pulmonary em- physema using multidetector helical CT: comparison with pul- monary function tests. Comput Med Imaging Graph 2001;25:399- 404
4. Gevenois PA, de Maertelaer V, De Vuyst P, Zanen J, Yernault JC.
Comparison of computed density and macroscopic morphometry
in pulmonary emphysema. Am J Respir Crit Care Med 1995;152:
653-657
5. Gevenois PA, De Vuyst P, de Maertelaer V, Zanen J, Jacobovitz D, Cosio MG, et al. Comparison of computed density and microscop- ic morphometry in pulmonary emphysema. Am J Respir Crit Care Med 1996;154:187-192
6. Gevenois PA, De Vuyst P, Sy M, Scillia P, Chaminade L, de Maertelaer V, et al. Pulmonary emphysema: quantitative CT dur- ing expiration. Radiology 1996;199:825-829
7. Rienmu¨ller RK, Behr J, Kalender WA, Scha¨tzl M, Altmann I, Merin M, et al. Standardized quantitative high resolution CT in lung disease. J Comput Assist Tomogr 1991;15:742-749
8. Hu H, He HD, Foley WD, Fox SH. Four multidetector-row helical CT: image quality and volume coverage. Radiology 2000;215:55-62 9. Pauwels RA, Buist AS, Calverley PM, Jenkins CR, Hurd SS; GOLD
Scientific Committee. Global strategy for the diagnosis, manage- ment, and prevention of chronic obstructive pulmonary disease.
NHLBI/WHO Global Initiative for Chronic Obstructive Lung Disease (GOLD) Workshop summary. Am J Respir Crit Care Med 2001;163:1256-1276
10. Park KJ, Bergin CJ, Clausen JL. Quantitation of emphysema with three-dimensional CT densitometry: comparison with two-dimen- sional analysis, visual emphysema scores, and pulmonary function test results. Radiology 1999;211:541-547
11. Lucidarme O, Coche E, Cluzel P, Mourey-Gerosa I, Howarth N, Grenier P. Expiratory CT scans for chronic airway disease: correla- tion with pulmonary function test results. AJR Am J Roentgenol 1998;170:301-307
12. Knudson RJ, Standen JR, Kaltenborn WT, Knudson DE, Rehm K, Habib MP, et al. Expiratory computed tomography for assessment of suspected pulmonary emphysema. Chest 1991;99:1357-1366 13. Eda S, Kubo K, Fujimoto K, Matsuzawa Y, Sekiguchi M, Sakai F.
The relations between expiratory chest CT using helical CT and pulmonary function tests in emphysema. Am J Respir Crit Care Med 1997;155:1290-1294
14. Mergo PJ, Williams WF, Gonzalez-Rothi R, Gibson R, Ros PR, Staab EV, et al. Three-Dimensional volumetric assessment of ab- normally low attenuation of the lung from routine helical CT: in- spiratory and expiratory quantification. AJR Am J Roentgenol 1998;170:1355-1360
15. Verschakelen JA, Van fraeyenhoven L, Laureys G, Demedts M, Baert AL. Differences in CT density between dependent and nondependent portions of the lung: influence of lung volume. AJR Am J Roentgenol 1993;161:713-717
16. Sandhaus RA. α1-Antitrypsin deficiency 6: new and emerging treatments for α1-antitrypsin deficiency. Thorax 2004;59:904-909 17. Juvelekian GS, Stoller JK. Augmentation therapy for alpha(1)-antit-
rypsin deficiency. Drugs 2004;64:1743-1756
18. Wan IY, Toma TP, Geddes DM, Snell G, Williams T, Venuta F, et al. Bronchoscopic lung volume reduction for end-stage emphyse- ma: report on the first 98 patients. Chest 2006;129:518-526 19. Toma TP, Hopkinson NS, Hillier J, Hansell DM, Morgan C,
Goldstraw PG, et al. Bronchoscopic volume reduction with valve implants in patients with severe emphysema. Lancet 2003;361:
931-933
20. Bankier AA, Madani A, Gevenois PA. CT quantification of pul- monary emphysema: assessment of lung structure and function.
Crit Rev Comput Tomogr 2002;43:399-417
21. Goldin JG. Quantitative CT of emphysema and the airways. J Thorac Imaging 2004;19:235-240
대한영상의학회지 2008;59:91-97
만성 폐쇄성 폐질환 환자에서 MDCT를 사용한 폐용적의 정량분석
11연세대학교 의과대학 영상의학과
2연세대학교 의과대학 호흡기내과
이상민・허 진・김태훈・김상진・김형중2
목적: 만성폐쇄성 폐질환 환자에서 MDCT를 이용한 폐 용적 정량분석의 임상적 유용성과, 측정된 폐 용적과 폐 기 능 검사에 의한 질환의 중증도와의 관계를 알아보는 것을 목적으로 하였다.
대상과 방법: MDCT와 폐 기능 검사를 시행한 39명의 만성폐쇄성 폐질환 환자를 대상으로 하였다. GOLD 분류법 을 사용하여 환자들을 질환의 중증도에 따라 stage I(경증, 10명), stage II(중등증, 15명) 그리고 stage III(중증, 14명)로 분류하였다. Pulmo-CT 프로그램 분석을 이용하여 MDCT에서 역치가 HU값이 -910 이하 와 -950 이 하인 경우에서 폐 용적을 측정하였다.
결과: FEV1(% of predicted) 과 FEV1/FVC는 각 Stage에 따라서 82.2 ± 2%, 66.2 ± 3%(stage I), 53.5 ± 11%, 52 ± 6%(stage II) 그리고 32.3 ± 7%, 44.2 ± 13%(stage III)로 측정되었다. 각 역치값(-910와 -950 HU)에서 측정한 폐 용적은 질환의 중증도에 따라 통계학적으로 유의한 차이가 있었다(p < 0.01, p < 0.01).
두 역치값(-910와 -950HU)에서 측정한 폐 용적률은 FEV1과 FEV1/FVC와 잘 일치하였다(r=-0.803, r=-0.766, r=-0.817, r=-0.795).
결론: MDCT를 이용한 폐 용적의 측정법은 폐기종을 정량화할 수 있는 유용한 방법이다.