ABSTRACT
Background: Little is known regarding the safe fixed dose of mycophenolic acid (MPA) for preventing biopsy-proven acute rejection (BPAR) in kidney transplant recipients (KTRs).
We investigated the correlation of MPA trough concentration (MPA C0) and dose with renal transplant outcomes and adverse events.
Methods: This study included 79 consecutive KTRs who received MPA with tacrolimus (TAC) and corticosteroids. The MPA C0 of all the enrolled KTRs was measured, which was determined monthly by using particle-enhanced turbidimetric inhibition immunoassay for 12 months, and clinical data were collected at each time point. The clinical endpoints included BPAR, any cytopenia, and BK or cytomegalovirus infections.
Results: No differences in MPA C0 and dose were observed between KTRs with or without BPAR or viral infections under statistically comparable TAC concentrations. MPA C0 was significantly higher in patients with leukopenia (P = 0.021) and anemia (P = 0.002) compared with those without cytopenia. The MPA dose was significantly higher in patients with thrombocytopenia (P = 0.002) compared with those without thrombocytopenia. MPA C0 ≥ 3.5 µg/mL was an independent risk factor for leukopenia (adjusted odds ratio [AOR], 3.80; 95%
confidence interval [CI], 1.24–11.64; P = 0.019) and anemia (AOR, 5.90; 95% CI, 1.27–27.51;
P = 0.024). An MPA dose greater than the mean value of 1,188.8 mg/day was an independent risk factor for thrombocytopenia (AOR, 3.83; 95% CI, 1.15–12.78; P = 0.029). However, an MPA dose less than the mean value of 1,137.3 mg/day did not increase the risk of BPAR.
Conclusion: Either a higher MPA C0 or dose is associated with an increased risk of cytopenia, but neither a lower MPA C0 nor dose is associated with BPAR within the first year of
transplantation. Hence, a reduced MPA dose with TAC and corticosteroids might be safe in terms of reducing hematologic abnormalities without causing rejection.
Keywords: Mycophenolic Acid; Kidney Transplantation; Drug Monitoring; Dose; Graft Rejection
Original Article
Received: Mar 3, 2020 Accepted: Apr 21, 2020 Address for Correspondence:
Chan-Duck Kim, MD, PhD
Division of Nephrology, Department of Internal Medicine, School of Medicine, Kyungpook National University, Kyungpook National University Hospital 130 Dongdeok-ro, Jung-gu, Daegu 41944, Republic of Korea.
E-mail: [email protected]
*Hee-Yeon Jung and Sukyung Lee contributed equally to this work.
© 2020 The Korean Academy of Medical Sciences.
This is an Open Access article distributed under the terms of the Creative Commons Attribution Non-Commercial License (https://
creativecommons.org/licenses/by-nc/4.0/) which permits unrestricted non-commercial use, distribution, and reproduction in any medium, provided the original work is properly cited.
ORCID iDs Hee-Yeon Jung
https://orcid.org/0000-0003-0232-7202 Sukyung Lee
https://orcid.org/0000-0002-4727-1049 Yena Jeon
https://orcid.org/0000-0002-4857-8616 Ji-Young Choi
https://orcid.org/0000-0002-9774-3665 Jang-Hee Cho
https://orcid.org/0000-0002-7031-5214 Sun-Hee Park
https://orcid.org/0000-0002-0953-3343 Yong-Lim Kim
https://orcid.org/0000-0002-1344-3455
Hee-Yeon Jung ,1* Sukyung Lee ,2* Yena Jeon ,3 Ji-Young Choi ,1 Jang-Hee Cho ,1 Sun-Hee Park ,1 Yong-Lim Kim ,1 Hyung-Kee Kim ,4 Seung Huh ,4 Dong Il Won ,5 and Chan-Duck Kim 1
1 Department of Internal Medicine, School of Medicine, Kyungpook National University, Kyungpook National University Hospital, Daegu, Republic of Korea
2Department of Internal Medicine, Pohang St. Mary's Hospital, Pohang, Republic of Korea
3 Department of Statistics, College of Natural Sciences, Kyungpook National University, Daegu, Republic of Korea
4 Department of Surgery, School of Medicine, Kyungpook National University, Kyungpook National University Hospital, Daegu, Republic of Korea
5 Department of Clinical Pathology, School of Medicine, Kyungpook National University, Kyungpook National University Hospital, Daegu, Republic of Korea
Mycophenolic Acid Trough Concentration and Dose Are Associated with
Hematologic Abnormalities but Not
Rejection in Kidney Transplant Recipients
Cell Therapy &
Organ Transplantation
Hyung-Kee Kim
https://orcid.org/0000-0002-4436-7424 Seung Huh
https://orcid.org/0000-0002-0275-4960 Dong Il Won
https://orcid.org/0000-0002-1983-2515 Chan-Duck Kim
https://orcid.org/0000-0002-4648-0324 Funding
This research was supported by a grant from the Korea Health Technology R&D Project through the Korea Health Industry Development Institute (KHIDI), which is funded by the Ministry of Health & Welfare, Republic of Korea (HI13C1232).
Disclosure
The authors have no potential conflicts of interest to disclose.
Author Contributions
Conceptualization: Jung HY, Lee S, Kim CD.
Formal analysis: Jung HY, Lee S, Jeon Y, Kim CD. Investigation: Jung HY, Choi JY, Cho JH, Park SH, Kim YL, Kim HK, Huh S, Won DI, Kim CD. Methodology: Jung HY, Lee S, Jeon Y, Won DI, Kim CD. Writing - original draft: Jung HY, Lee S. Writing - review & editing: Jung HY, Lee S, Kim CD.
INTRODUCTION
Mycophenolic acid (MPA) is a widely used first-line immunosuppressant for preventing acute rejection after kidney transplantation (KT). MPA is a non-competitive, reversible inhibitor of inosine monophosphate dehydrogenase, resulting in the inhibition of guanine nucleotide biosynthesis. Consequently, it blocks T- and B-lymphocyte proliferation.1 MPA is highly protein bound, metabolized in the liver, and primarily eliminated by the kidneys.
The MPA blood concentration can be affected by several factors and leads to wide inter- and intra-individual variability.2 For a fixed MPA dose of 1g twice daily, MPA exposure can vary by approximately 10-fold.3 Therefore, therapeutic drug monitoring (TDM) for MPA has received attention in the transplant area.
Previous studies have shown the significant association between MPA TDM and clinical outcomes using the MPA area under the curve (AUC) or pre-dose MPA trough concentration (MPA C0) in kidney transplant recipients (KTRs). Van Gelder et al.4 demonstrated that MPA AUC is related to the incidence of biopsy-proven rejection and the therapeutic AUC range of MPA is from 30 to 60 mg h/L after KT. Le Meur et al.5 reported that therapeutic MPA monitoring using a limited sampling strategy can reduce the risk of treatment failure and acute rejection in KTRs. Although MPA C0 was not correctly correlated with MPA AUC, several studies have shown an association between MPA C0 and rejection and toxicity, and an MPA C0 between 1.0 and 3.5 μg/mL was suggested as an optimal therapeutic target.6-9 However, some studies comparing a fixed dose of MPA and a controlled dose of MPA failed to demonstrate the efficacy of the latter.10,11 The Transplantation Society consensus meeting recommended TDM for MPA in high-risk KTRs, patients with delayed graft function, patients excluding induction therapy, corticosteroids, or calcineurin inhibitor (CNI), or patients with CNI minimization. However, there has been no definite consensus on MPA TDM and MPA TDM is currently used in a few transplant centers. Furthermore, little is known regarding the safe fixed dose of MPA for preventing biopsy-proven acute rejection (BPAR) in KTRs.
Our transplant center measured MPA C0 on a routine basis through particle-enhanced turbidimetric inhibition immunoassay (PETINIA), the efficacy of which was previously proven through a comparative study with liquid chromatography combined with mass spectrometry.12 This study aimed to investigate the correlation of MPA C0 and MPA dose with adverse events and transplant outcomes after KT.
METHODS
Patients and immunosuppression
This study included 79 consecutive patients who underwent KT at Kyungpook National University Hospital. All KTRs received MPA, tacrolimus (TAC), and corticosteroids as immunosuppressant therapy. Mycophenolate mofetil (MMF) or enteric-coated mycophenolate sodium (EC-MPS) were administered. MPA was initially given at a fixed dose of 750 mg of MMF or 540 mg of EC-MPS every 12 hours. The MPA dosage was adjusted based on the physician's decision according to the immunologic risk of each patient. TAC was initially given at a dose of 0.05 mg/kg every 12 hours. The TAC dosage was adjusted based on the physician's decision according to the TAC C0 results to maintain the target TAC C ranging from 5–10 ng/mL.13 A dose of 500 mg of intravenous methylprednisolone
Information regarding the dose of the administered immunosuppressive agent and TDM of MMF, EC-MPS, and TAC was collected. This study only evaluated the trough levels and immunosuppressant dose before adverse events occurred.
Assays for TDM of MPA and TAC
The MPA C0 of all KTRs was monitored weekly within the first month post-transplant and monthly thereafter for up to 12 months. MPA C0 was measured using PETINIA (Siemens Healthcare Diagnostics Inc., Malvern, PA, USA), and the blood chemistry results of each patient were collected during sampling. TAC trough levels were obtained from peripheral blood samples taken 12 hours after the administration of the last TAC dose. TAC C0 was measured using the Architect TAC assay (Abbott Diagnostics, Lake Forest, IL, USA). The coefficient of variation (CV, %) was defined as the standard deviation/mean trough level of the immunosuppressant × 100 to determine within-patient variability in immunosuppressant trough levels.14
Clinical endpoints
The clinical endpoints include BPAR, leukopenia defined as total white cell count below 4.0
× 103/μL, anemia defined as hemoglobin count below 10 g/dL, thrombocytopenia defined as platelet count below 150.0 × 10³/μL, viral infection consisting of BK virus infection defined as an occurrence of BK viremia (≥ 104 copies/mL) or BK viruria (≥ 107 copies/mL), or diagnosed biopsy-proven BK virus nephropathy and cytomegalovirus (CMV) infection defined as a presence of significant CMV polymerase chain reaction or diagnosed CMV disease, which remain major obstacles in long-term renal allograft survival.15
Statistical analysis
Continuous variables were expressed as means ± standard deviation for normally distributed data and as a median with a range when the values were not normally distributed. The differences between the groups were tested through an independent sample t-test or χ2 test, as appropriate. To analyze the association between MPA C0, dose, and the clinical endpoints, an EC-MPS of 180 mg was converted to an MMF of 250 mg. The association between the mean value of MPA C0 and dose which were obtained prior to adverse events and clinical endpoints was analyzed. Correlations between the MPA dose and MPA C0 were analyzed with Pearson's correlation. To determine the effect of MPA C0 and dose on the clinical endpoints, multivariate logistic regression analysis was used by adjusting for clinical variables, such as age, gender, body mass index (BMI), TAC C0, the CV of TAC, baseline white blood cell (WBC) count, hemoglobin, platelets, estimated glomerular filtration rate (eGFR), and albumin.
Statistical analysis was performed using the SAS system for Windows, version 9.2 (SAS Institute Inc., Cary, NC, USA). P values of < 0.05 were considered statistically significant.
Ethics statement
The study protocol was reviewed and approved by the Institutional Review Board of Kyungpook National University Hospital (No. 2018-10-023). All clinical investigations were conducted in accordance with the guidelines of the 2008 Declaration of Helsinki. The informed consent was waived because the study was conducted by retrospective review of medical records. All patient information were anonymized and they were de-identified before analyses.
RESULTS
Baseline characteristics
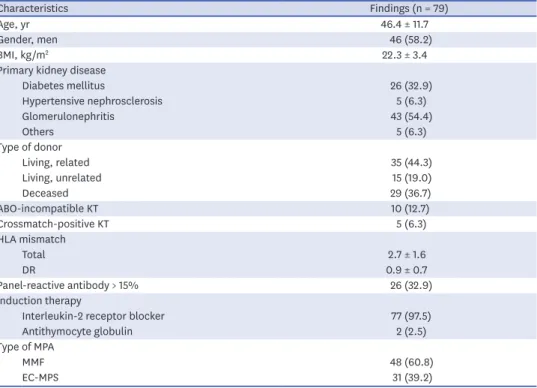
Table 1 shows the baseline characteristics of the included KTRs. The mean age of the KTRs was 46.4 years, and 58.2% were men. Glomerulonephritis was the most common cause of primary kidney disease. Ten (12.7%) and five (6.3%) patients underwent ABO-incompatible and crossmatch-positive KT, respectively. A total of 97.5% of patients received interleukin-2 receptor blocker as an induction therapy. A total of 60.8% and 39.2% of patients used MMF and EC-MPS, respectively.
Immunosuppressant dose and exposure
MPA C0 was significantly correlated with daily MMF dose (R2 = 0.083, P < 0.001) and daily EC-MPS dose (R2 = 0.020, P = 0.008) (Fig. 1). MPA C0 was correlated with TAC C0 (R2 = 0.017, P < 0.001) (Fig. 2).
Immunosuppressive agent dosage and trough concentration level according to adverse events
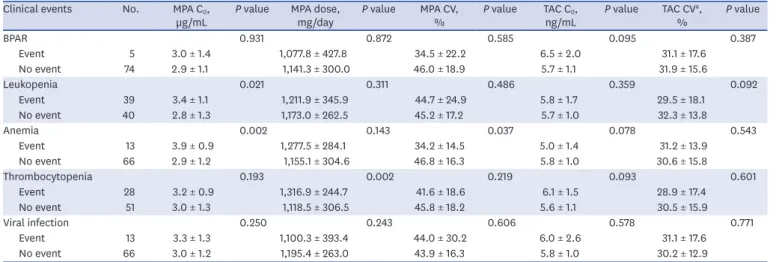
No significant differences were observed in TAC C0 and CV between KTRs with and without adverse events (Table 2). MPA C0 was significantly higher in patients with leukopenia (3.4
± 1.1 µg/mL vs. 2.8 ± 1.3 µg/mL, P = 0.021) and anemia (3.9 ± 0.9 µg/mL vs. 2.9 ± 1.2 µg/mL, P = 0.002) compared with patients without adverse events. The MPA dose was significantly higher in patients with thrombocytopenia (1,316.9 ± 244.7 mg/day vs. 1,118.5 ± 306.5 mg/
day; P = 0.002) compared with those without thrombocytopenia (Table 2). However, no significant differences in MPA C0 and MPA dose were observed in patients with BPAR or viral infection compared with those without BPAR or viral infection.
Table 1. Baseline characteristics of enrolled kidney transplant recipients
Characteristics Findings (n = 79)
Age, yr 46.4 ± 11.7
Gender, men 46 (58.2)
BMI, kg/m2 22.3 ± 3.4
Primary kidney disease
Diabetes mellitus 26 (32.9)
Hypertensive nephrosclerosis 5 (6.3)
Glomerulonephritis 43 (54.4)
Others 5 (6.3)
Type of donor
Living, related 35 (44.3)
Living, unrelated 15 (19.0)
Deceased 29 (36.7)
ABO-incompatible KT 10 (12.7)
Crossmatch-positive KT 5 (6.3)
HLA mismatch
Total 2.7 ± 1.6
DR 0.9 ± 0.7
Panel-reactive antibody > 15% 26 (32.9)
Induction therapy
Interleukin-2 receptor blocker 77 (97.5)
Antithymocyte globulin 2 (2.5)
Type of MPA
MMF 48 (60.8)
EC-MPS 31 (39.2)
Values are shown as mean ± standard deviation or number (%).
Table 3 demonstrates the number and time of adverse events according to MPA levels of < 3.5 vs.
≥ 3.5 µg/mL. Leukopenia (63.6% vs. 39.1%, P = 0.041) and anemia (33.3% vs. 6.1%, P = 0.003) occurred more frequently in patients with MPA levels of ≥ 3.5 µg/mL compared with those with MPA levels of < 3.5 µg/mL. BPAR, leukopenia, anemia, thrombocytopenia, and viral infection occurred on average 5.8, 5.8, 5.4, 5.0, and 6.0 months after KT, respectively.
Multivariate logistic regression analysis revealed that MPA C0 ≥ 3.5 µg/mL was an independent risk factor for leukopenia (adjusted odds ratio [AOR], 3.80; 95% confidence interval [CI], 1.24–11.64; P = 0.019) and anemia (AOR, 5.90; 95% CI, 1.27–27.51; P = 0.024) (Table 4). An MPA dose greater than the mean value of 1,188.8 mg/day was an independent risk factor for thrombocytopenia (AOR, 3.83; 95% CI, 1.15–12.78; P = 0.029). However, MPA C0 < 3.5 µg/mL, MPA dose < 1,137.3 mg/day, and MPA CV ≥ 45.3% were not independently associated with BPAR.
0 500 7.5
2.5 10.0
5.0 MMF C0
MMF dose A
1,000 1,500 2,000 0
360 7.5
2.5 10.0
5.0 EC-MPS C0
EC-MPS dose B
540 720 900 1,080
Fig. 1. Correlations between MPA C0 and MPA dose. MPA C0 was correlated with (A) daily MMF dose (R2 = 0.083, β = 0.002, P < 0.001) and (B) EC-daily MPS dose (R2 = 0.020, β = 0.001, P = 0.008).
MPA = mycophenolic acid, C0 = trough concentration, MMF = mycophenolate mofetil, EC-MPS = enteric-coated mycophenolate sodium.
00 7.5
2.5 10.0
A CMP0 5.0
TAC C0
5 10 15 20
Fig. 2. Correlations between MPA C0 and TAC C0. MPA C0 was correlated with TAC C0 (R2 = 0.017, P < 0.001).
MPA = mycophenolic acid, C0 = trough concentration, TAC = tacrolimus.
Table 2. Immunosuppressive agent dosage and trough concentration level according to adverse events Clinical events No. MPA C0,
µg/mL P value MPA dose,
mg/day P value MPA CV,
% P value TAC C0,
ng/mL P value TAC CVa,
% P value
BPAR 0.931 0.872 0.585 0.095 0.387
Event 5 3.0 ± 1.4 1,077.8 ± 427.8 34.5 ± 22.2 6.5 ± 2.0 31.1 ± 17.6
No event 74 2.9 ± 1.1 1,141.3 ± 300.0 46.0 ± 18.9 5.7 ± 1.1 31.9 ± 15.6
Leukopenia 0.021 0.311 0.486 0.359 0.092
Event 39 3.4 ± 1.1 1,211.9 ± 345.9 44.7 ± 24.9 5.8 ± 1.7 29.5 ± 18.1
No event 40 2.8 ± 1.3 1,173.0 ± 262.5 45.2 ± 17.2 5.7 ± 1.0 32.3 ± 13.8
Anemia 0.002 0.143 0.037 0.078 0.543
Event 13 3.9 ± 0.9 1,277.5 ± 284.1 34.2 ± 14.5 5.0 ± 1.4 31.2 ± 13.9
No event 66 2.9 ± 1.2 1,155.1 ± 304.6 46.8 ± 16.3 5.8 ± 1.0 30.6 ± 15.8
Thrombocytopenia 0.193 0.002 0.219 0.093 0.601
Event 28 3.2 ± 0.9 1,316.9 ± 244.7 41.6 ± 18.6 6.1 ± 1.5 28.9 ± 17.4
No event 51 3.0 ± 1.3 1,118.5 ± 306.5 45.8 ± 18.2 5.6 ± 1.1 30.5 ± 15.9
Viral infection 0.250 0.243 0.606 0.578 0.771
Event 13 3.3 ± 1.3 1,100.3 ± 393.4 44.0 ± 30.2 6.0 ± 2.6 31.1 ± 17.6
No event 66 3.0 ± 1.2 1,195.4 ± 263.0 43.9 ± 16.3 5.8 ± 1.0 30.2 ± 12.9
Values are shown as mean ± standard deviation.
BPAR = biopsy-proven acute rejection, C0 = trough concentration, CV = coefficient of variation, MPA = mycophenolic acid, TAC = tacrolimus.
aCV = standard deviation/mean × 100.
Table 3. Number and time of adverse events according to MPA levels of < 3.5 vs. ≥ 3.5 µg/mL
No. of events Time of events, mon < 3.5 µg/mL ≥ 3.5 µg/mL P value
Biopsy-proven acute rejection 5.8 ± 3.2 3/52 (5.8) 2/27 (7.4) 1.000
Leukopenia 5.8 ± 2.7 18/46 (39.1) 21/33 (63.6) 0.041
Anemia 5.4 ± 3.1 3/49 (6.1) 10/30 (33.3) 0.003
Thrombocytopenia 5.0 ± 2.2 14/49 (28.6) 14/30 (46.7) 0.146
Viral infection 6.0 ± 2.9 5/49 (10.2) 8/30 (26.7) 0.068
Values are shown as mean ± standard deviation or number (%).
MPA = mycophenolic acid.
Table 4. Univariate and multivariate logistic regression analysis for clinical endpoints
Clinical events Univariate Multivariate
OR (95% CI) P value OR (95% CI) P value
BPAR
MPA C0 ≥ 3.5 vs. < 3.5 µg/mL 1.31 (0.21–8.34) 0.777 0.76 (0.07–8.57) 0.822
MPA dose ≥ mean vs. < mean (1,137.3 mg/day) 0.54 (0.09–3.40) 0.509 0.63 (0.06–6.75) 0.702
MPA CVa < mean vs. ≥ mean (45.3%) 0.97 (0.15–6.14) 0.971 0.47 (0.04–5.29) 0.538
Leukopenia
MPA C0 ≥ 3.5 vs. < 3.5 µg/mL 2.72 (1.08–6.86) 0.034 3.80 (1.24–11.64) 0.019
MPA dose ≥ mean vs. < mean (1,192.2 mg/day) 1.44 (0.59–3.50) 0.424 1.26 (0.45–3.51) 0.660
MPA CVa < mean vs. ≥ mean (45.0%) 1.46 (0.59–3.61) 0.411 1.02 (0.33–3.09) 0.977
Anemia
MPA C0 ≥ 3.5 vs. < 3.5 µg/mL 7.67 (1.90–30.87) 0.004 5.90 (1.27–27.51) 0.024
MPA dose ≥ mean vs. < mean (1,175.2 mg/day) 1.99 (0.56–7.12) 0.288 2.04 (0.48–8.76) 0.336
MPA CVa < mean vs. ≥ mean (45.2%) 3.81 (0.78–18.56) 0.098 3.95 (0.55–28.52) 0.173
Thrombocytopenia
MPA C0 ≥ 3.5 vs. < 3.5 µg/mL 2.19 (0.85–5.64) 0.106 1.98 (0.63–6.26) 0.246
MPA dose ≥ mean vs. < mean (1,188.8 mg/day) 3.12 (1.13–8.62) 0.028 3.83 (1.15–12.78) 0.029
MPA CVa < mean vs. ≥ mean (44.3%) 1.37 (0.53–3.54) 0.521 0.48 (0.13–1.72) 0.256
Viral infection
MPA C0 ≥ 3.5 vs. < 3.5 µg/mL 3.20 (0.94–10.94) 0.064 4.05 (0.96–17.06) 0.057
MPA dose ≥ mean vs. < mean (1,179.7 mg/day) 0.33 (0.09–1.17) 0.086 0.25 (0.06–1.03) 0.054
MPA CVa < mean vs. ≥ mean (43.9%) 0.81 (0.24–2.67) 0.726 0.77 (0.21–2.89) 0.699
Adjusted variables for multivariate analysis: BPAR: age, gender, BMI, number of total HLA mismatches, use of ATG, tacrolimus C0, tacrolimus CV, baseline eGFR, and albumin; leukopenia: age, gender, BMI, number of total HLA mismatches, use of ATG, baseline white blood cell count, eGFR, and albumin; anemia: age, gender, BMI, number of total HLA mismatches, use of ATG, baseline hemoglobin, eGFR, and albumin; thrombocytopenia: age, gender, BMI, number of total HLA mismatches, use of ATG, baseline platelets, eGFR, and albumin; viral infection: age, gender, use of ATG, tacrolimus C0, tacrolimus CV.
BMI = body mass index, BPAR = biopsy-proven acute rejection, C = trough concentration, CI = confidence interval, CV = coefficient of variation, eGFR = estimated
Women with MPA C0 ≥ 3.5 µg/mL showed significantly higher risks of leukopenia (AOR, 7.21; 95% CI, 1.31–39.65; P = 0.023) and anemia (AOR, 8.00; 95% CI, 1.24–51.46; P = 0.028) compared with those with MPA C0 < 3.5 µg/mL. However, men did not have higher risks of leukopenia and anemia depending on MPA C0 (Table 5).
DISCUSSION
Our results demonstrate that either a higher MPA C0 or MPA dose is independently associated with an increased risk of leukopenia, anemia, and thrombocytopenia within the first year of transplantation. However, neither a lower MPA C0 nor doses were associated with BPAR under statistically comparable TAC concentrations in KTRs receiving induction therapy, TAC, and corticosteroids. Considering that a positive correlation between MPA dose and MPA C0 was observed, the individualized adjustment of the MPA dose based on MPA C0 might optimize transplant outcomes by achieving a safe fixed dose of MPA in individual KTRs.
Little is known regarding the optimal safe dose of MPA in KTRs with TAC-based immunosuppression therapy. A previous study has reported that TAC-treated KTRs receiving an initial MPA dose of < 2,000 mg/day did not have an increased risk of BPAR or renal allograft loss.16 However, considering that the mean dose of MPA in Korean KTRs is 1,000–1,500 mg/day,17 the lower safe threshold for MPA dose is required. A notable finding of this study is that an MPA dose of less than approximately 1,100 mg daily was not associated with the increased risk of BPAR in TAC and corticosteroid-treated KTRs within 1 year post- transplant. Furthermore, a MPA dose greater than approximately 1,100 mg daily or MPA C0
greater than 3.5 ng/L was associated with cytopenia. This result suggests that there might be no need to insist on a fixed MPA dose of 1,500 mg daily to prevent BPAR in KTRs receiving TAC and corticosteroids with normal BMI even during the initial period after KT.
There have been a few studies regarding MPA C0 and cytopenia, viral infection, and BPAR in KTRs.9,18 Contrary to the results of previous studies, MPA C0 was not associated with BPAR in our study. A possible explanation for this may be that the mean MPA C0 of KTRs without BPAR in the current study was 2.9 mg/L, which was considerably higher than the rejection- free MPA C0 cutoff level of 1.6–1.7 µg/L suggested by previous MPA C0-based studies.9,18 We found that the target TDM of MPA was achieved with a reduced dose of MPA and the incidence of BPAR was considerably low, even for KTRs given low-dose MPA. Although MPA C0 was significantly correlated with both daily MMF dose and EC-daily MPS dose, the correlation between MPA C0 and dose might be stronger in MMF than in EC-MPS. This subtle difference according to the type of MPA might be explained by the main differences in pharmacokinetics profile between MMF and EC-MPS. Because EC-MPS is absorbed more slowly than MMF, the time to peak concentration is more variable19,20 and this might result Table 5. Multivariate logistic regression analysis for gender interaction in the association between MPA C0 and leukopenia and anemia
Clinical events Variable Gender OR (95% CI) P value
Leukopenia MPA C0 ≥ 3.5 µg/mL Men 1.50 (0.38–5.92) 0.562
Women 7.21 (1.31–39.65) 0.023
Anemia MPA C0 ≥ 3.5 µg/mL Men 4.00 (0.34–47.65) 0.273
Women 8.00 (1.24–51.46) 0.028
Adjusted variables for multivariate analysis: leukopenia: BMI and baseline white blood cell count; anemia: BMI and baseline hemoglobin.
BMI = body mass index, C0 = trough concentration, CI = confidence interval, MPA = mycophenolic acid, OR = odds ratio.
in significant but weak correlation between EC-MPS dosage and MPA C0. In this study, MPA C0 was also correlated with TAC C0. This means that patients were prescribed similar levels of immunosuppressive strength regardless of the type of immunosuppressive agents.
Decreased kidney function and hypoalbuminemia are associated with increased MPA levels.9,21,22 The result of this study has clinical significance in that MPA dose or MPA C0
was independently correlated with hematologic toxicity even after adjusting considerable variables, including renal function and albumin levels. In this study, only women had higher risks of leukopenia and anemia depending on MPA C0. Considering gender differences in pharmacokinetics and pharmacodynamics,23 differential therapeutic goals for MPA should be established according to gender to minimize adverse events. Even if hematologic side effects respond well and are completely reversible after dose reduction, considering the detrimental effect of anemia on poor patient and renal allograft outcomes,24 the regular monitoring of MPA exposure and preemptive adjustment of MPA could be crucial for clinicians to improve hard transplant outcomes.
This study has some limitations. First, the study design was retrospective and included a relatively small number of patients. Second, even though previous studies including African Americans and Caucasians have reported that no significant differences in MPA pharmacokinetics were observed according to ethnicity,25,26 it is difficult to generalize these findings to other ethnicities as this is a study of an Asian population. Third, although there was a significant correlation between MPA C0 and dose, considering the high intra-individual variability of MPA C0,9 dosage adjustment to achieve the target MPA C0 might require caution.
Nevertheless, the current study has several strengths. First, we suggested an optimal and safe dose of MPA for Korean KTRs. Second, considering the significant correlation between MPA dose and MPA C0, the MPA C0-guided MPA dose individualization could optimize proper immunosuppression in KTRs. Third, because this study included relatively low- and moderate-risk KTRs and monitoring MPA C0 is much more practical than the AUC-based approach, which is cumbersome and time-consuming, the current study provided evidence of TDM MPA C0, which could be easily applied to the low- and moderate-risk KT population as well as high-risk patients in routine practice.
In conclusion, an MPA dose of less than approximately 1,100 mg daily or MPA C0 below approximately 3.5 µg/L reduces the risk of hematologic side effects in KTRs without causing BPAR within the first year of transplantation. In the early posttransplant period, MPA dose individualization using MPA C0 might be feasible and could have clinical significance for achieving a safe fixed dose of MPA in individual KTRs.
REFERENCES
1. Ransom JT. Mechanism of action of mycophenolate mofetil. Ther Drug Monit 1995;17(6):681-4.
PUBMED | CROSSREF
2. Staatz CE, Tett SE. Clinical pharmacokinetics and pharmacodynamics of mycophenolate in solid organ transplant recipients. Clin Pharmacokinet 2007;46(1):13-58.
PUBMED | CROSSREF
3. Shaw LM, Korecka M, Venkataramanan R, Goldberg L, Bloom R, Brayman KL. Mycophenolic acid pharmacodynamics and pharmacokinetics provide a basis for rational monitoring strategies. Am J
4. van Gelder T, Hilbrands LB, Vanrenterghem Y, Weimar W, de Fijter JW, Squifflet JP, et al. A randomized double-blind, multicenter plasma concentration controlled study of the safety and efficacy of oral mycophenolate mofetil for the prevention of acute rejection after kidney transplantation. Transplantation 1999;68(2):261-6.
PUBMED | CROSSREF
5. Le Meur Y, Büchler M, Thierry A, Caillard S, Villemain F, Lavaud S, et al. Individualized mycophenolate mofetil dosing based on drug exposure significantly improves patient outcomes after renal
transplantation. Am J Transplant 2007;7(11):2496-503.
PUBMED | CROSSREF
6. Mourad M, Malaise J, Chaib Eddour D, De Meyer M, König J, Schepers R, et al. Pharmacokinetic basis for the efficient and safe use of low-dose mycophenolate mofetil in combination with tacrolimus in kidney transplantation. Clin Chem 2001;47(7):1241-8.
PUBMED | CROSSREF
7. Armstrong VW, Shipkova M, Schütz E, Weber L, Tönshoff B, Oellerich M, et al. Monitoring of mycophenolic acid in pediatric renal transplant recipients. Transplant Proc 2001;33(1-2):1040-3.
PUBMED | CROSSREF
8. Weber LT, Shipkova M, Armstrong VW, Wagner N, Schütz E, Mehls O, et al. The pharmacokinetic- pharmacodynamic relationship for total and free mycophenolic acid in pediatric renal transplant recipients: a report of the German study group on mycophenolate mofetil therapy. J Am Soc Nephrol 2002;13(3):759-68.
PUBMED
9. Borrows R, Chusney G, Loucaidou M, James A, Lee J, Tromp JV, et al. Mycophenolic acid 12-h trough level monitoring in renal transplantation: association with acute rejection and toxicity. Am J Transplant 2006;6(1):121-8.
PUBMED | CROSSREF
10. Gaston RS, Kaplan B, Shah T, Cibrik D, Shaw LM, Angelis M, et al. Fixed- or controlled-dose mycophenolate mofetil with standard- or reduced-dose calcineurin inhibitors: the Opticept trial. Am J Transplant 2009;9(7):1607-19.
PUBMED | CROSSREF
11. van Gelder T, Silva HT, de Fijter JW, Budde K, Kuypers D, Tyden G, et al. Comparing mycophenolate mofetil regimens for de novo renal transplant recipients: the fixed-dose concentration-controlled trial.
Transplantation 2008;86(8):1043-51.
PUBMED | CROSSREF
12. Ham JY, Jung HY, Choi JY, Park SH, Kim YL, Kim HK, et al. Usefulness of mycophenolic acid monitoring with PETINIA for prediction of adverse events in kidney transplant recipients. Scand J Clin Lab Invest 2016;76(4):296-303.
PUBMED | CROSSREF
13. Jung HY, Cho SY, Choi JY, Cho JH, Park SH, Kim YL, et al. Comparison of transplant outcomes for low- level and standard-level tacrolimus at different time points after kidney transplantation. J Korean Med Sci 2019;34(12):e103.
PUBMED | CROSSREF
14. Rodrigo E, Segundo DS, Fernández-Fresnedo G, López-Hoyos M, Benito A, Ruiz JC, et al. Within-patient variability in tacrolimus blood levels predicts kidney graft loss and donor-specific antibody development.
Transplantation 2016;100(11):2479-85.
PUBMED | CROSSREF
15. Vanichanan J, Udomkarnjananun S, Avihingsanon Y, Jutivorakool K. Common viral infections in kidney transplant recipients. Kidney Res Clin Pract 2018;37(4):323-37.
PUBMED | CROSSREF
16. Doria C, Greenstein S, Narayanan M, Ueda K, Wiland A, McCague K, et al. Association of mycophenolic acid dose with efficacy and safety events in kidney transplant patients receiving tacrolimus: an analysis of the Mycophenolic acid Observational REnal transplant registry. Clin Transplant 2012;26(6):E602-11.
PUBMED | CROSSREF
17. Lee SH, Kim CD, Huh KH, Cho BH, Ju MK, Lee DR, et al. Low-dose mycophenolate mofetil in tablet form or capsule form combined with tacrolimus in the early period after kidney transplantation: a prospective randomized trial. Clin Nephrol 2016;86 (2016)(12):319-27.
PUBMED | CROSSREF
18. Rhu J, Lee KW, Park H, Park JB, Kim SJ, Choi GS. Clinical implication of mycophenolic acid trough concentration monitoring in kidney transplant patients on a tacrolimus triple maintenance regimen: a single-center experience. Ann Transplant 2017;22:707-18.
PUBMED | CROSSREF
19. Cattaneo D, Cortinovis M, Baldelli S, Bitto A, Gotti E, Remuzzi G, et al. Pharmacokinetics of mycophenolate sodium and comparison with the mofetil formulation in stable kidney transplant recipients. Clin J Am Soc Nephrol 2007;2(6):1147-55.
PUBMED | CROSSREF
20. de Winter BC, van Gelder T, Glander P, Cattaneo D, Tedesco-Silva H, Neumann I, et al. Population pharmacokinetics of mycophenolic acid : a comparison between enteric-coated mycophenolate sodium and mycophenolate mofetil in renal transplant recipients. Clin Pharmacokinet 2008;47(12):827-38.
PUBMED | CROSSREF
21. Weber LT, Shipkova M, Lamersdorf T, Niedmann PD, Wiesel M, Mandelbaum A, et al. Pharmacokinetics of mycophenolic acid (MPA) and determinants of MPA free fraction in pediatric and adult renal transplant recipients. German study group on mycophenolate mofetil therapy in pediatric renal transplant recipients. J Am Soc Nephrol 1998;9(8):1511-20.
PUBMED
22. Atcheson BA, Taylor PJ, Kirkpatrick CM, Duffull SB, Mudge DW, Pillans PI, et al. Free mycophenolic acid should be monitored in renal transplant recipients with hypoalbuminemia. Ther Drug Monit 2004;26(3):284-6.
PUBMED | CROSSREF
23. Soldin OP, Mattison DR. Sex differences in pharmacokinetics and pharmacodynamics. Clin Pharmacokinet 2009;48(3):143-57.
PUBMED | CROSSREF
24. Jones H, Talwar M, Nogueira JM, Ugarte R, Cangro C, Rasheed H, et al. Anemia after kidney
transplantation; its prevalence, risk factors, and independent association with graft and patient survival:
a time-varying analysis. Transplantation 2012;93(9):923-8.
PUBMED | CROSSREF
25. Shaw LM, Korecka M, Aradhye S, Grossman R, Bayer L, Innes C, et al. Mycophenolic acid area under the curve values in African American and Caucasian renal transplant patients are comparable. J Clin Pharmacol 2000;40(6):624-33.
PUBMED | CROSSREF
26. Pescovitz MD, Guasch A, Gaston R, Rajagopalan P, Tomlanovich S, Weinstein S, et al. Equivalent pharmacokinetics of mycophenolate mofetil in African-American and Caucasian male and female stable renal allograft recipients. Am J Transplant 2003;3(12):1581-6.
PUBMED | CROSSREF