pISSN 2288-9272 eISSN 2383-8493 J Oral Med Pain 2017;42(1):8-15 https://doi.org/10.14476/jomp.2017.42.1.8
Vocational Preference Inventory of Korean College Students with Symptoms of Temporomandibular Disorders
Hye Sook Park
Department of Dental Technology, Shingu College, Seongnam, Korea
Received February 13, 2017 Revised February 26, 2017 Accepted March 8, 2017
Purpose: The purpose of this study was to assess the association of vocational interest and per- sonality with temporomandibular disorders (TMD).
Methods: Four hundred and fourteen college students in Gyeonggi-do completed Vocational Preference Inventory L form and a questionnaire and collected data were analyzed by R pro- gram.
Results: The percentage of subjects who responded that they had at least one contributing fac- tor for TMD was significantly different among 27 two-letter Holland codes (p<0.05). The two- letter Holland codes of which the first-letter was social (S) (S artistic [A], S investigative [I], S realistic [R], S conventional [C], S enterprising [E]) or C (CE, CS, CA, CI) had tendency of hav- ing the relatively higher prevalence of symptoms and contributing factors for TMD. Among 6 one-letter Holland codes, the prevalence of a symptom of frequent fatigue in the jaw and a habit of gum chewing showed the significant difference (p<0.05). E code seemed to have lower prevalence of a symptom of frequent fatigue in the jaw than other codes. S code appeared to use chewing gum more frequently than other codes. High scorers on emotional instability showed the significantly higher prevalence of TMD symptoms (p<0.05) and contributing fac- tors for TMD (p<0.001) than low scorers. Furthermore, high scorers on emotional instability had significantly higher mean scales of the number of positive answers of TMD symptoms (p<0.01) and of contributing factors for TMD (p<0.001) than low scorers.
Conclusions: Symptoms and contributing factors for TMD were related to emotional instabil- ity. Vocational Preference Inventory L form might be utilized in assessing emotional factors of persons with TMD symptoms.
Key Words: Contributing factor for temporomandibular disorders; Emotional factor; Temporo- mandibular disorders symptom; Vocational Preference Inventory
Correspondence to:
Hye Sook Park
Department of Dental Technology, Shingu College, 377 Gwangmyeong- ro, Jungwon-gu, Seongnam 13174, Korea
Tel: +82-31-740-1575 Fax: +82-31-740-1589 E-mail: [email protected] This study was supported by Specialized College of Korea (SCK) of the Ministry of Education in 2016.
JOMP
Journal of Oral Medicine and PainCopyright Ⓒ 2017 Korean Academy of Orofacial Pain and Oral Medicine. All rights reserved.
CC This is an open-access article distributed under the terms of the Creative Commons Attribution Non-Commercial License (http://creativecommons.org/licenses/by-nc/4.0/), which permits unrestricted non-commercial use, distribution, and reproduction in any medium, provided the original work is properly cited.
INTRODUCTION
Temporomandibular disorders (TMD) are characterized by symptoms that include pain of temporomandibular joint and masticatory muscles, joint sound during mouth open- ing, limitation of mouth opening.
1,2)TMD are caused by occlusal condition, trauma, para- functional activities, deep pain input and emotional stress.
3)Factors that contribute to initiating or perpetuating TMD
contain a habit of resting the cheek on one hand, a habit of biting lips, cheeks, nails or pencils, gum chewing, unilat- eral chewing, teeth clenching, teeth grinding, and insomnia, etc.
4)Epidemiologic studies showed that TMD symptoms oc- curred mostly in the 20 to 40 years old population.
5-7)Vocational Preference Inventory L form is a psycho-
logical inventory that leads people at least 18 years old
to vocational choice and exploration provided by Korea
Employment Information Service. It contains a test of
vocational interests and a personality test. A test of voca- tional interests includes six scales that represent Holland’s RIASEC hexagonal dimensional model of vocational per- sonality types: realistic (R), investigative (I), artistic (A), so- cial (S), enterprising (E), and conventional (C). A personality test is based on the big-five personality factors which are extraversion, agreeableness, conscientiousness, emotional instability, and openness.
8-11)The association of occupations with TMD symptoms has been shown in previous studies.
12-14)There have been studies on relation of personality factors to TMD as psychosomatic disorder.
15-17)It was suggested that vocational preference was predictable from personality profile.
18)Hence, current study has been performed aiming to analyze results of vo- cational preference inventory of college students with TMD symptoms and to assess the association of vocational inter- est and personality with TMD.
MATERIALS AND METHODS
This study is approved by the Institutional Review Board of Shingu College (IRB-2016-101).
1. Subjects
Data were collected from 414 college students in Gyeonggi-do, including 57 men and 357 women. Mean age of the subjects was 19.68±3.04 years (Table 1).
2. Vocational Preference Inventory L Form
Vocational Preference Inventory L form of 415 items con- sists of three parts: a test of vocational interests (204 items), a personality test (166 items), and a biodata test (45 items).
The items for a test of vocational interests are occupational activities, competencies, personal inclinations, occupations, and fields for which respondents express preferences. A biodata test includes characteristics of life-history such as
past behaviors and experiences. After marking like, neutral, or dislike to total items, a respondent receives a result sheet representing a two-letter Holland code calculated from the two highest total scores on the items of vocational interests and a list of associated occupations.
8-11)3. Data Collection
Data were obtained from June to December of 2016. A questionnaire (Appendix 1) was composed of 18 items, among which 10 items (from item number 1 to item number 10) indicated TMD symptoms and 8 items (from item num- ber 11 to item number 18) related to contributing factors for TMD. It was formed referring to a questionnaire
19)recom- mended by the American Academy of Orofacial Pain and a method devised by Nilner.
20)Visiting a classroom, an ex- aminer explained each item of the questionnaire and asked the students to answer it by self-evaluation and retrieved the completed answers at their classroom. Moreover, After Vocational Preference Inventory L form was introduced, the students were asked to complete it through www.work.go.kr and printed the results of on-line test and also submitted them. Collected response data were recorded in a Microsoft Excel 2013 (Microsoft, Redmond, WA, USA) file.
4. Statistical Analyses
All the statistical analyses were performed by R program (ver. 3.3.0; R Foundation for Statistical Computing, Vienna, Austria). The Pearson’s chi-square test was used to evaluate the relationship of self-reporting prevalence rate of TMD symptoms and contributing factors for TMD to Holland codes. One way ANOVA was performed to compare mean scales of the number of positive answers of TMD symptoms and contributing factors for TMD according to the range of the score on emotional instability which is a factor of per- sonality test. The significance level was set to 5% (p<0.05).
RESULTS
Two-hundred and eighty-five subjects (68.84%) in this study showed at least one of TMD symptoms and three- hundred and forty-six subjects (83.57%) had at least one of contributing factors for TMD. Subjects were assigned to a two-letter Holland code based on the top two categories
Table 1. Demographics of the subjects
Sex Subject Age (y)
Men 57 (13.77) 21.84±5.26
Women 357 (86.23) 19.34±2.34
Total 414 (100.00) 19.68±3.04
Values are presented as number (%) or mean±standard deviation.
for which they had the highest and the second highest scale score. This procedure resulted in the following distribution of subjects corresponding to each two-letter Holland code:
SA (n=87, 21.01%), SI (n=6, 1.45%), SR (n=12, 2.90%), etc.
The percentage of subjects who responded that they had at least one contributing factor for TMD was significantly different among 27 two-letter Holland codes (p<0.05). The two-letter Holland codes of which the first-letter was S (SA, SI, SR, SC, SE) or C (CE, CS, CA, CI) had tendency of having the relatively higher prevalence of symptoms and contrib- uting factors for TMD (Table 2).
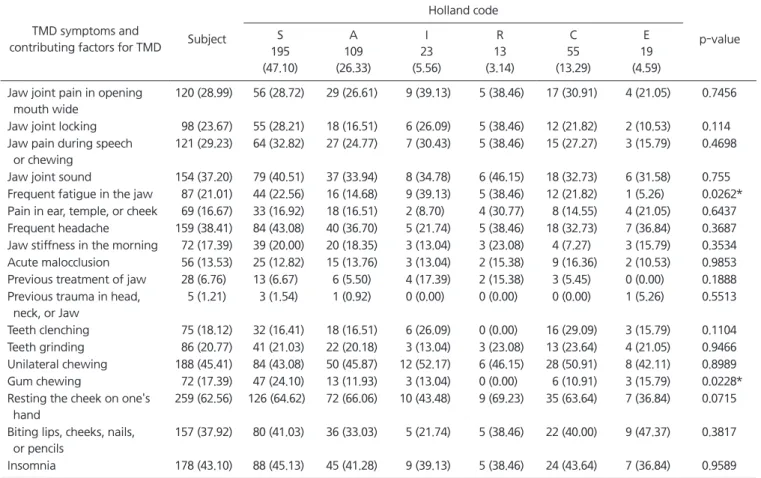
In the present study 87 of subjects (21.01%) had fre- quent fatigue in the jaw and 72 subjects (17.39%) had a habit of gum chewing. Concerning a one-letter Holland code for which subjects had the highest scale score, S was
demonstrated by 195 of subjects (47.10%), A by 109 sub- jects (26.33%), I by 23 subjects (5.56%), R by 13 subjects (3.14%), C by 55 subjects (13.29%), and E by 19 subjects (4.59%). Among 6 one-letter Holland codes, the prevalence of a symptom of frequent fatigue in the jaw and a habit of gum chewing showed the significant difference (p<0.05). E code seemed to have lower prevalence of a symptom of fre- quent fatigue in the jaw than other codes. S code appeared to use chewing gum more frequently than other codes (Table 3).
Subjects were divided into three groups based on the scores on the items of emotional instability which is a fac- tor of personality test, among whom 14 subjects (3.38%) were assigned to the group with scores lower than 40, 270 subjects (65.22%) with scores from 40 to 59, and 130 sub- jects (31.40%) with scores 60 or more. The percentage of
Table 2. Prevalence of TMD symptoms and contributing factors for TMD according to 27 two-letter Holland codes (n=414) Holland
code Subject TMD symptoms
285 (68.84)
Contributing factors for TMD 346 (83.57)
SA 87 (21.01) 66/87 (75.86) 79/87 (90.80)
SI 6 (1.45) 5/6 (83.33) 5/6 (83.33)
SR 12 (2.90) 10/12 (83.33) 10/12 (83.33)
SC 56 (13.53) 38/56 (67.86) 46/56 (82.14)
SE 34 (8.21) 25/34 (73.53) 28/34 (82.35)
AI 3 (0.72) 2/3 (66.67) 3/3 (100.00)
AR 5 (1.21) 4/5 (80.00) 5/5 (100.00)
AC 18 (4.35) 13/18 (72.22) 14/18 (77.78)
AE 7 (1.69) 3/7 (42.86) 4/7 (57.14)
AS 76 (18.36) 49/76 (64.47) 63/76 (82.89)
IR 6 (1.45) 1/6 (16.67) 2/6 (33.33)
IC 2 (0.48) 2/2 (100.00) 2/2 (100.00)
IE 2 (0.48) 1/2 (50.00) 1/2 (50.00)
IS 9 (2.17) 7/9 (77.78) 8/9 (88.90)
IA 4 (0.97) 3/4 (75.00) 4/4 (100.00)
RE 2 (0.48) 2/2 (100.00) 1/2 (50.00)
RS 5 (1.21) 5/5 (100.00) 5/5 (100.00)
RA 3 (0.72) 1/3 (33.33) 3/3 (100.00)
RI 3 (0.72) 1/3 (33.33) 2/3 (66.67)
CE 7 (1.69) 6/7 (85.71) 6/7 (85.71)
CS 30 (7.25) 17/30 (56.67) 27/30 (90.00)
CA 15 (3.62) 11/15 (73.33) 13/15 (86.67)
CI 3 (0.72) 2/3 (66.67) 3/3 (100.00)
ES 8 (1.93) 3/8 (37.50) 4/8 (50.00)
EA 5 (1.21) 4/5 (80.00) 3/5 (60.00)
ER 1 (0.24) 1/1 (100.00) 0/1 (0.00)
EC 5 (1.21) 3/5 (60.00) 5/5 (100.00)
p-value 0.2247 0.0184*
TMD, temporomandibular disorder; S, social; A, artistic; I, investigative; R, realistic; C, conventional; E, enterprising.
Values are presented as number (%).
p-values were completed by chi-square test.
*p<0.05.
subjects who responded that they had at least one TMD symptom was significantly higher in the group with high score (≥60) than in the group with low score (≤39) (p<0.05).
The significantly higher percentage of subjects in the group with high score (≥60) than with low score (≤39) reported at least one contributing factor for TMD (p<0.001).
The mean scale of the number of symptoms to which sub- jects answered positively among 10 items (from item num- ber 1 to item number 10) indicating TMD symptoms on the questionnaire (Appendix 1) was 2.33±2.51. The mean scale of the number of factors to which subjects responded posi- tively among 8 items (from item number 11 to item number 18) related to contributing factors for TMD was 2.46±1.64.
Mean scales of the number of positive answers of TMD symptoms were significantly higher in the group with high score (≥60) than in the group with low score (≤39) (p<0.01).
Subjects with high score (≥60) exhibited significantly higher
mean scales of the number of positive answers of contrib- uting factors for TMD than subjects with low score (≤39) (p<0.001) (Table 4).
DISCUSSION
In the current study 68.84% of subjects showed at least one TMD symptom and 83.57% had at least one contribut- ing factor for TMD. This is higher than the respective 41%
and 74% reported in a study of young people aged 15-18 in Sweden.
20)Among two-letter Holland codes in the pres- ent study, most was SA (21.01%), followed by AS (18.36%), SC (13.53%), in order, while among one-letter Holland codes, most was S (47.10%), followed by A (26.33%), C (13.29%), I (5.56%), E (4.59%), R (3.14%), in order. Among two-letter Holland codes in a study of university students in Chungcheongnam-do most was SE (13.7%), followed by
Table 3. Prevalence of each TMD symptom and each contributing factor for TMD according to 6 one-letter Holland codes (n=414)
TMD symptoms and
contributing factors for TMD Subject
Holland code
p-value S
195 (47.10)
A 109 (26.33)
I 23 (5.56)
R 13 (3.14)
C 55 (13.29)
E 19 (4.59) Jaw joint pain in opening
mouth wide
120 (28.99) 56 (28.72) 29 (26.61) 9 (39.13) 5 (38.46) 17 (30.91) 4 (21.05) 0.7456 Jaw joint locking 98 (23.67) 55 (28.21) 18 (16.51) 6 (26.09) 5 (38.46) 12 (21.82) 2 (10.53) 0.114 Jaw pain during speech
or chewing
121 (29.23) 64 (32.82) 27 (24.77) 7 (30.43) 5 (38.46) 15 (27.27) 3 (15.79) 0.4698 Jaw joint sound 154 (37.20) 79 (40.51) 37 (33.94) 8 (34.78) 6 (46.15) 18 (32.73) 6 (31.58) 0.755 Frequent fatigue in the jaw 87 (21.01) 44 (22.56) 16 (14.68) 9 (39.13) 5 (38.46) 12 (21.82) 1 (5.26) 0.0262*
Pain in ear, temple, or cheek 69 (16.67) 33 (16.92) 18 (16.51) 2 (8.70) 4 (30.77) 8 (14.55) 4 (21.05) 0.6437 Frequent headache 159 (38.41) 84 (43.08) 40 (36.70) 5 (21.74) 5 (38.46) 18 (32.73) 7 (36.84) 0.3687 Jaw stiffness in the morning 72 (17.39) 39 (20.00) 20 (18.35) 3 (13.04) 3 (23.08) 4 (7.27) 3 (15.79) 0.3534 Acute malocclusion 56 (13.53) 25 (12.82) 15 (13.76) 3 (13.04) 2 (15.38) 9 (16.36) 2 (10.53) 0.9853 Previous treatment of jaw 28 (6.76) 13 (6.67) 6 (5.50) 4 (17.39) 2 (15.38) 3 (5.45) 0 (0.00) 0.1888 Previous trauma in head,
neck, or Jaw
5 (1.21) 3 (1.54) 1 (0.92) 0 (0.00) 0 (0.00) 0 (0.00) 1 (5.26) 0.5513 Teeth clenching 75 (18.12) 32 (16.41) 18 (16.51) 6 (26.09) 0 (0.00) 16 (29.09) 3 (15.79) 0.1104 Teeth grinding 86 (20.77) 41 (21.03) 22 (20.18) 3 (13.04) 3 (23.08) 13 (23.64) 4 (21.05) 0.9466 Unilateral chewing 188 (45.41) 84 (43.08) 50 (45.87) 12 (52.17) 6 (46.15) 28 (50.91) 8 (42.11) 0.8989 Gum chewing 72 (17.39) 47 (24.10) 13 (11.93) 3 (13.04) 0 (0.00) 6 (10.91) 3 (15.79) 0.0228*
Resting the cheek on one's hand
259 (62.56) 126 (64.62) 72 (66.06) 10 (43.48) 9 (69.23) 35 (63.64) 7 (36.84) 0.0715 Biting lips, cheeks, nails,
or pencils
157 (37.92) 80 (41.03) 36 (33.03) 5 (21.74) 5 (38.46) 22 (40.00) 9 (47.37) 0.3817 Insomnia 178 (43.10) 88 (45.13) 45 (41.28) 9 (39.13) 5 (38.46) 24 (43.64) 7 (36.84) 0.9589 TMD, temporomandibular disorder; S, social; A, artistic; I, investigative; R, realistic; C, conventional; E, enterprising.
Values are presented as number (%).
p-values were completed by chi-square test.
*p<0.05.
SA (11.6%), AS (10.8%), in order, though among one-letter Holland codes, most was S (34.3%), followed by E (23.8%), A (23.5%), C (8.7%), R (6.0%), I (3.7%), in order.
21)Occupational preference is an expression of an indi- vidual’s motivation, personality, knowledge and ability.
Occupational behaviours are influenced by the interac- tion between environment and personality.
22)According to Holland’s theory, both people and environments are catego- rized into six interest types which correspond to six Holland interest codes: R, I, A, S, E, and C. S code represents traits associated with sociability, femininity, passivity, problem solving by means of feelings rather than thinking and tends to be inclined toward counseling, mentoring, or teaching of others.
23,24)It was suggested that verbal communication work including consultations and lectures might affect TMD symptoms.
25)These findings explain the current result that the two-letter Holland codes of which the first-letter was S (SA, SI, SR, SC, SE) had tendency of having the relatively higher prevalence of symptoms and contributing factors for TMD and that gum chewing habit seemed to occur more frequently in S code than other codes.
C code tends to be productive and effective in well-struc- tured tasks and prefers organizational, clerical or computa- tional activities.
23,24)It was found that TMD was more preva- lent among office workers than in the general population.
26)These findings support the present result that the two-letter Holland codes whose the first-letter was C (CE, CS, CA, CI) appeared to have the relatively higher prevalence of symp- toms and contributing factors for TMD. E code tends to be
extroverted and optimistic and inclined to lead others.
24)It was reported that contributing factors for TMD including teeth clenching and stressful state occurred less frequently in extroverts than introverts.
27)Clenching activity may be associated with tenderness or fatigue in the jaw muscles.
28)These findings are supportive of the result that a symptom of frequent fatigue in the jaw tended to occur less frequent- ly in E code than in other codes.
Personality test of Vocational Preference Inventory L form is based on the big-five personality factors which ac- count for the basic structure behind all personality traits.
Emotional instability of the big-five personality factors is also called neuroticism and refers to the tendency to experi- ence negative emotions. It is made up of six facets: anxiety, anger, depression, self-consciousness, impulsiveness, and vulnerability to stress. Those who score high on emotional instability are characterized as tense, anxious, and vulner- able to stress, whereas people who score low tend to be even-tempered and emotionally resilient.
11,29)In the present result high scorers on emotional instability showed the significantly higher prevalence of TMD symp- toms (p<0.05) and contributing factors for TMD (p<0.001) than low scorers. Furthermore, high scorers on emotional instability had significantly higher mean scales of the num- ber of positive answers of TMD symptoms (p<0.01) and of contributing factors for TMD (p<0.001) than low scorers (Table 4). In conclusion, symptoms and contributing factors for TMD were related to emotional instability. These find- ings are consistent with the previous studies reporting the
Table 4. Prevalence and mean scales of positive answers of TMD symptoms and contributing factors for TMD according to the range of the score on emotional instability (n=414)
TMD symptoms and contributing factors for TMD Subject
Emotional instability
p-value Low score
14 (3.38)
Moderate score 270 (65.22)
High score 130 (31.40)
Subjects with TMD symptoms 285 (68.84) 6 (42.86) 180 (66.67) 99 (76.15) 0.0162
a,*
Subjects with contributing factors for TMD 346 (83.57) 6 (42.86) 229 (84.81) 111 (85.38) 0.0002
a,***
Mean scales of positive answers of TMD symptoms 2.33±2.51 1.00±1.62 2.14±2.37 2.86±2.76 0.0033
b,**
Mean scales of positive answers of contributing factors for TMD
2.46±1.64 1.00±1.41 2.38±1.59 2.80±1.67 0.0001
b,***
TMD, temporomandibular disorder.
Values are presented as number (%) or mean±standard deviation.
Low score, ≤39; Moderate score, 40-59; High score, ≥60.
a