Background and Purpose The recently developed total cerebral small-vessel disease (CSVD) score might appropriately reflect the total burden or severity of CSVD. We investi- gated whether the total CSVD score is associated with long-term outcomes during follow-up in patients with acute ischemic stroke.
Methods In total, 1,096 consecutive patients with acute ischemic stroke who underwent brain magnetic resonance imaging were enrolled. We calculated the total CSVD score for each patient after determining the burden of cerebral microbleeds (CMBs), high-grade white-matter hyperintensities (HWHs), high-grade perivascular spaces (HPVSs), and as- ymptomatic lacunar infarctions (ALIs). We recorded the date and cause of death for all of the patients using data from the Korean National Statistical Office. We compared the long-term mortality rate with the total CSVD score using Cox proportional-hazards models.
Results CMBs were found in 26.8% of the subjects (294/1,096), HWHs in 16.4%
(180/1,096), HPVSs in 19.3% (211/1,096), and ALIs in 38.0% (416/1,096). After adjusting for age, sex, and variables that were significant at p<0.1 in the univariate analysis, the total CSVD score was independently associated with long-term death from all causes [hazard ratio (HR)=1.18 per point, 95% confidence interval (CI)=1.07–1.30], ischemic stroke (HR=1.20 per point, 95% CI=1.01–1.42), and hemorrhagic stroke (HR=2.05 per point, 95% CI=1.30–
3.22), but not with fatal cardiovascular events (HR=1.17 per point, 95% CI=0.82–1.67).
Conclusions The total CSVD score is a potential imaging biomarker for predicting mortal- ity during follow-up in patients with acute ischemic stroke.
Key Words cerebral small-vessel diseases, cerebral microbleeds, white-matter hyperintensities, perivascular spaces, asymptomatic lacunar infarctions.
Total Cerebral Small-Vessel Disease Score is Associated with Mortality during Follow-Up after Acute Ischemic Stroke
INTRODUCTION
Cerebral small-vessel diseases (CSVDs) are defined as those involving a small perforating arteriole, which presents as cerebral microbleeds (CMBs), high-grade white-matter hyper- intensities (HWHs), perivascular spaces (PVSs), and asymptomatic lacunar infarctions (ALIs) in brain magnetic resonance imaging (MRI).1 Although each CSVD can have a dif- ferent impact on the clinical presentation, these individual types of CSVD have common risk factors or share similar mechanisms.2,3 Furthermore, they are also considered to be closely related to the risks of cognitive impairment, recurrent stroke, and growth of cerebral infarction at an early stage.1,4,5 Therefore, for predicting the prognosis after stroke, it may be reasonable to consider the various CSVDs as a single entity rather than separately.
A new scoring system called the total CSVD score has been proposed for capturing the overall effect of CSVD on the brain, rather than estimating only one or two individual CS- VDs separately.6 This score has been linked with risk factors for CSVD and with cognitive Tae-Jin Songa,b
Jinkwon Kimc Dongbeom Songa Joonsang Yooa Hye Sun Leed Yong-Jae Kimb Hyo Suk Nama Ji Hoe Heoa Young Dae Kima
a Department of Neurology,
Yonsei University College of Medicine, Seoul, Korea
b Department of Neurology, Ewha Womans University School of Medicine, Seoul, Korea
c Department of Neurology, CHA Bundang Medical Center, CHA University, Seongnam, Korea
d Department of Biostatistics, Yonsei University College of Medicine, Seoul, Korea
pISSN 1738-6586 / eISSN 2005-5013 / J Clin Neurol 2017;13(2):187-195 / https://doi.org/10.3988/jcn.2017.13.2.187
Received December 21, 2016 Revised January 15, 2017 Accepted January 18, 2017 Correspondence Young Dae Kim, MD, PhD Department of Neurology,
Yonsei University College of Medicine, 50 Yonsei-ro, Seodaemun-gu, Seoul 03722, Korea
Tel +82-2-2228-1619 Fax +82-2-393-0705 E-mail [email protected]
cc This is an Open Access article distributed under the terms of the Creative Commons Attribution Non-Com- mercial License (http://creativecommons.org/licenses/by-nc/4.0) which permits unrestricted non-commercial use, distribution, and reproduction in any medium, provided the original work is properly cited.
JCN
Open Access ORIGINAL ARTICLETotal Small-Vessel Disease Score and Mortality
JCN
dysfunction in lacunar stroke patients,6,7 and it might be help- ful for the rapid quantification or stratification of CSVD.6 More- over, because the scoring system represents the overall CSVD burden, which may influence the short- and long-term out- comes, it is possible that the total CSVD score is indicative of the mortality likelihood during follow-up after an acute stroke. However, no data supporting this have been reported previously.
We investigated whether the total CSVD score is associat- ed with mortality during follow-up in patients with ischemic stroke.
METHODS
Study population
This study performed a retrospective analysis of prospective- ly collected data. Between January 2009 and December 2010, 1,215 consecutive patients with acute cerebral infarction or transient ischemic attack were admitted to our stroke cen- ter within 7 days after symptom onset.8 All of the patients were thoroughly evaluated during their hospitalization, and their demographic data, medical history, clinical manifesta- tions, and vascular risk factors were recorded. According to the standard protocol of our stroke center, all patients under- went brain computed tomography (CT) and/or MRI, vascu- lar imaging studies (digital subtraction angiography, mag- netic resonance angiography, or CT angiography), chest radiography, 12-lead electrocardiography, and routine blood tests. Echocardiography was also performed as a standard evaluation. Most of the patients were admitted to the stroke unit and were kept under continuous electrocardiographic monitoring during their stay (average length=4.9 days).8,9
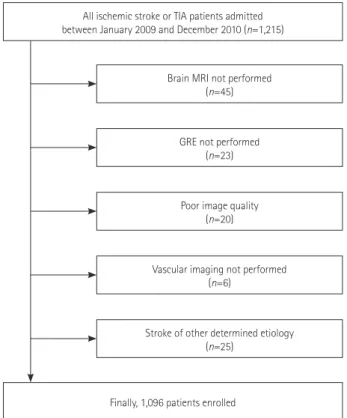
We excluded 45 of the 1,215 patients who did not under- go brain MRI due to the patient’s refusal, claustrophobia, or presence of metallic material in the body, 23 with no avail- able gradient recalled echo (GRE) images, 20 with poor im- age quality, and 6 with no vessel imaging data. Patients with stroke due to other determined etiology (n=25) were also excluded. These exclusions resulted in 1,096 patients finally being included in this study (Fig. 1).
The Institutional Review Board of Severance Hospital, Yon- sei University Health System approved this study and waived the need for informed consent from the patients due to the its retrospective and observational design.
Brain MRI protocol and definition of CSVD
All MRI examinations were performed using a 3.0T MRI system (Achieva 3.0T, Philips Medical Systems, Best, the Netherlands; or MAGNETOM Trio 3.0T, Siemens, Amberg, Germany). MRI images were obtained parallel to the orbi-
tomeatal line using the following parameters: time repeti- tion (TR)/time echo (TE)=2,600–6,500/42–70 ms, interslice gap=2 mm, field of view (FOV)=230×230 mm, slice thick- ness=5 mm, six different directions of diffusion gradient (x, y, z, xy, yz, and zx), and two b values (0 and 1000) for diffu- sion-weighted imaging (DWI); TR/TE=9,000/120 ms, FOV=230×230 mm, pixel spacing=0.449 mm/0.449 mm, and slice thickness=5 mm for fluid-attenuated inversion re- covery (FLAIR) imaging; TR/TE=9,000/100 ms, FOV=
230×230 mm, pixel spacing=0.240 mm/0.240 mm, and slice thickness=5 mm for T2-weighted images; and TR/TE=600/
16 ms, FOV=250×250 mm, pixel spacing=0.449 mm/0.449 mm, and slice thickness=5 mm for GRE imaging.10,11
CMBs manifested as punctate hypointense lesions smaller than 10 mm on GRE images.10 The extent of white-matter hyperintensities was determined on the FLAIR images for the periventricular white matter or deep white matter ac- cording to the Fazekas scoring system.12 A Fazekas score of 3 in periventricular white matter or ≥2 in deep white matter was considered to indicate HWHs. PVSs were defined as punctate and/or linear hyperintense lesions smaller than 3 mm on T2-weighted images in the basal ganglia.13 PVSs of grade 2–4 in the basal ganglia were defined as high-grade perivascular spaces (HPVSs), based on a previous report.3 ALIs were defined as a round or ovoid, subcortical, fluid- filled cavity (signal similar to cerebrospinal fluid) of hyper-
All ischemic stroke or TIA patients admitted between January 2009 and December 2010 (n=1,215)
Finally, 1,096 patients enrolled Brain MRI not performed
(n=45)
GRE not performed (n=23)
Poor image quality (n=20)
Vascular imaging not performed (n=6)
Stroke of other determined etiology (n=25)
Fig. 1. Selection of patients. GRE: gradient recalled echo, TIA: tran- sient ischemic attack.
Song TJ et al.
JCN
intense lesions ≥3 mm and <15 mm in size on T2-weighted images with low signal intensity on T1-weighted images, with no relevant history of symptoms or signs. The existence of CMBs, HWHs, HPVSs, and ALIs was determined outside the acute infarct area (based on DWI), and these lesions were independently investigated by two neurologists (T.J.S. and J.K.) who were blinded to the patient’s clinical information.
The total CSVD score was calculated for each patient on an ordinal scale from 0 to 4 by counting the presence of each of the four MRI features of CSVD, with a score of 1 point ap- plied for the presence of each of CMB, HWH, HPVS, and ALI.6 The interobserver agreement values for the presence of CMBs, HWHs, HPVSs, and ALIs were 0.912, 0.956, 0.938, and 0.888, respectively (all p<0.05). Any disagreement about the presence of CSVD was resolved by consensus.
Clinical and laboratory variables
We collected the patient’s data for traditional vascular risk factors14 and the previous stroke. Hypertension was defined as being present when a patient had been taking blood-pres- sure-lowering agents or had a resting systolic blood pressure of ≥140 mm Hg or a diastolic blood pressure of ≥90 mm Hg in repeated measurements. Diabetes mellitus was diag- nosed for a fasting blood glucose level of ≥7.0 mmol/L or treatment with oral glucose-lowering medications or insulin.
Hyperlipidemia was diagnosed for a total cholesterol level of ≥6.2 mmol/L, a low-density lipoprotein cholesterol level of ≥4.1 mmol/L, or if the patient had taken lipid-lowering medications after a diagnosis of hyperlipidemia at admis- sion. Patients were defined as smokers if they were current smokers or had stopped smoking within 1 year before the index stroke. Previous stroke was defined as having a previ- ous stroke-like symptom combined with the presence of an ischemic lesion confirmed by brain imaging. A history of a transient ischemic attack was not included as a previous stroke. We further collected data relating to the patient’s pri- or medication, coronary artery disease (a history of myocar- dial infarction, unstable angina, or angiographically con- firmed occlusive disease of the coronary artery), metabolic syndrome, and the thrombolytic or endovascular reperfusion therapy used for the index stroke.
We also measured the white blood cell count, hemoglobin, hematocrit, and estimated glomerular filtration rate (eGFR) at admission. eGFR was calculated using the Modification of Diet in Renal Disease formula as eGFR=186.3×(serum creatinine-1.154)×(age-0.203)×(0.742 for women). All laboratory data were collected at admission.
Stroke severity was determined at admission using the National Institutes of Health Stroke Scale (NIHSS).15 The stroke classification was determined based on the Trial of Org
10172 in Acute Stroke Treatment classification system.16 Outcome measures
We recorded the date and cause of death for each patient us- ing data from the Korean National Statistical Office, which are based on death certificates and are known to be reliable.17 The causes of death were classified according to the Inter- national Classification of Disease (10th revision) and cate- gorized into fatal cardiovascular events (I21–I25, R96, I49, and I50), fatal ischemic stroke (I63 or I69.3), or fatal hemor- rhagic stroke (I60–I62). The censoring date was set as De- cember 31, 2013.
Statistical analyses
Statistical analyses were performed using the Windows SPSS software package (version 20.0, IBM Corporation, Armonk, NY, USA). The independent-samples t-test, Mann-Whitney U test, or Kruskal-Wallis test was used to compare continu- ous variables, and Fisher’s exact test or the chi-square test was used to compare categorical variables, as appropriate.
The association between the total CSVD score and mortali- ty rate was analyzed using the Kaplan-Meier product-limit method with a log-rank test and multivariate Cox propor- tional-hazards regression. A probability value of p>0.05 was considered statistically significant.
RESULTS
Comparisons of baseline characteristics according to CSVD burden
The baseline characteristics of the study population (n=
1,096) are presented in Table 1. The patients were aged 66.3±
11.8 years (mean±SD) and 61.5% (n=675) of them were male.
In terms of stroke classification, cardioembolism (26.0%) was most common, followed by negative evaluation (24.7%), two or more causes identified (20.0%), large-artery athero- sclerosis (18.8%), and lacune (10.5%).
CMBs were found in 26.8% of the subjects (294/1,096), HWHs in 16.4% (180/1,096), HPVSs in 19.3% (211/1,096), and ALIs in 38.0% (416/1,096). Age, hypertension, previous stroke, and prior antiplatelet use were associated with the presence of any type of CSVD (Table 2). Patients with ALIs showed a lower initial stroke severity and more frequent la- cunar stroke compared to those without ALIs (Table 2).
Five hundred and fifty patients (50.2%) had a total CSVD score of 0. ALIs were most commonly observed (67.5%) in the 252 patients with a score of 1. The most common combi- nations were CMBs+ALIs, in the 107 patients (32.7%) with a score of 2, and CMB+HPVSs+ALIs, in the 113 patients (51.3%) with a score of 3. Seventy-four patients (6.8%) had
Total Small-Vessel Disease Score and Mortality
JCN
all four types of CSVD. A higher total CSVD score was asso- ciated with advanced age, hypertension, previous stroke, not smoking, coronary artery disease, prior antiplatelet use, and decreased eGFR, while initial stroke severity and stroke mech- anism did not vary with the total CSVD score (Table 1).
Association between CSVD and mortality during follow-up
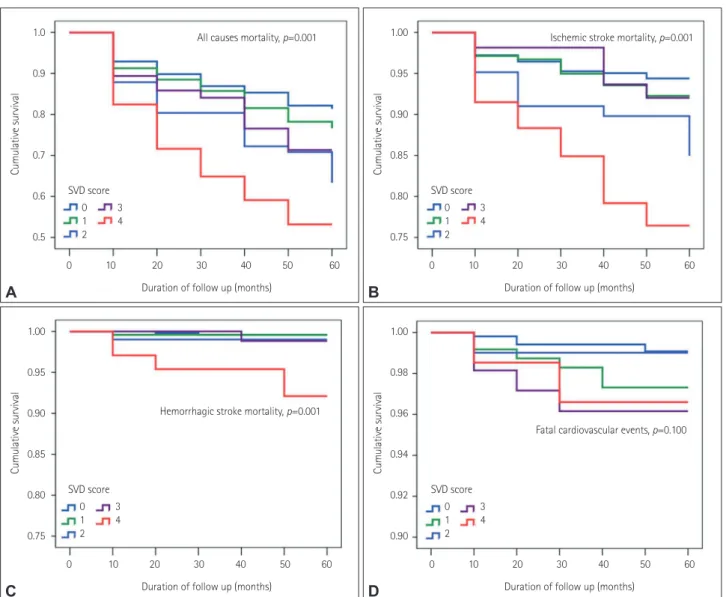
Among the total of 1,096 patients, 240 (21.9%) died at a me- dian follow-up of 3.8 years (interquartile range=3.2–4.3 years); 77 (32.1%) patients died of fatal ischemic stroke, 17 (7.1%) of fatal cardiovascular events, and 9 (3.8%) of fatal hemorrhagic stroke. Among the other causes of death, malig- nancy was the most common, followed by renal failure and diabetes mellitus (Supplementary Table 1 in the online-only Data Supplement). The Kaplan-Meier curve showed that all prespecified outcomes (all-cause mortality, fatal ischemic stroke, and fatal hemorrhagic stroke) other than fatal cardio-
vascular events were associated with the CSVD score (Fig. 2).
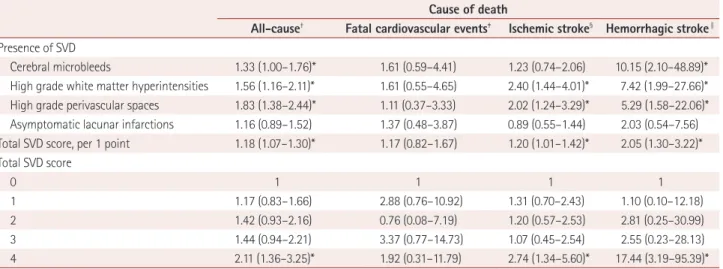
In multivariate Cox regression analyses adjusting for age, sex, and variables that were significant at p<0.1 in the uni- variate analysis, the presence of CMBs, HWHs, or HPVSs was independently associated with all-cause mortality (Table 3). Fatal ischemic stroke was related to HWHs or HPVSs, while CMBs were associated with fatal hemorrhagic stroke during the long-term follow-up (Table 3). In addition, the total CSVD score (especially one of 4) was an independent predictor for all-cause mortality [hazard ratio (HR)=2.11, 95% confidence interval (CI)=1.36–3.25], fatal ischemic stroke (HR=2.74, 95% CI=1.34–5.60), and fatal hemorrhagic stroke (HR=17.44, 95% CI=3.19–95.3), but not for fatal car- diovascular events (HR=1.92, 95% CI=0.31–11.79) (Table 3).
The long-term prognosis according to the initial stroke severity was investigated by dividing the study population into three groups: mild (NIHSS score=0–4), moderate (NI- HSS score=5–15), and severe (NIHSS score>15). There was Table 1. Baseline characteristics by total SVD scores
SVD score Total (n=1,096) 0 (n=550) 1 (n=252) 2 (n=107) 3 (n=113) 4 (n=74) p value Demographic data
Sex, male 675 (61.5) 341 (62.0) 164 (65.1) 57 (53.3) 68 (60.2) 44 (59.5) 0.320
Age, years 66.3±11.8 63.3±12.2 67.0±10.5 71.4±10.8 69.6±10.6 73.1±10.0 <0.001
Risk factors
Hypertension 828 (75.5) 363 (66.0) 198 (78.6) 95 (88.8) 104 (92.0) 68 (91.9) <0.001
Diabetes mellitus 341 (31.1) 149 (27.1) 90 (35.7) 36 (33.6) 41 (36.3) 25 (33.8) 0.071
Hyperlipidemia 116 (10.6) 63 (11.5) 25 (9.9) 4 (3.7) 18 (15.9) 6 (8.1) 0.045
Previous stroke 200 (18.2) 72 (13.1) 45 (17.9) 24 (22.4) 35 (31.0) 24 (32.4) <0.001
Smoking 256 (23.4) 145 (26.4) 58 (23.0) 17 (15.9) 28 (24.8) 8 (10.8) 0.012
Coronary artery disease 209 (19.1) 86 (15.6) 59 (23.4) 20 (18.7) 25 (22.1) 19 (25.7) 0.039
Metabolic syndrome 512 (46.7) 243 (44.2) 124 (49.2) 53 (49.5) 55 (48.7) 37 (50.0) 0.578
Prior medication
Anti-platelet 401 (36.6) 169 (30.7) 99 (39.3) 48 (44.9) 55 (48.7) 30 (40.5) 0.001
Anti-coagulant 62 (5.7) 34 (6.2) 15 (6.0) 2 (1.9) 5 (4.4) 6 (8.1) 0.360
Lipid-lowering agents 213 (19.4) 101 (18.4) 47 (18.7) 23 (21.5) 24 (21.2) 18 (24.3) 0.707
Laboratory findings
Estimate GFR, mL/min/1.73 m2 80.5±27.2 85.8±26.1 78.7±24.4 72.1±29.4 73.2±29.6 70.1±28.1 <0.001
WBC count /103 8.4±3.1 8.5±3.3 8.4±3.0 8.3±3.0 8.1±3.1 7.8±2.0 0.523
Hemoglobin, mg/dL 13.7±1.8 13.8±1.8 13.7±1.8 13.6±1.5 13.4±2.2 13.5±2.0 0.389
Stroke classification 0.618
Large artery atherosclerosis 206 (18.8) 107 (19.5) 42 (16.7) 18 (16.8) 20 (17.7) 19 (25.7)
Lacune 115 (10.5) 52 (9.5) 31 (12.3) 10 (9.3) 11 (9.7) 11 (14.9)
Cardioembolism 285 (26.0) 157 (28.5) 56 (22.2) 27 (25.2) 27 (23.9) 18 (24.3)
Multiple causes 219 (20.0) 106 (19.3) 55 (21.8) 20 (18.7) 26 (23.0) 12 (16.2)
Negative evaluation 271 (24.7) 128 (23.3) 68 (27.0) 32 (29.9) 29 (25.7) 14 (18.9)
Thrombolytic or endovascular
reperfusion therapy 113 (10.3) 69 (12.5) 25 (9.9) 7 (6.5) 7 (6.2) 5 (6.8) 0.102
NIHSS score, median (IQR) 3 (1–7) 3 (1-8) 3 (1-7) 3 (1-9) 3 (2-5) 3 (2-6) 0.722
Values are number (%), mean±SD or median (interquartile range).
GFR: glomerular filtration rate, IQR: interquartile range, NIHSS: National Institutes of Health Stroke Scale, SVD: small-vessel disease, WBC: white blood cell.
Song TJ et al.
JCN
Table 2. Comparison of demographic and clinical data according to presence of small vessel pathologies Cerebral
microbleeds (CMBs)
High grade white matter hyperintensities
(HWHs)
High grade perivascular spaces (HPVSs)
Asymptomatic lacunar infarctions
(ALIs) CMBs (-)
(n=802)
CMBs (+) (n=294)
HWHs (-) (n=916)
HWHs (+) (n=180)
HPVSs (-) (n=885)
HPVSs (+) (n=211)
ALIs (-) (n=680)
ALIs (+) (n=416) Demographic data
Sex, male 495 (61.7) 179 (60.9) 584 (63.8) 90 (50.0)* 547 (61.8) 127 (60.2) 412 (60.6) 262 (63.0) Age, years 65.0±11.9 69.8±10.9* 64.8±11.8 73.9±8.9* 65.1±11.8 71.0±10.9* 64.8±12.3 68.8±10.6*
Risk factors
Hypertension 568 (70.8) 260 (88.4)* 663 (72.4) 165 (91.7)* 640 (72.3) 188 (89.1)* 469 (69.0) 359 (86.3)*
Diabetes mellitus 239 (29.8) 102 (34.7) 276 (30.1) 65 (36.1) 266 (30.1) 75 (35.5) 198 (29.1) 143 (34.4) Hyperlipidemia 85 (10.6) 31 (10.5) 99 (10.8) 17 (9.4) 93 (10.5) 23 (10.9) 76 (11.2) 40 (9.6) Previous stroke 124 (15.5) 76 (25.9)* 147 (16.0) 53 (29.4)* 137 (15.5) 63 (29.9)* 98 (14.4) 102 (24.5)*
Smoking 198 (24.7) 58 (19.7) 234 (25.5) 22 (12.2)* 216 (24.4) 40 (19.0) 168 (24.7) 88 (21.2) Coronary artery disease 137 (17.1) 72 (24.5)* 170 (18.6) 39 (21.7) 161 (18.2) 48 (22.7) 118 (17.4) 91 (21.9) Metabolic syndrome 363 (45.3) 149 (50.7) 422 (46.1) 90 (50.0) 412 (46.6) 100 (47.4) 308 (45.3) 204 (49.0) Prior medication
Antiplatelet 273 (34.0) 128 (43.5)* 317 (34.6) 84 (46.7)* 307 (34.7) 94 (44.5)* 227 (33.4) 174 (41.8)*
Anticoagulant 43 (5.4) 19 (6.5) 54 (5.9) 8 (4.4) 51 (5.8) 11 (5.2) 42 (6.2) 20 (4.8)
Lipid-lowering agents 150 (18.7) 63 (21.4) 175 (19.1) 38 (21.1) 167 (18.9) 46 (21.8) 123 (18.1) 90 (21.6) Laboratory findings
Estimate GFR, mL/min/1.73 m2 83.9±26.8 71.0±26.0* 82.1±26.0 72.3±31.3* 82.3±26.3 72.9±29.6* 83.3±26.8 75.9±27.2*
WBC count/103 8.4±3.2 8.3±3.0 8.4±3.1 8.2±3.1 8.5±3.3 8.1±2.4 8.6±3.3 8.0±2.8*
Hemoglobin, mg/dL 13.7±1.8 13.6±2.0 13.8±1.8 13.2±1.9 13.7±1.8 13.6±2.0 13.7±1.8 13.7±1.8
Stroke classification
Large artery atherosclerosis 138 (17.2) 68 (23.1) 174 (19.0) 32 (17.8) 159 (18.0) 47 (22.3) 139 (20.4) 67 (16.1)*
Lacune 88 (11.0) 27 (9.2) 93 (10.2) 22 (12.2) 92 (10.4) 23 (10.9) 59 (8.7) 56 (13.5)*
Cardioembolism 210 (26.2) 75 (25.5) 235 (25.7) 50 (27.8) 235 (26.6) 50 (23.7) 197 (29.0) 88 (21.2)*
Multiple causes 165 (20.6) 54 (18.4) 185 (20.2) 34 (18.9) 178 (20.1) 41 (19.4) 127 (18.7) 92 (22.1)*
Negative evaluation 201 (25.1) 70 (23.8) 229 (25.0) 42 (23.3) 221 (25.0) 50 (23.7) 158 (23.2) 113 (27.2)*
Thrombolytic or endovascular
reperfusion therapy 83 (10.3) 30 (10.2) 101 (11.0) 12 (6.7) 99 (11.2) 14 (6.6) 89 (13.1) 24 (5.8)*
SVD subtypes
CMBs - - 169 (18.4) 125 (69.4)* 131 (14.8) 163 (77.3)* 100 (14.7) 194 (46.6)*
HWHs 55 (6.9) 125 (42.5)* - - 75 (8.5) 105 (49.8)* 47 (6.9) 133 (32.0)*
HPVSs 48 (6.0) 163 (55.4)* 106 (11.6) 105 (58.3)* - - 41 (6.0) 170 (40.9)*
ALIs 222 (27.7) 194 (66.0)* 283 (30.9) 133 (73.9)* 246 (27.8) 170 (80.6)* - -
NIHSS score, median (IQR) 3 (1–7) 3 (2–6) 3 (1–7) 3 (2–7) 3 (1–7) 4 (2–7) 3 (1–8) 3 (1–5)*
Total SVD score 0.4±0.6 2.6±1.0* 0.6±0.8 3.0±1.0* 0.5±0.7 3.0±0.8* 0.2±0.6 2.1±1.1*
Total SVD score*
0 550 (68.6) 0 (0.0) 550 (60.0) 0 (0.0) 550 (62.1) 0 (0.0) 550 (80.9) 0 (0.0)
1 197 (24.6) 55 (18.7) 232 (25.3) 20 (11.1) 245 (27.7) 7 (3.3) 82 (12.1) 170 (40.9)
2 37 (4.6) 70 (23.8) 76 (8.3) 31 (17.2) 63 (7.1) 44 (20.9) 38 (5.6) 69 (16.6)
3 18 (2.2) 95 (32.3) 58 (6.3) 55 (30.6) 27 (3.1) 86 (40.8) 10 (1.5) 103 (24.8)
4 0 (0.0) 74 (25.2) 0 (0.0) 74 (41.1) 0 (0.0) 74 (35.1) 0 (0.0) 74 (17.8)
Values are number (%), mean±SD or median (IQR).
*p value<0.05.
GFR: glomerular filtration rate, IQR: interquartile range, NIHSS: National Institutes of Health Stroke Scale, SVD: small-vessel disease, WBC: white blood cell.
Total Small-Vessel Disease Score and Mortality
JCN
no evidence of an interaction between the initial stroke se- verity and the total CSVD score. Multivariate analysis showed that the total CSVD score (as a continuous variable) was significantly associated with mortality other than fatal car- diovascular events during the follow-up in patients with mild severe stroke severity but not in those with severe stroke se- verity at admission (Table 4).
DISCUSSION
Previous studies have proposed using the MRI-based total CSVD score for evaluating the total burden of CSVDs,6 but no data on the association between this scoring system and clinical outcomes during follow-up have been reported pre- viously. In this study we found that the total CSVD score was associated with mortality other than fatal cardiovascular
events during the follow-up. In addition, a total CSVD score of 4 was associated with long-term all-cause mortality as well as death from fatal ischemic or hemorrhagic stroke.
About half of the stroke population had CSVDs in this study, with ALIs being most common, followed by CMBs, HPVSs, and HWHs. Previous studies have found that many patients (up to 60%) with evident stroke or cardiovascular diseases had ALIs,18,19 and that ALIs were the most common type of CSVD in stroke patients.20 These results were similar to our own, although the prevalence of specific CSVDs can vary widely depending on the underlying conditions, the im- aging modality, and the population studied.4,19
Previous studies showed that certain CSVDs such as HWHs, CMBs, and ALIs were independent predictors for a poor outcome after index stroke21,22 or the long-term fatal out- come.11,23-25 However, there has been no information on the
1.0 0.9 0.8 0.7 0.6 0.5
1.00 0.95 0.90 0.85 0.80 0.75
Cumulative survival Cumulative survival
0 10 20 30 40 50 60 0 10 20 30 40 50 60
All causes mortality, p=0.001 Ischemic stroke mortality, p=0.001
Duration of follow up (months) Duration of follow up (months)
SVD score SVD score
0 1 2
0 1 2 3
4 3
4
1.00 0.95 0.90 0.85 0.80 0.75
1.00 0.98 0.96 0.94 0.92 0.90
Cumulative survival Cumulative survival
0 10 20 30 40 50 60 0 10 20 30 40 50 60 Hemorrhagic stroke mortality, p=0.001
Fatal cardiovascular events, p=0.100
Duration of follow up (months) Duration of follow up (months)
SVD score SVD score
0 1 2
0 1 2 3
4
3 4
Fig. 2. Kaplan-Meier survival plots for patients with acute ischemic stroke according to total CSVD score. The Kaplan-Meier curve shows that deaths related to all causes (p=0.001) (A), ischemic stroke (p=0.001) (B), and hemorrhagic stroke (p=0.001) (C) were associated with the total CSVD score, whereas fatal cardiovascular events were not (p=0.100) (D). CSVD: cerebral small-vessel disease, SVD: small-vessel disease.
A
C
B
D
Song TJ et al.
JCN
impact of the total burden of CSVDs on clinical outcomes despite various types of CSVDs commonly coexisting and the clinical outcome possibly being determined by their combined effect. Considering the potential impact of the underlying total burden of CSVD on cognitive decline and physical disability,13 patients with a higher total CSVD score might remain undertreated with rehabilitation or medica- tion for secondary stroke prevention. In addition, severe CSVD could be a marker of an impaired neurovascular net- work, which could inhibit plasticity and adversely affect the recovery after stroke.26 A high CSVD burden has also been
associated with other neurodegenerative diseases13 that have a detrimental effect on the outcome after stroke. Along with these previous reports, our results showed that the total burden of CSVD can affect the outcomes after index stroke.
In should be noted that in an acute stroke population such as the present one, the potential impact of the CSVD bur- den on clinical outcome could be attenuated due to the pres- ence of other stronger factors affecting the outcomes, such as the initial stroke severity.10,23 We found that an impact of the total CSVD burden was not present in patients who had severe stroke. This means that the impact of the CSVD bur- Table 3. Multivariable Cox regression analysis for long-term mortality according to presence and burden of SVD
Cause of death
All-cause† Fatal cardiovascular events‡ Ischemic stroke§ Hemorrhagic stroke∥ Presence of SVD
Cerebral microbleeds 1.33 (1.00–1.76)* 1.61 (0.59–4.41) 1.23 (0.74–2.06) 10.15 (2.10–48.89)*
High grade white matter hyperintensities 1.56 (1.16–2.11)* 1.61 (0.55–4.65) 2.40 (1.44–4.01)* 7.42 (1.99–27.66)*
High grade perivascular spaces 1.83 (1.38–2.44)* 1.11 (0.37–3.33) 2.02 (1.24–3.29)* 5.29 (1.58–22.06)*
Asymptomatic lacunar infarctions 1.16 (0.89–1.52) 1.37 (0.48–3.87) 0.89 (0.55–1.44) 2.03 (0.54–7.56) Total SVD score, per 1 point 1.18 (1.07–1.30)* 1.17 (0.82–1.67) 1.20 (1.01–1.42)* 2.05 (1.30–3.22)*
Total SVD score
0 1 1 1 1
1 1.17 (0.83–1.66) 2.88 (0.76–10.92) 1.31 (0.70–2.43) 1.10 (0.10–12.18)
2 1.42 (0.93–2.16) 0.76 (0.08–7.19) 1.20 (0.57–2.53) 2.81 (0.25–30.99)
3 1.44 (0.94–2.21) 3.37 (0.77–14.73) 1.07 (0.45–2.54) 2.55 (0.23–28.13)
4 2.11 (1.36–3.25)* 1.92 (0.31–11.79) 2.74 (1.34–5.60)* 17.44 (3.19–95.39)*
Values are hazard ratio (95% confidence interval).
*p value<0.05, †Adjusted for age, sex, and variables with p value<0.1 in univariate analysis (hyperlipidemia, previous stroke, smoking, coronary artery disease, metabolic syndrome, prior anti-coagulant use, white blood cell count, hemoglobin, stroke classification, thrombolytic or endovascular reper- fusion therapy, and NIHSS score) for all-cause mortality, ‡Adjusted for age, sex, and variables with p value<0.1 in univariate analysis (coronary artery disease, previous antiplatelet medication, estimated glomerular filtration rate, hemoglobin, and NIHSS score) for fatal cardiovascular events, §Adjusted for age, sex, and variables with p value<0.1 in univariate analysis (previous stroke, smoking, metabolic syndrome, prior anti-coagulant use, white blood cell count, hemoglobin, stroke classification, thrombolytic or endovascular reperfusion therapy, and NIHSS score) for ischemic stroke mortality,
∥Adjusted each component of SVD and total SVD score only for hemorrhagic stroke mortality.
NIHSS: National Institutes of Health Stroke Scale, SVD: small-vessel disease.
Table 4. Multivariate analysis of SVD score for outcome according to the stroke severity
Outcomes NIHSS score
0–4 (n=708) 5–15 (n=298) >15 (n=90)
All-cause mortality 1.29 (1.12–1.50)* 1.11 (0.93–1.33) 0.93 (0.68–1.29)
Fatal cardiovascular events 1.13 (0.59–2.15) 1.00 (0.52–1.91) 0.57 (0.10–3.16)
Fatal ischemic stroke 1.69 (1.19–2.40)* 1.03 (0.75–1.40) 0.63 (0.39–1.16)
Fatal hemorrhagic stroke 2.00 (1.19–3.35)* NA 1.36 (0.29–6.37)
Values are hazard ratio (95% confidence interval). All results are represented as adjusted hazard ratio according to total SVD score (per 1 point). There was no evidence of interaction between initial stroke severity and total SVD score. Adjusted for age, sex, and variables with p value<0.1 in univariate analysis (hyperlipidemia, previous stroke, smoking, coronary artery disease, metabolic syndrome, prior anti-coagulant use, white blood cell count, he- moglobin, stroke classification, thrombolytic or endovascular reperfusion therapy, and NIHSS score) for all-cause mortality. Adjusted for age, sex, and variables with p value<0.1 in univariate analysis (coronary artery disease, prior antiplatelet medication, estimated glomerular filtration rate, hemoglo- bin, and NIHSS score) for fatal cardiovascular events. Adjusted for age, sex, and variables with p value<0.1 in univariate analysis (previous stroke, smoking, metabolic syndrome, prior anti-coagulant use, white blood cell count, hemoglobin, stroke classification, thrombolytic or endovascular reper- fusion therapy, and NIHSS score) for ischemic stroke mortality. Adjusted each component of SVD and total SVD score only for hemorrhagic stroke mortality.
*p value<0.05.
NA: not applicable, NIHSS: National Institutes of Health Stroke Scale, SVD: small-vessel disease.
Total Small-Vessel Disease Score and Mortality
JCN
den on outcome can differ with the patient’s characteristics, including age and the severity of the index stroke.
The mortality rate in this study was higher than in previ- ous studies.27-31 Stroke outcomes (including mortality) can vary with the patient’s characteristics, stroke subtype, and acute stroke care. Our study population had a higher age and higher proportion of the cardioembolic or multiple-causes stroke subtype compared to other previous studies,30,31 which may have affected the present results.
This study was subject to some limitations. First, it had a retrospective design, which is a substantial weak point of this type of study. Second, we did not investigate stroke re- currence, and so it was uncertain whether the higher mortal- ity rate in patients with a higher burden of CSVDs was due to increased stroke recurrence. Third, the degree of adher- ence to medication used for stroke prevention, which is an- other factor affecting recurrent ischemic or hemorrhagic stroke, was not investigated during the follow-up. Fourth, we did not exclude patients with previous disability before index stroke. Fifth, we cannot guarantee that each CSVD subtype, particularly ALIs, was truly asymptomatic, although we did determine the presence of previous stroke based on patient recall. A neurologic deficit that is not recognized as being due to a previous stroke might affect the clinical stroke outcome.32 Sixth, the smallness of the sample for hemor- rhagic stroke mortality means that the associated data should be interpreted with caution. Lastly, our study population in- cluded only Asian (Korean) patients. This homogeneity of the study population should be considered when interpret- ing our results because the association between CSVD and clinical outcome could differ with ethnicity.33
In conclusion, this study has shed light on the association of the total CSVD score with mortality during follow-up in acute ischemic stroke patients. The different types of CSVD frequently coexist, and the simple scoring system that com- bines the various types of CSVD in a single scale is easy to use. Our findings suggest that this scoring system could be useful for risk stratification in future clinical research.
Supplementary Materials
The online-only Data Supplement is available with this arti- cle at https://doi.org/10.3988/jcn.2017.13.2.187.
Conflicts of Interest
The authors have no financial conflicts of interest.
Acknowledgements
This work was supported by a grant from the Korea Healthcare Technol- ogy Research and Development Project, Ministry for Health, Welfare, and Family Affairs, Republic of Korea (grant no. HI08C2149) and by the Basic Science Research Program through the National Research Founda- tion of Korea (NRF) funded by the Ministry of Education (grant no.
2015R1D1A1A01057934).
REFERENCES
1. Pantoni L. Cerebral small vessel disease: from pathogenesis and clin- ical characteristics to therapeutic challenges. Lancet Neurol 2010;9:
689-701.
2. Greenberg SM, Vernooij MW, Cordonnier C, Viswanathan A, Al-Sha- hi Salman R, Warach S, et al. Cerebral microbleeds: a guide to detec- tion and interpretation. Lancet Neurol 2009;8:165-174.
3. Doubal FN, MacLullich AM, Ferguson KJ, Dennis MS, Wardlaw JM.
Enlarged perivascular spaces on MRI are a feature of cerebral small vessel disease. Stroke 2010;41:450-454.
4. Kim BJ, Lee SH. Cerebral microbleeds: their associated factors, ra- diologic findings, and clinical implications. J Stroke 2013;15:153-163.
5. Kalaria RN, Erkinjuntti T. Small vessel disease and subcortical vascu- lar dementia. J Clin Neurol 2006;2:1-11.
6. Staals J, Makin SD, Doubal FN, Dennis MS, Wardlaw JM. Stroke sub- type, vascular risk factors, and total MRI brain small-vessel disease burden. Neurology 2014;83:1228-1234.
7. Huijts M, Duits A, van Oostenbrugge RJ, Kroon AA, de Leeuw PW, Staals J. Accumulation of MRI markers of cerebral small vessel dis- ease is associated with decreased cognitive function. A study in first- ever lacunar stroke and hypertensive patients. Front Aging Neurosci 2013;5:72.
8. Lee BI, Nam HS, Heo JH, Kim DI; Yonsei Stroke Team. Yonsei Stroke Registry. Analysis of 1,000 patients with acute cerebral infarctions.
Cerebrovasc Dis 2001;12:145-151.
9. Choi HY, Seo JH, Yang JH, Kim YD, Jung YH, Cho HJ, et al. Beneficial effects of stroke-unit care in stroke patients with atrial fibrillation.
Yonsei Med J 2013;54:301-305.
10. Song TJ, Kim J, Lee HS, Nam CM, Nam HS, Kim EH, et al. Differen- tial impact of unrecognised brain infarction on stroke outcome in non-valvular atrial fibrillation. Thromb Haemost 2014;112:1312-1318.
11. Song TJ, Kim J, Song D, Nam HS, Kim YD, Lee HS, et al. Association of cerebral microbleeds with mortality in stroke patients having atri- al fibrillation. Neurology 2014;83:1308-1315.
12. Song TJ, Kim J, Kim YD, Nam HS, Lee HS, Nam CM, et al. The dis- tribution of cerebral microbleeds determines their association with arterial stiffness in non-cardioembolic acute stroke patients. Eur J Neurol 2014;21:463-469.
13. Wardlaw JM, Smith EE, Biessels GJ, Cordonnier C, Fazekas F, Frayne R, et al. Neuroimaging standards for research into small vessel dis- ease and its contribution to ageing and neurodegeneration. Lancet Neurol 2013;12:822-838.
14. Kim YD, Jung YH, Saposnik G. Traditional risk factors for stroke in East Asia. J Stroke 2016;18:273-285.
15. Oh MS, Yu KH, Lee JH, Jung S, Ko IS, Shin JH, et al. Validity and reli- ability of a Korean version of the national institutes of health stroke scale. J Clin Neurol 2012;8:177-183.
16. Adams HP Jr, Bendixen BH, Kappelle LJ, Biller J, Love BB, Gordon DL, et al. Classification of subtype of acute ischemic stroke. Defini- tions for use in a multicenter clinical trial. TOAST. Trial of Org 10172 in Acute Stroke Treatment. Stroke 1993;24:35-41.
17. Kim HC, Choi DP, Ahn SV, Nam CM, Suh I. Six-year survival and causes of death among stroke patients in Korea. Neuroepidemiology 2009;32:94-100.
18. Adachi T, Kobayashi S, Yamaguchi S. Frequency and pathogenesis of silent subcortical brain infarction in acute first-ever ischemic stroke.
Intern Med 2002;41:103-108.
19. Vermeer SE, Longstreth WT Jr, Koudstaal PJ. Silent brain infarcts: a systematic review. Lancet Neurol 2007;6:611-619.
20. Klarenbeek P, van Oostenbrugge RJ, Rouhl RP, Knottnerus IL, Staals J. Ambulatory blood pressure in patients with lacunar stroke: associ- ation with total MRI burden of cerebral small vessel disease. Stroke
Song TJ et al.
JCN
2013;44:2995-2999.
21. Arsava EM, Rahman R, Rosand J, Lu J, Smith EE, Rost NS, et al. Se- verity of leukoaraiosis correlates with clinical outcome after ischemic stroke. Neurology 2009;72:1403-1410.
22. Lim JS, Hong KS, Kim GM, Bang OY, Bae HJ, Kwon HM, et al. Cere- bral microbleeds and early recurrent stroke after transient ischemic attack: results from the Korean Transient Ischemic Attack Expression Registry. JAMA Neurol 2015;72:301-308.
23. Soo YO, Yang SR, Lam WW, Wong A, Fan YH, Leung HH, et al. Risk vs benefit of anti-thrombotic therapy in ischaemic stroke patients with cerebral microbleeds. J Neurol 2008;255:1679-1686.
24. Altmann-Schneider I, Trompet S, de Craen AJ, van Es AC, Jukema JW, Stott DJ, et al. Cerebral microbleeds are predictive of mortality in the elderly. Stroke 2011;42:638-644.
25. Bokura H, Kobayashi S, Yamaguchi S, Iijima K, Nagai A, Toyoda G, et al. Silent brain infarction and subcortical white matter lesions in- crease the risk of stroke and mortality: a prospective cohort study. J Stroke Cerebrovasc Dis 2006;15:57-63.
26. Montagne A, Pa J, Zlokovic BV. Vascular plasticity and cognition during normal aging and dementia. JAMA Neurol 2015;72:495-496.
27. Kim YD, Song D, Kim EH, Lee KJ, Lee HS, Nam CM, et al. Long-term
mortality according to the characteristics of early neurological dete- rioration in ischemic stroke patients. Yonsei Med J 2014;55:669-675.
28. Kim J, Song TJ, Song D, Yoo J, Baek JH, Lee HS, et al. Prognostic value of urine dipstick proteinuria on mortality after acute ischemic stroke.
Atherosclerosis 2016;253:118-123.
29. Kim YD, Song D, Nam HS, Choi D, Kim JS, Kim BK, et al. Increased risk of cardiovascular events in stroke patients who had not undergone evaluation for coronary artery disease. Yonsei Med J 2017;58:114-122.
30. Oh MS, Yu KH, Roh JK, Lee BC; Korean Stroke Registry Study Group.
Gender differences in the mortality and outcome of stroke patients in Korea. Cerebrovasc Dis 2009;28:427-434.
31. Wong KS, Li H. Long-term mortality and recurrent stroke risk among Chinese stroke patients with predominant intracranial atherosclero- sis. Stroke 2003;34:2361-2366.
32. Putaala J, Haapaniemi E, Kurkinen M, Salonen O, Kaste M, Tatlisu- mak T. Silent brain infarcts, leukoaraiosis, and long-term prognosis in young ischemic stroke patients. Neurology 2011;76:1742-1749.
33. Charidimou A, Kakar P, Fox Z, Werring DJ. Cerebral microbleeds and recurrent stroke risk: systematic review and meta-analysis of prospective ischemic stroke and transient ischemic attack cohorts.
Stroke 2013;44:995-1001.