INTRODUCTION
Breast cancer is the most frequently diagnosed cancer and has become the leading cause of cancer-related death in fe- males worldwide [1]. Current treatments are largely deter- mined based on the status of the estrogen receptor (ER), pro- gesterone receptor (PR), and human epidermal growth factor receptor 2 (HER2) [2], or by clinicopathologic variables such as tumor size, tumor grade, and lymph node status [3]. Al- though these parameters guide the therapeutic decision-mak-
ing process, the need remains for the development of new biomarkers and therapeutic strategies to combat breast cancer [4-6]. Therefore, the identification of novel biomarkers and a better understanding of their clinical significance would be beneficial for both the prognosis and therapy of breast cancer.
Epigenetics are independent of the sequence events that physically affect the condensing of chromatin and genes ex- pression [7]. Acetylation is one of the significant epigenetic markers associated with histones in the enhancers and pro- moters of genes, leading to chromatin remodeling and regula- tion of gene expression [8]. The level of genome acetylation is regulated through the engagement expression and activity of histone deacetylases (HDAC), as well as histone acetyltrans- ferases [9]. HDAC3, a member of class I HDACs, is overex- pressed in the majority of carcinomas [10,11], and is one of the most frequently upregulated genes in cancer [12]. Howev- er, the expression and function of HDAC3 in breast cancer re- mains unclear. Müller et al. [13] revealed that HDAC3 is sig-
Histone Deacetylase-3 Modification of MicroRNA-31 Promotes Cell
Proliferation and Aerobic Glycolysis in Breast Cancer and Is Predictive of Poor Prognosis
Yunfei Zhao, Jiao He, Ling Yang, Qichi Luo, Zhi Liu
Department of Pathology, Suining Central Hospital, Suining, China ORIGINAL ARTICLE
Purpose: The incidence and mortality of breast cancer is increas- ing worldwide. There is a constant quest to understand the un- derlying molecular biology of breast cancer so as to plan better treatment options. The purpose of the current study was to characterize the expression of histone deacetylases-3 (HDAC3), a member of class I HDACs, and assess the clinical significance of HDAC3 in breast cancer. Methods: Quantitative real-time poly- merase chain reaction, immunohistochemistry, and western blot analysis were used to examine messenger RNA and protein ex- pression levels. The relationships between HDAC3 expression and clinicopathological variables were analyzed. MTT assays were used to detect cell proliferation. Glucose-uptake, lactate, adenosine triphosphate, and lactate dehydrogenase assays were employed to detect aerobic glycolysis. Chromatin immuno- precipitation was used to detect microRNA-31 (miR-31) promot- er binding. Results: Our data revealed that HDAC3 was upregu- lated in breast cancer tissue compared with matched para-car-
cinoma tissues, and high levels of HDAC3 were positively corre- lated with advanced TNM stage and N stage of cancer. Further- more, overexpression of HDAC3 promoted breast cancer cell- proliferation and aerobic glycolysis. The functional involvement of HDAC3 was related in part to the repression of miR-31 tran- scription via decreased histone H3 acetylation at lysine K9 levels of the miR-31 promoter. Survival analysis revealed that the level of HDAC3 was an independent prognostic factor for breast can- cer patients. Conclusion: Our findings revealed that HDAC3 served as an oncogene that could promote cell proliferation and aerobic glycolysis and was predictive of a poor prognosis in breast cancer. HDAC3 participated in the cell proliferation of breast cancer, which may prove to be a pivotal epigenetic target against this devastating disease.
Key Words: Breast neoplasms, Glycolysis, Histone code, Histone deacetylase 3, Prognosis
Correspondence to: Yunfei Zhao
Department of Pathology, Suining Central Hospital, 127 West Desheng Road, Suining 629000, China
Tel: +86-158-8190-3697, Fax: +86-825-229-2603 E-mail: [email protected]
The present study was funded in part by the Municipal Scientific research funds (2015y03).
Received: January 7, 2018 Accepted: May 2, 2018
Cancer
nificantly higher in less differentiated breast cancer, as well as in cancer with negative hormone receptor status. In contrast, Krusche et al. [14] observed a significant correlation between increased expression of HDAC3 and hormone receptor-posi- tive tumors. Seo et al. [15] observed no significant association between hormone receptor status and the expression of HDAC3. These conflicting results have been the impetus for our further research aimed at illustrating the expression and function of HDAC3 in breast cancer.
MicroRNA-31 (miR-31) is a pleiotropically acting microRNA (miRNA) that has been implicated in cancer since it has been shown to inhibit invasion and metastasis of breast cancer and other cancer types including ovarian cancer [16] and gastric cancer [17]. The expression of miR-31 inversely correlates with metastasis in human breast cancer patients, and overex- pression of this miRNA inhibits breast cancer metastasis [18].
However, to date, the mechanism of regulation of this miRNA in breast cancer is yet to be elucidated.
In the current study, we examined the expression of HDAC3 and its subcellular localization in clinical breast cancer speci- mens. The correlation between HDAC3 and clinicopathologic parameters of breast cancer was also investigated. Further- more, we illustrated the biological function and underlying mechanism of HDAC3 in breast cancer. The functional in- volvement of HDAC3 was related in part to the repression of miR-31 transcription via decreased histone H3 acetylation at lysine K9 (H3K9ac) levels of the miR-31 promoter.
METHODS
Ethics statement
Written consent was obtained from all subjects study re- cruitment and prior to the start of any experiments. This study was approved by the Research Ethics Committee of Suining Central Hospital, Sichuan Province, China (ethics ap- proval number: 2017018).
Clinical samples
A total of 123 paraffin-embedded breast cancer tissue speci- mens and paired adjacent normal tissue specimens were col- lected by the Department of Pathology, Suining Central Hos- pital, Sichuan Province, between January 2002 and December 2015. All tumor samples were confirmed to contain more than 80% tumor cells using histological examination of se- quential sections by pathologists. In addition, fresh breast cancer tissue samples and adjacent noncancerous control tis- sues were obtained by surgical resection from 15 patients of the Department of General Surgery, Suining Central Hospital, Sichuan Province.
Immunohistochemical staining
The paraffin-embedded sections were deparaffinized with xylene, followed by rehydration using a graded series of etha- nol, and then stained with anti-HDAC3 antibody (ab7030;
Abcam, Cambridge, USA) diluted 1:500. Sections were subse- quently incubated for 1 hour with biotinylated IgG as a sec- ondary antibody and then for 30 minutes with horseradish peroxidase (HRP)-conjugated streptavidin. Colorimetric re- action products were visualized using 3,3´-diaminobenzidine as a chromogen. All sections were counterstained with hema- toxylin.
Immunohistochemical evaluation
All immunostained sections were randomly evaluated by three independent pathologists (J.H., L.Y., and Q.L.) in a blinded manner. The numbers of positive-staining and negative-stain- ing cells from five microscopic fields at high power were counted per slide. The percentage of positive cells was scored as previously described [19]. Briefly, no positive cells received a score of 0, ≤10% positive cells received a score of 1, 10%–
50% positive cells received a score of 2, and >50% positive cells received a score of 3. The staining intensity was also scored as follows: no staining=0, faint staining=1, moderate staining=2, and dark staining=3. A comprehensive score was calculated as the staining percentage×the staining intensity.
Overall HDAC3 expression was classified as low expression with a score ≤6 and high expression with a score >6.
Cell culture
Human breast cancer cell-lines T47D, MCF-7, MDA- MB-231, and MDA-MB-468, along with the cell line of nor- mal epithelial breast cells MCF10A were obtained from the Shanghai Cell Bank (Shanghai, China) and cultured using the recommended media supplemented with 10% fetal bovine serum (Gibco, New York, USA). All the cell lines had been tested and authenticated by the Shanghai Cell Bank.
Plasmids, small interfering RNAs, and the overexpression vector
The miR-31 inhibitor, control miRNAs, HDAC3 control, HDAC3 small interfering RNA, and the overexpression vector were all purchased from GeneChem (Shanghai, China). The cell transfections were carried out using Lipofectamine 2000 (Invitrogen, Carlsbad, USA) according to manufacturer’s in- structions.
Real-time reverse transcription polymerase chain reaction Total RNA extraction and the real-time reverse transcription polymerase chain reaction (RT-PCR) analysis were performed
using the manufacturer’s instructions (Takara Bio Inc., Shiga, Japan). For detection of miR-31, the primers of miR-31 used in the reaction were 5´-TAATACTGCCTGGTAATGATGA-3´
and 5´-GTCGTATCCAGTGCAGGGTCCGAGGTATTCG- CACTGGATACGACAGCTAT-3´ And U6 snRNA (5´-GCGC- GTCGTGAAGCGTTC-3´, 5´-GTGCAGG GTCCGA GGT-3´) was used as an internal control. For detecting the messenger RNA (mRNA) of HDAC3, the sense primer sequence of HDAC3 was 5´-ACGTGGGCAACTTCC ACTAC-3´ and the reverse primer sequence of HDAC3 was 5´-GACTCTTGGT- GAAGCCTTGC-3´. The mRNA from the β-actin gene was used as a control. The forward primer sequence of β-actin was 5´-CATTAAGGAGAAGCTGTGCT-3´, and the reverse primer sequence was 5´-GTTGAAGGTAGTT TCGTGGA-3´.
Western blotting analysis
Total protein samples were extracted, and the concentra- tions were determined using a bicinchoninic acid protein as- say kit purchased from Beyotime Biotechnology (Haimen, China). Sample lysates were separated by sodium dodecyl sul- fate-polyacrylamide gel electrophoresis and transferred onto a polyvinylidene fluoride membrane. The membrane was incu- bated with antibodies specific for HDAC3 (ab7030; Abcam) diluted 1:1,000 or β-actin (Santa Cruz Biotechnology, Santa Cruz, USA) diluted 1:5,000 at 4°C overnight, followed by in- cubation with the appropriate HRP-conjugated secondary an- tibodies.
MTT assay
Cell proliferation was analyzed using tetrazolium salt 3-(4,5-dimethylthiazol-2-yl)-2, 5-diphenyltetrazolium bro- mide (MTT). Briefly, 3,000 cells from each group were plated in 96-well plates in 100 μL 1,640 medium. For analysis, 20 μL of MTT substrate was added to each well and the plates were incubated for an additional 4 hours at 37°C with 5% CO2. The medium was removed, and the cells were solubilized in 150 μL dimethylsulfoxide. The colorimetric analysis was per- formed at a wavelength of 492 nm.
Glucose-uptake, lactate, adenosine triphosphate, and lactate dehydrogenase assays
The Lactate Dehydrogenase Activity Assay Kit (Sigma, St.
Louis, USA), Lactate Assay Kit (Sigma), Colorimetric Glucose Assay Kit (BioVision, Milpitas, USA), and a firefly luciferase- based adenosine triphosphate (ATP) assay kit (Beyotime Bio- technology) were used to determine glucose uptake, lactate production, ATP production, and lactate dehydrogenase (LDH) activity, respectively, according to the manufacturer’s protocols.
Immunofluorescence assay
MCF7 cell were cultured in complete medium for 48 hours and fixed in 4% paraformaldehyde for 10 minutes at room temperature. The cells were permeabilized with phosphate- buffered saline (PBS) containing 0.2% Triton-X100 for 5 min- utes at room temperature, washed three times in PBS contain- ing Triton-X100 and blocked with 5% bovine serum albumin for 30 minutes at room temperature. The cells were incubated with antibody against HDAC3 (ab7030; Abcam) diluted 1:200, overnight at 4°C. After washing, the cells were labeled with secondary antibody, followed by examination under a fluores- cence microscope (Nikon Corp., Tokyo, Japan). The nuclear dye 4´,6-diamidino-2-phenylindole (DAPI) was purchased from Sigma-Aldrich (Darmstadt, Germany) and was incubat- ed with the immunostained cells at room temperature for 10 minutes at the concentration of 1 μg/mL.
Chromatin immunoprecipitation
Chromatin immunoprecipitation (ChIP) was performed using the Upstate Biotechnology ChIP kit (Upstate Biotech- nology, Lake Placid, USA). Briefly, tissues were fixed in 1%
formaldehyde and the cell lysates were sheared by sonication in 1% sodium dodecyl sulfate lysis buffer to generate chroma- tin fragments with an average of 200 to 1,000 bp. The chroma- tin was then immunoprecipitated overnight at 4°C with anti- bodies specific to HDAC3 (Abcam), H3K9ac (Millipore, Billerica, USA), or an equivalent amount of an isotype control IgG (Santa Cruz Biotechnology). Protein-DNA-antibody complexes were precipitated with protein A-agarose beads for 2 hours at 4°C. Input DNA and levels of DNA in the complex were analyzed by RT-PCR to quantitate enrichment. Primers used were as described previously [20]. The sequences were 5´-CAATTTTGGCCCAGGAGATA-3´ for the forward primer and 5´-TTTCCGGGGACCTCTAGTTT-3´ for the reverse primer.
Statistical analysis
All statistical analyses were performed using SPSS version 13.0 (SPSS Inc., Chicago, USA). Data are expressed as means±
standard error of the mean. The statistical correlation of data between groups was analyzed by one-way analysis of variance and Student t-test as appropriate. The chi-square test was used to analyze the correlation between the clinicopathological characteristics and HDAC3 expression. Overall survival (OS) was estimated using the Kaplan-Meier method and compared using the log-rank test. Significant variables were further ana- lyzed by multivariate analysis to test for independent progno- sis. p-values of <0.05 were considered statistically significant.
RESULTS
The level of HDAC3 expression was upregulated in breast cancer
The mRNA expression levels of HDAC3 in breast cancer tissue of 15 fresh specimens and their paired normal samples
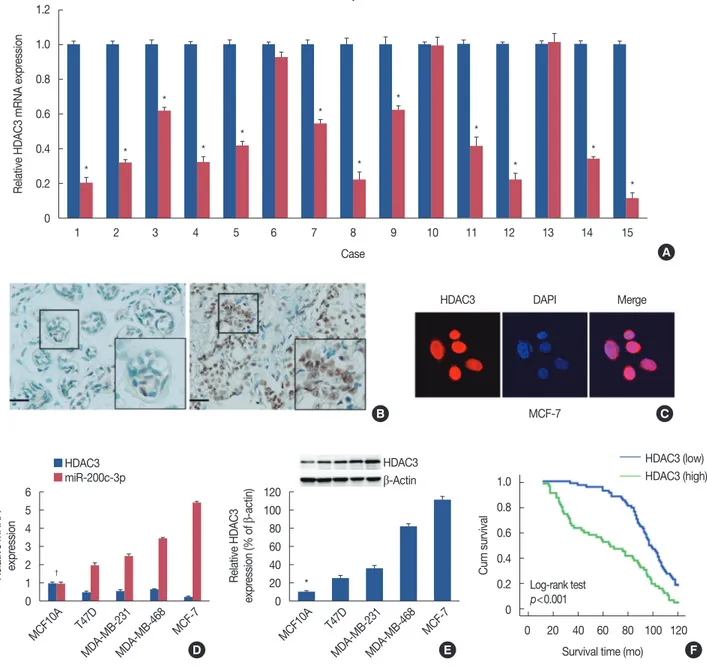
were quantitated using RT-PCR. Twelve of the breast cancer samples (80%, 12/15) showed a ≥2-fold increase in HDAC3 mRNA levels compared to levels in the paired adjacent nontu- mor tissues (Figure 1A). The expression of HDAC3 protein in breast cancer tissue, evaluated using immunohistochemical staining, was primarily localized in the cell nucleus, as shown
Figure 1. Histone deacetylases-3 (HDAC3) expression in breast cancer. (A) Real-time reverse transcription polymerase chain reaction (RT-PCR) was performed to analyze of messenger RNA (mRNA) expression of HDAC3 in breast cancer tissue of 15 fresh specimens and their paired normal sam- ples. (B) Representative figures of HDAC3 protein expression in adjacent normal tissue (left) and breast cancer tissue (right) using immunohistochemi- cal staining (immunohistochemistry for HDAC3, ×200). (C) Immunofluorescence showed that HDAC3 expression was mainly localized in the cell nu- cleus in MCF7 cell line. (D) RT-PCR was employed to analyze of mRNA expression of HDAC3 in breast cancer cell lines and normal epithelial breast MCF10A cells. (E) Western blotting analysis of HDAC3 protein expression in breast cancer cell lines and normal epithelial breast MCF10A cells. (F) As- sociation between HDAC3 expression and the prognosis of breast cancer patients.
DAPI=4´,6-diamidino-2-phenylindole. *p<0.05; †p<0.05 vs. MCF10A.
1.2
1.0
0.8
0.6 0.4
0.2
0
6 5 4 3 2 1 0
120 100 80 60 40 20 0
1.0 0.8 0.6 0.4 0.2 0
1 2 3 4 5 6 7 8 9 10 11 12 13 14 15
MCF10A MCF10A 0 20 40 60 80 100 120
Survival time (mo) Log-rank test
p<0.001
T47D T47D
MDA-MB-231MDA-MB-468 MDA-MB-231MDA-MB-468
MCF-7 MCF-7
Case
Relative HDAC3 mRNA expression
Relative mRNA expression Relative HDAC3 expression (% of β-actin) Cum survival
A
*
†
*
*
*
*
*
*
*
*
*
*
*
* Tumor tissues Adjacent normal tissues
B
E D
C
F
HDAC3 DAPI
MCF-7
Merge
HDAC3 miR-200c-3p
HDAC3 β-Actin
HDAC3 (low) HDAC3 (high)
in Figure 1B. Of the 123 paraffin-embedded tumor-tissue samples, 55 (44.7%) demonstrated high HDAC3 expression, whereas only 20 (16.3%) had high expression in adjacent non- tumor tissues (p<0.001) (Table 1, Figure 1B). Immunofluo- rescence analysis confirmed that HDAC3 expression was pri- marily localized to the cell nucleus in the MCF-7 cell line (Figure 1C). Furthermore, the four breast cancer cell lines T47D, MDA-MB-231, MDA-MB-468, and MCF-7 exhibited higher expression levels of HDAC3 mRNA (p=0.003) (Figure 1D) and protein (p=0.004) (Figure 1E) than levels observed in normal epithelial breast MCF10A cells. These results sug- gest that HDAC3 expression is upregulated in breast cancer.
Correlation between HDAC3 expression and clinicopathological characteristics of breast cancer
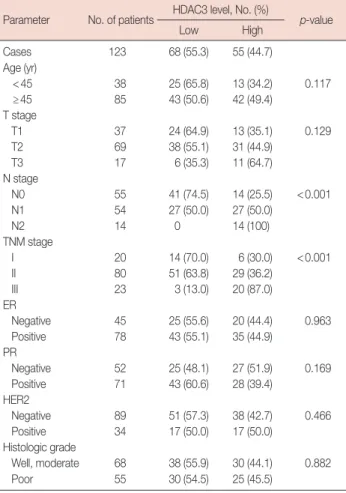
The correlation between HDAC3 expression and clinico- pathological characteristics of breast cancer were further eval- uated. Based on immunohistochemical scores, the patients were divided into two groups (low and high). As shown in Ta- ble 2, a high expression level of HDAC3 was positively corre- lated with an advanced TNM stage (p<0.001) and N stage (p<0.001). However, it was not associated with the T stage (p=0.129), ER status (p=0.963), PR status (p=0.169), HER2 status (p=0.466), age (p=0.117), or histologic grade (p=
0.882).
Association between HDAC3 expression and the prognosis of breast cancer patients
Kaplan-Meier survival curves and log-rank test were used to investigate the prognostic effect of HDAC3 on the survival rate for breast cancer patients. Log-rank tests revealed that pa- tients with breast cancer expressing high HDAC3 levels had significantly lower OS than those expressing low HDAC3 lev- els (p<0.001) (Figure 1F). As shown in Table 3, univariate analysis indicated that the HDAC3 level (p<0.001), T stage (p<0.001), N stage (p=0.001), TNM stage (p<0.001), and tumor differentiation (p=0.032) all correlated with patient survival. Multivariate analysis showed that in addition to T stage, N stage, and TNM stage, HDAC3 levels were indepen- dent prognostic factors for breast cancer patients (p=0.035) (Table 3).
Knockdown of HDAC3 inhibited breast cancer cell proliferation through suppression of aerobic glycolysis
Knockdown of HDAC3 in MCF-7 and MDA-MB-268 cell lines, which had relatively high HDAC3 levels (Figure 1D and 1E), was used to explore the effect of HDAC3 on breast cancer cell proliferation. Western blotting was used to confirm the ef- ficacy of HDAC3 knockdown (Figure 2A and 2B). An MTT assay was performed to assess cell proliferation. The results revealed that downregulation of HDAC3 expression signifi- cantly suppressed cell proliferation (p=0.003, Figure 2A; p=
0.004, Figure 2B).
Subsequently, we explored the underlying mechanism of HDAC3-induced cell proliferation. Our data showed that HDAC3 downregulation markedly decreased LDH activity, glucose utilization, and lactate production, and increased the levels of intracellular ATP in breast cancer cells (Figure 2C and 2D). Taken together, the results indicated that HDAC3 promoted breast cancer cell-proliferation in part through aer- obic glycolysis.
Table 1. Comparisons with HDAC3 expression between breast cancer tissues and paired adjacent normal tissues
Tissue No. of cases
HDAC3 level, No. (%)
p-value
Low High
Breast cancer 123 68 (55.3) 55 (44.7) <0.001 Adjacent normal 123 103 (83.7) 20 (16.3)
HDAC3=histone deacetylases-3.
Table 2. Associations between HDAC3 expression and clinicopatho- logical characteristics in breast cancer
Parameter No. of patients HDAC3 level, No. (%)
p-value
Low High
Cases 123 68 (55.3) 55 (44.7) Age (yr)
<45 38 25 (65.8) 13 (34.2) 0.117 ≥45 85 43 (50.6) 42 (49.4)
T stage
T1 37 24 (64.9) 13 (35.1) 0.129
T2 69 38 (55.1) 31 (44.9)
T3 17 6 (35.3) 11 (64.7)
N stage
N0 55 41 (74.5) 14 (25.5) <0.001
N1 54 27 (50.0) 27 (50.0)
N2 14 0 14 (100)
TNM stage
I 20 14 (70.0) 6 (30.0) <0.001
II 80 51 (63.8) 29 (36.2)
III 23 3 (13.0) 20 (87.0)
ER
Negative 45 25 (55.6) 20 (44.4) 0.963 Positive 78 43 (55.1) 35 (44.9)
PR
Negative 52 25 (48.1) 27 (51.9) 0.169 Positive 71 43 (60.6) 28 (39.4)
HER2
Negative 89 51 (57.3) 38 (42.7) 0.466 Positive 34 17 (50.0) 17 (50.0)
Histologic grade
Well, moderate 68 38 (55.9) 30 (44.1) 0.882 Poor 55 30 (54.5) 25 (45.5)
HDAC3=histone deacetylases-3; ER=estrogen receptor; PR=progesterone receptor; HER2=human epidermal growth factor receptor 2.
Transfection of miR-31 inhibitor can rescue the loss of HDAC3- mediated repression activity in breast cancer cells
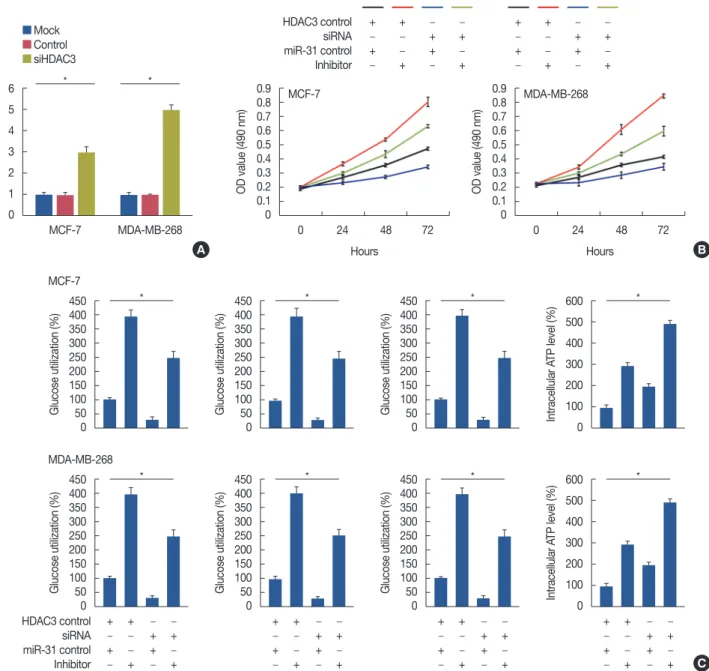
Analysis of the effects of HDAC3 expression on miR-31 mRNA levels showed that expression of miR-31 was upregu- lated by the knockdown of HDAC3 (MCF-7, p=0.002; MDA- MB-268, p=0.001) (Figure 3A). The transfection of cells with an miR-31 inhibitor rescued the loss of HDAC3-mediated re- pression activity in breast cancer cells, including reduced cell proliferation (Figure 3B), decreased LDH activity, glucose uti- lization, and lactate production, and increased intracellular ATP levels (Figure 3C).
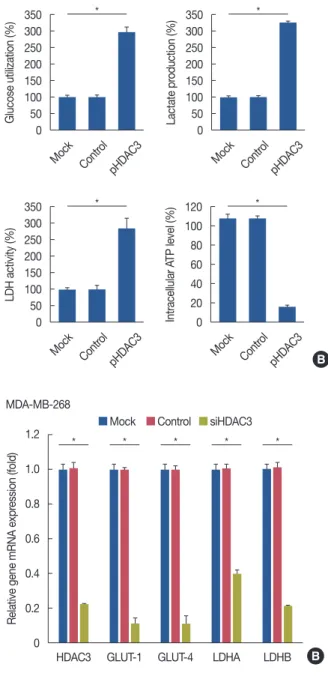
Overexpression of HDAC3 promoted breast cell proliferation through the promotion of aerobic glycolysis
Overexpressed HDAC3 in nontumorigenic MCF10A cells showed that HDAC3 upregulation promoted MCF10A cell proliferation (p<0.001) (Figure 4A). Furthermore, overex-
pression of HDAC3 markedly increased LDH activity, glucose utilization, and lactate production, and decreased intracellular ATP levels (Figure 4B).
HDAC3 regulated the gene expression of related metabolic enzymes
We determined the levels of related metabolic enzymes in response to HDAC3 knockdown and overexpression. The re- sults showed that the inhibition of HDAC3 expression de- creased glucose transporter 1 (GLUT-1), GLUT-4, lactate de- hydrogenase A (LDHA), and lactate dehydrogenase B (LDHB) expression (Figure 5A and 5B). In contrast, induc- tion of HDAC3 expression increased GLUT-1, GLUT-4, LDHA, and LDHB expression (Figure 5C).
HDAC3 regulated miR-31 transcriptional activity
To further provide evidence that HDAC3 binds directly to Table 3. Summary of univariate and multivariate Cox regression analysis of overall survival duration in all breast cancer patients (n=123)
Parameter Univariate analysis Multivariate analysis
HR 95% CI p-value HR 95% CI p-value
HDAC3
Low 1 Reference 1 Reference
High 2.119 1.499–3.225 <0.001 1.597 1.033–2.469 0.035
Age (yr)
<45 1 Reference
≥45 1.375 0.905–2.088 0.136
T stage
T1 1 Reference 1 Reference
T2 2.412 1.507–4.617 <0.001 1.465 0.817–2.627 0.200
T3 9.125 4.617–18.033 <0.001 5.976 2.166–16.483 0.001
N stage
N0 1 Reference 1 Reference
N1 2.259 1.489–3.426 <0.001 1.567 0.915–2.686 0.102
N2 19.82 9.424–41.684 <0.001 7.961 1.959–32.350 0.004
TNM stage
I 1 Reference 1 Reference
II 4.654 2.295–9.435 <0.001 2.731 1.075–6.938 0.035
III 63.014 24.892–159.517 <0.001 6.356 1.277–31.719 0.024
ER
Negative 1 Reference
Positive 1.232 0.826–1.838 0.307
PR
Negative 1 Reference
Positive 1.015 0.692–1.490 0.937
HER2
Negative 1 Reference
Positive 1.128 0.739–1.720 0.577
Histologic grade
Well, moderate 1 Reference
Poor 1.517 1.036–2.222 0.032
HR=hazard ratio; CI=confidence interval; HDAC3=histone deacetylases-3; ER=estrogen receptor; PR=progesterone receptor; HER2=human epidermal growth factor receptor 2.
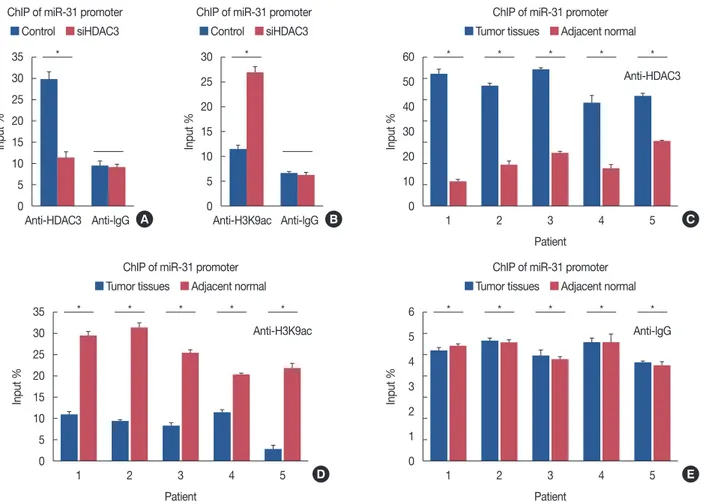
the miR-31 promoter, we conducted a Chip assay using MCF- 7-conHDAC3 and MCF-7-siHDAC3 cells. Compared to the MCF-7-conHDAC3 cells, the MCF-7-siHDAC3 cells exhibit- ed reduced HDAC3 recruitment to the miR-31 promoter (p<0.001) (Figure 6A). In contrast, knockdown of HDAC3 resulted in increased levels of H3K9ac of the miR-31 promot-
er (p<0.001) (Figure 6B).
Finally, we analyzed HDAC3 recruitment to the miR-31 promoter in five paired breast cancer specimens and their re- spective adjacent normal tissues. Compared with normal tis- sues, HDAC3 recruitment to the miR-31 promoter was in- creased in breast cancer tissues, while H3K9ac recruitment Figure 2. The decrease of cell proliferation and aeroobic glycolysis in response to histone deacetylases-3 (HDAC3) knockdown. The proliferation curve of cells after transfected with control vector or HDAC3 small interfering RNA (siHDAC3) in MCF7 (A) and MDA-MB-268 (B) cell lines, respective- ly. The glucose utilization, lactate production, lactate dehydrogenase (LDH) activity and intracellular adenosine triphosphate (ATP) level were detected in MCF7 (C) and MDA-MB-268 (D) after transfecting of control vector or siHDAC3.
OD=optical density. *p<0.05.
MockContr Mock
ol
Contr ol
siHDAC3 siHDAC3
HDAC3 β-Actin
HDAC3 β-Actin 0.9
0.8 0.7 0.6 0.5 0.4 0.3 0.2 0.1 0
0.8 0.7 0.6 0.5 0.4 0.3 0.2 0.1
0 24 48 72 0 0 24 48 72
Hours Hours
MCF-7
MCF-7
MDA-MB-268
MDA-MB-268
OD value (490 nm) OD value (490 nm)
A B
C
D Mock
Control siHDAC3
Mock Control siHDAC3
120 100 80 60 40 20 0
120 100 80 60 40 20 0
120 100 80 60 40 20 0
120 100 80 60 40 20 0
120 100 80 60 40 20 0
120 100 80 60 40 20 0
200 150 100 50 0
200 150 100 50 0 Mock
Mock
Mock
Mock
Mock
Mock
Mock
Mock Contr
ol
Contr ol
Contr ol
Contr ol
Contr ol
Contr ol
Contr ol
Contr ol siHDAC3
siHDAC3
siHDAC3
siHDAC3
siHDAC3
siHDAC3
siHDAC3
siHDAC3
Glucose utilization (%)Glucose utilization (%) Lactate production (%)Lactate production (%) LDH activity (%)LDH activity (%) Intracellular ATP level (%)Intracellular ATP level (%)
*
*
*
*
*
*
*
*
Figure 3. Rescue the loss of histone deacetylases-3 (HDAC3)-mediated repression activity by transfection of microRNA-31 (miR-31) inhibitor in breast cancer. (A) HDAC3 knockdown decreased miR-31 expression. (B) Transfection of miR-31 inhibitor can rescue the loss of HDAC3-mediated reduced cell proliferation in breast cancer. (C) Transfection of miR-31 inhibitor can rescue the loss of HDAC3-mediated decreased lactate dehydrogenase (LDH) activity, glucose utilization, and lactate production and increased intracellular adenosine triphosphate (ATP) level.
OD=optical density; siHDAC3=HDAC3 small interfering RNA; siRNA=small interfering RNA. *p<0.05.
MCF-7
MCF-7
MDA-MB-268
0 24 48 72 0 24 48 72
MCF-7 MDA-MB-268
Hours Hours
MDA-MB-268 6
5 4 3 2 1 0
450 400 350 300 250 200 150 100 50 0
450 400 350 300 250 200 150 100 50 0
450 400 350 300 250 200 150 100 50 0
450 400 350 300 250 200 150 100 50 0
450 400 350 300 250 200 150 100 50 0
450 400 350 300 250 200 150 100 50 0
600 500 400 300 200 100 0
600 500 400 300 200 100 0 0.9
0.8 0.7 0.6 0.5 0.4 0.3 0.2 0.1 0
0.9 0.8 0.7 0.6 0.5 0.4 0.3 0.2 0.1 0
Relative miR-31 level Glucose utilization (%)Glucose utilization (%) Glucose utilization (%)Glucose utilization (%) Glucose utilization (%)Glucose utilization (%) Intracellular ATP level (%)Intracellular ATP level (%)
OD value (490 nm) OD value (490 nm)
Mock Control siHDAC3
*
*
*
*
*
*
*
*
*
*
A B
C HDAC3 control + + − −
siRNA − − + +
miR-31 control + − + −
Inhibitor − + − +
+ + − −
− − + +
+ − + −
− + − +
HDAC3 control + + − −
siRNA − − + +
miR-31 control + − + − Inhibitor − + − +
+ + − −
− − + +
+ − + −
− + − +
+ + − −
− − + +
+ − + −
− + − +
+ + − −
− − + +
+ − + −
− + − +
was decreased (Figure 6C-6E). Taken together, these data sug- gest that HDAC3 binds to the miR-31 promoter to mediate miR-31 transcription in breast cancer cells. We also observed an inverse correlation between HDAC3 expression and miR- 31 mRNA expression in breast cancer cell lines (Figure 1D).
DISCUSSION
HDAC3 belongs to Class I HDACs (HDAC1, 2, 3, and 8),
which are critical regulators of fundamental cellular events such as cell cycle, differentiation, and apoptosis [21]. The up- regulation of HDAC3 has been observed in various malignan- cies, including cholangiocarcinoma [22], pancreatic cancer [19], colon cancer, ovarian cancer, and lung cancer [23]. How- ever, the expression of HDAC3 and its association with clini- cal parameter in breast cancer are contradictory [13-15]. In our study, we observed that HDAC3 was upregulated in breast cancer tissue compared with para-carcinoma tissue. More-
Figure 4. The promotion of cell proliferation and aeroobic glycolysis after histone deacetylases-3 (HDAC3) overexpression. (A) HDAC3 upregulation promoted MCF10A cell proliferation. (B) The glucose utili- zation, lactate production, lactate dehydrogenase (LDH) activity and in- tracellular adenosine triphosphate (ATP) level were detected in MCF10A after transfecting of control vector or HDAC3 overexpression (pHDAC3).
OD=optical density. *p<0.05.
Mock Contr ol
pHDAC3 HDAC3 β-Actin 0.7
0.6 0.5 0.4 0.3 0.2 0.1
0 0 24 48 72
Hours
MCF10A
OD value (490 nm)
A
B Mock
Control pHDAC3
350 300 250 200 150 100 50 0
350 300 250 200 150 100 50 0
350 300 250 200 150 100 50 0
120 100 80 60 40 20 0
Mock Mock
Mock Mock
Contr ol
Contr ol
Contr ol
Contr ol
pHDAC3 pHDAC3
pHDAC3 pHDAC3
Glucose utilization (%) Lactate production (%)
LDH activity (%) Intracellular ATP level (%)
* *
* *
*
*
1.2
1.0
0.8 0.6
0.4
0.2
0
7 6 5 4 3 2 1 0
1.2
1.0
0.8 0.6
0.4
0.2
0 HDAC3
HDAC3
HDAC3 GLUT-1
GLUT-1
GLUT-1 GLUT-4
GLUT-4
GLUT-4 LDHA
LDHA
LDHA LDHB
LDHB
LDHB
Relative gene mRNA expression (fold)Relative gene mRNA expression (fold) Relative gene mRNA expression (fold)
A
C
B Mock Control siHDAC3
Mock Control pHDAC3
Mock Control siHDAC3
* * * * *
* * * * *
* * * * *
MCF-7
MCF10A
MDA-MB-268
Figure 5. Regulation of metabolic enzymes related gene expression by histone deacetylases-3 (HDAC3) level. Inhibition of HDAC3 expression decreased glucose transporter 1 (GLUT-1), GLUT-4, lactate dehydroge- nase A (LDHA) and lactate dehydrogenase B (LDHB) expression in MCF7 (A) and MDA-MB-268 (B) cell lines, respectively. (C) Induction of HDAC3 expression increased GLUT-1, GLUT-4, LDHA, and LDHB ex- pression in MCF10A cell.
siHDAC3=HDAC3 small interfering RNA; pHDAC3=HDAC3 overex- pression. *p<0.05.
over, HDAC3 expression positively correlated with advanced TNM stage and N stage. Patients with breast cancer express- ing high HDAC3 levels had significantly lower OS than those expressing low HDAC3 levels. Furthermore, multivariate analyses suggested that the level of HDAC3 was an indepen- dent prognostic factor for breast cancer patients.
We evaluated the biological function of HDAC3 in breast cancer. The results revealed that HDAC3 promoted breast cancer cell proliferation, in part through aerobic glycolysis, in- cluding increased LDH activity, glucose utilization, and lactate production, and decreased intracellular ATP levels. It is rea- sonable to hypothesize that HDAC3 may target the promoter and enhancers of tumor suppressor genes and other proteins that are related to tumor suppressor gene [24]. Jiao et al. [11]
suggest that HDAC3 participates in the pathogenesis and pro- gression of pancreatic cancer through postinduction repres- sion of P53, P27, and Bax gene transcription via H3K9 deacet-
ylation. Interestingly, a recent study found that HDAC3 can bind to the miRNA promoter, mediating miRNA transcrip- tional repression [20]. Koumangoye et al. [20] showed that HDAC3, SOX4, and EZH2 form a co-repressor complex that binds to the miR-31 promoter, repressing miR-31 through an epigenetic mark by H3K27me3 and by histone acetylation in advanced esophageal cancer.
One of the most frequently altered miRNAs in human can- cers is miR-31, whose expression and functions have been ex- tensively studied and well defined for many types of cancer [25,26]. It is reported that miR-31 is downregulated in ovarian cancer, prostate cancer, and glioma, while miR-31 is upregu- lated in colorectal, lung, and pancreatic cancers [26]. Overex- pression of miR-31 is a pleiotropically acting inhibitor of breast cancer metastasis [18,27,28], through its regulation of various target genes. Our results also showed that the expres- sion of miR-31 was upregulated by knockdown of HDAC3
35 30 25 20 15 10 5 0
6 5 4 3 2 1 0 60 50 40 30 20 10 0 35
30 25 20 15 10 5 0
30 25 20 15 10 5 0
1 1
1
Anti-HDAC3 Anti-H3K9ac
2 2
2
Anti-lgG Anti-lgG
3 3
3
4 4
4
5 5
5
Anti-H3K9ac Anti-lgG
Anti-HDAC3
Input % Input %Input %
Input % Input %
D E
C
A B
Tumor tissues Adjacent normal Tumor tissues Adjacent normal Tumor tissues Adjacent normal Control siHDAC3 Control siHDAC3
* *
*
* *
* *
*
* *
*
* *
*
* *
*
ChIP of miR-31 promoter
Patient
ChIP of miR-31 promoter
Patient Patient ChIP of miR-31 promoter ChIP of miR-31 promoter ChIP of miR-31 promoter
Figure 6. Regulation of microRNA-31(miR-31) transcriptional activity by histone deacetylases-3 (HDAC3). (A) Compared to MCF-7-conHDAC3, MCF-7-siHDAC3 cells exhibited a reduced HDAC3 recruitment to miR-31 promoter. (B) Knockdown of HDAC3 increased histone H3 acetylation at ly sine K9 (H3K9ac) levels at the miR-31 promoter. (C) Compared with normal tissues, HDAC3 recruitment to miR-31 promoter was increased in breast cancer tissues. (D) Compared with normal tissues, H3K9ac recruitment to miR-31 promoter was decreased. (E) Normal human IgG was used as a negative control.
ChIP=chromatin immunoprecipitation; conHDAC3=HDAC3 control; siHDAC3=HDAC3 small interfering RNA. *p<0.05.
expression. In addition, we found that transfection of miR-31 inhibitor could rescue the loss of HDAC3-mediated repressive activity in breast cancer, including reduced cell proliferation and decreased aerobic glycolysis. Furthermore, overexpres- sion of HDAC3 decreased H3K9ac levels bound to the miR- 31 promoter, leading to miR-31 transcriptional repression. Fi- nally, we analyzed HDAC3 recruitment to the miR-31 pro- moter in five breast cancer specimens and their respectively paired adjacent normal tissue samples. Compared with nor- mal tissues, HDAC3 recruitment to the miR-31 promoter was increased in breast cancer tissues, while H3K9ac recruitment was decreased. A recent study showed that miR-31 promotes mammary stem cell expansion and breast tumorigenesis by suppressing Wnt signaling antagonists [29]. This study repre- sents the first report of a physiological role for miR-31 in mammary tumorigenesis [29]. Based on previous findings and our results, we speculate that the levels of miR-31 expres- sion play a different role during different stages of breast can- cer. First, high levels of miR-31 promote breast tumorigenesis by suppressing Wnt signaling antagonists. Subsequently, miR- 31 expression is downregulated by epigenetic mechanisms, leading to breast cancer metastasis. The underlying mecha- nism needs to be further elaborated.
In conclusion, our findings revealed that HDAC3 served as an oncogene that could promote cell proliferation and aerobic glycolysis and was predictive of a poor prognosis in breast cancer patients. The functional involvement of HDAC3 was in part related to the repression of miR-31 transcription via decreased H3K9ac levels of the miR-31 promoter.
CONFLICT OF INTEREST
The authors declare that they have no competing interests.
REFERENCES
1. Siegel RL, Miller KD, Jemal A. Cancer statistics, 2017. CA Cancer J Clin 2017;67:7-30.
2. Staaf J, Ringnér M, Vallon-Christersson J, Jönsson G, Bendahl PO, Holm K, et al. Identification of subtypes in human epidermal growth factor receptor 2: positive breast cancer reveals a gene signature prognostic of outcome. J Clin Oncol 2010;28:1813-20.
3. O’Shaughnessy JA. Molecular signatures predict outcomes of breast cancer. N Engl J Med 2006;355:615-7.
4. Marmot MG, Altman DG, Cameron DA, Dewar JA, Thompson SG, Wilcox M. The benefits and harms of breast cancer screening: an inde- pendent review. Br J Cancer 2013;108:2205-40.
5. Kroemer G, Senovilla L, Galluzzi L, André F, Zitvogel L. Natural and therapy-induced immunosurveillance in breast cancer. Nat Med 2015;21:1128-38.
6. Brooks MD, Burness ML, Wicha MS. Therapeutic implications of
cellular heterogeneity and plasticity in breast cancer. Cell Stem Cell 2015;17:260-71.
7. Rice JC, Allis CD. Histone methylation versus histone acetylation: new insights into epigenetic regulation. Curr Opin Cell Biol 2001;13:263-73.
8. Buchwald M, Krämer OH, Heinzel T. HDACi: targets beyond chroma- tin. Cancer Lett 2009;280:160-7.
9. Legube G, Trouche D. Regulating histone acetyltransferases and deacet- ylases. EMBO Rep 2003;4:944-7.
10. Ma Y, Yue Y, Pan M, Sun J, Chu J, Lin X, et al. Histone deacetylase 3 inhibits new tumor suppressor gene DTWD1 in gastric cancer. Am J Cancer Res 2015;5:663-73.
11. Jiao F, Hu H, Yuan C, Jin Z, Guo Z, Wang L, et al. Histone deacetylase 3 promotes pancreatic cancer cell proliferation, invasion and increases drug-resistance through histone modification of P27, P53 and Bax. Int J Oncol 2014;45:1523-30.
12. Pilarsky C, Wenzig M, Specht T, Saeger HD, Grützmann R. Identification and validation of commonly overexpressed genes in solid tumors by comparison of microarray data. Neoplasia 2004;6:744-50.
13. Müller BM, Jana L, Kasajima A, Lehmann A, Prinzler J, Budczies J, et al.
Differential expression of histone deacetylases HDAC1, 2 and 3 in human breast cancer: overexpression of HDAC2 and HDAC3 is asso- ciated with clinicopathological indicators of disease progression. BMC Cancer 2013;13:215.
14. Krusche CA, Wülfing P, Kersting C, Vloet A, Böcker W, Kiesel L, et al.
Histone deacetylase-1 and -3 protein expression in human breast cancer: a tissue microarray analysis. Breast Cancer Res Treat 2005;90:
15-23.
15. Seo J, Min SK, Park HR, Kim DH, Kwon MJ, Kim LS, et al. Expression of histone deacetylases HDAC1, HDAC2, HDAC3, and HDAC6 in invasive ductal carcinomas of the breast. J Breast Cancer 2014;17:323- 31.
16. Creighton CJ, Fountain MD, Yu Z, Nagaraja AK, Zhu H, Khan M, et al.
Molecular profiling uncovers a p53-associated role for microRNA-31 in inhibiting the proliferation of serous ovarian carcinomas and other cancers. Cancer Res 2010;70:1906-15.
17. Wei J, Wang Z, Wang Z, Yang Y, Fu C, Zhu J, et al. MicroRNA-31 function as a suppressor was regulated by epigenetic mechanisms in gastric cancer. Biomed Res Int 2017;2017:5348490.
18. Valastyan S, Weinberg RA. miR-31: a crucial overseer of tumor metastasis and other emerging roles. Cell Cycle 2010;9:2124-9.
19. Jiao F, Hu H, Han T, Zhuo M, Yuan C, Yang H, et al. Aberrant expres- sion of nuclear HDAC3 and cytoplasmic CDH1 predict a poor prog- nosis for patients with pancreatic cancer. Oncotarget 2016;7:16505-16.
20. Koumangoye RB, Andl T, Taubenslag KJ, Zilberman ST, Taylor CJ, Loomans HA, et al. SOX4 interacts with EZH2 and HDAC3 to suppress microRNA-31 in invasive esophageal cancer cells. Mol Cancer 2015;14:24.
21. Bayat S, Shekari Khaniani M, Choupani J, Alivand MR, Mansoori Derakhshan S. HDACis (class I), cancer stem cell, and phytochemicals:
cancer therapy and prevention implications. Biomed Pharmacother 2018;97:1445-53.
22. Zhang M, Yin Y, Dorfman RG, Zou T, Pan Y, Li Y, et al. Down-regula- tion of HDAC3 inhibits growth of cholangiocarcinoma by inducing apoptosis. Oncotarget 2017;8:99402-13.
23. Marks P, Rifkind RA, Richon VM, Breslow R, Miller T, Kelly WK.
Histone deacetylases and cancer: causes and therapies. Nat Rev Cancer 2001;1:194-202.
24. Paszkowski J, Whitham SA. Gene silencing and DNA methylation processes. Curr Opin Plant Biol 2001;4:123-9.
25. Liu Z, Bai J, Zhang L, Lou F, Ke F, Cai W, et al. Conditional knockout of microRNA-31 promotes the development of colitis associated cancer.
Biochem Biophys Res Commun 2017;490:62-8.
26. Stepicheva NA, Song JL. Function and regulation of microRNA-31 in development and disease. Mol Reprod Dev 2016;83:654-74.
27. Rasheed SA, Teo CR, Beillard EJ, Voorhoeve PM, Zhou W, Ghosh S, et al. MicroRNA-31 controls G protein alpha-13 (GNA13) expression and cell invasion in breast cancer cells. Mol Cancer 2015;14:67.
28. Mulrane L, Gallagher WM, O’Connor DP. A novel mechanism of regulation of the anti-metastatic miR-31 by EMSY in breast cancer.
Breast Cancer Res 2014;16:467.
29. Lv C, Li F, Li X, Tian Y, Zhang Y, Sheng X, et al. MiR-31 promotes mam- mary stem cell expansion and breast tumorigenesis by suppressing Wnt signaling antagonists. Nat Commun 2017;8:1036.