Prevalence of Osteoporosis in Female Patients with Advanced Knee Osteoarthritis Undergoing Total Knee Arthroplasty
This study sought to demonstrate bone mineral density (BMD) conditions in elderly female patients with knee osteoarthritis (OA) undergoing total knee arthroplasty (TKA). In addition, we sought to determine whether their BMD conditions differ from those of community-based females without knee OA. Finally we sought to determine whether clinical statuses are related to BMD in the knee OA patients. BMD conditions in 347 female patients undergoing TKA and 273 community-based females were evaluated. Additionally, comparative analyses of BMD between age and body mass index-matched knee OA groups (n = 212) and the control groups (n = 212) were performed. In the pre-matched knee OA group, regression analyses were performed to determine whether preoperative clinical statuses were related to BMD. Considerable prevalence of coexistent osteoporosis (31%) was found in the pre-matched knee OA patients undergoing TKA. We found no significant differences of the BMD T-scores and the prevalence of osteoporosis between the age and body mass index-matched knee OA and control groups. In the pre-matched knee OA patients, poorer preoperative clinical scores were related to poorer BMD T-scores in the proximal femur and/or lumbar spine. Our study suggests that more attention should be paid to identify and treat osteoporosis in elderly female patients with advanced knee OA undergoing TKA.
Keywords: Bone Density; Osteoporosis; Female Knee Osteoarthritis Patient; Arthroplasty;
Knee Chong Bum Chang,1,2 Tae Kyun Kim,1,3
Yeon Gwi Kang,3 Sang Cheol Seong,1,3 and Seung-Baik Kang1,2
1Department of Orthopedic Surgery, Seoul National University College of Medicine, Seoul; 2Department of Orthopedic Surgery SMG-SNU Boramae Medical Center, Seoul; 3Department of Orthopedic Surgery, Seoul National University Bundang Hospital, Seongnam, Korea
Received: 22 January 2014 Accepted: 3 July 2014 Address for Correspondence:
Seung-Baik Kang, MD
Department of Orthopedic Surgery, Seoul National University College of Medicine, SMG-SNU Boramae Medical Center, 20 Boramae-ro 5-gil, Dongjak-gu, Seoul 156-707, Korea Tel: +82.2-870-2313, Fax: +82.2-831-3863 E-mail: [email protected]
Funding: This study was partially funded by Pfizer Global Pharmaceuticals (Grant Number: 06-05-039), specifically for data collection of the control group.
http://dx.doi.org/10.3346/jkms.2014.29.10.1425 • J Korean Med Sci 2014; 29: 1425-1431
INTRODUCTION
Osteoarthritis (OA) of the knee is a common cause of pain and disability in the elderly (1). In the progressively aging population, the number of patients with advanced knee OA undergoing to- tal knee arthroplasty (TKA) is increasing (2, 3). A female gender is another critical risk factor of advanced and symptomatic knee OA (4, 5). These two risk factors of advanced knee OA, aging and female gender, are also known to be major risk factors of osteoporosis, which is another issue of major concern (6, 7).
Nonetheless, orthopedic surgeons, particularly those caring for patients with advanced knee OA, have shown relatively little interest in the management of osteoporosis (8-10). This may be due to the traditionally held belief that patients with advanced knee OA are less likely to develop osteoporosis. Several previ- ous studies have reported the existence of an inverse relation- ship between osteoporosis and OA, particularly in the hip and knee (11-14). Furthermore, a higher body mass index has been reported to increase the risks of the development and progres- sion of OA of the knee (15, 16), but to decrease the risk of osteo- porosis (17, 18).
However, in our experience, a considerable proportion of el-
derly female patients with advanced knee OA undergoing TKA also have osteoporosis. These anecdotal observations seeming- ly contradict the previously held inverse relationship between knee OA and osteoporosis. However, this inverse relationship had been demonstrated by the studies using community-based populations with various stages of OA (11-14); and it is still un- clear whether this relationship would also be found in patients with advanced knee OA undergoing TKA. If our observation is the case, more functional deterioration in the knee OA patients might be related to lower bone mineral density (BMD) (19, 20).
However, little information is currently available regarding this speculation.
The first aim of this study was to demonstrate BMD T-scores and prevalence of osteoporosis in the elderly female patients with advanced knee OA undergoing TKA. The second aim was to determine whether elderly female patients with advanced knee OA undergoing TKA differ from age- and body mass in- dex-matched community-based female cohort without advanc- ed knee OA in terms of BMD T-scores and the prevalence of os- teoporosis. The third aim was to determine whether preopera- tive clinical statuses are related to BMD T-scores in patients with advanced knee OA undergoing TKA.
Musculoskeletal Disorders
MATERIALS AND METHODS Study design and subjects
For this study, we defined a major study group (knee OA group) which involves elderly female patients with advanced knee OA undergoing TKA. A comparative control group involves com- munity-based elderly female subjects without advanced knee OA. To control the major confounders of BMD and prevalence of osteoporosis between the above two groups, two cohorts were matched for age and body mass index (Fig. 1).
To determine sample sizes, a priori power analysis was per- formed for the Student’s t-test at an alpha level of 0.05 using an inter-group difference in mean BMD T-score of 0.5, which is 20% of the BMD T-score cut-off (-2.5) for defining osteoporosis.
Based on the information obtained from our patient database, a minimum of 64 subjects per study group were required to de- tect clinically meaningful differences with a power of 80%. Nev- ertheless, as one of the major aims of this study was to report prevalence of osteoporosis in the knee OA patients, we were en- couraged to enroll more patients than the calculated sample size.
To recruit subjects for knee OA groups, we reviewed a pro- spectively collected database and dual energy X-ray absorpti- ometry (DXA) scans of 522 consecutive female patients (801 knees) who underwent primary TKA by a single surgeon be- tween 2005 and 2007. During the database review, we excluded patients with the following conditions; 1) an age of < 65 yr (n = 127), 2) a diagnosis other than primary OA (n = 21), 3) condi- tion capable of affecting BMD scores, such as, hypercortisolism, hyperthyroidism, primary hyperparathyroidism, a history of cerebrovascular infarct, malignancy, heavy smoking and alco- holism (n = 13), 4) a history of hip surgery and/or spine surgery prior to the assessment of BMD (n = 14). After the implement- ing exclusions, 347 female patients with advanced knee OA re-
mained before matching for age and body mass index (Fig. 1).
All 347 patients had radiographic knee OA of Kellgren-Lawrence grade 3 or 4, predominantly grade 4 (89%, n = 307).
To recruit subjects for the control groups, we reviewed the database of a population-based prospective cohort study on health, aging, and common geriatric diseases in elderly Kore- ans (Korean Longitudinal Study on Health and Aging [KLoSHA]) (21). Candidates were randomly selected using resident regis- tration numbers. Finally 1,000 elderly subjects aged of ≥ 65 yr were enrolled in the baseline KLoSHA cohort. All assessments of subjects were performed at our hospital from September 2005 through October 2006. Of the 1,000 participants, we used a database of all female participants, 561 subjects, for the cur- rent study. For the 561 female participants initially identified, an orthopedic knee specialist assessed radiographs including standing anteroposterior, standing 45° flexion posteroanterior, and Merchant patellofemoral views of the knee. Based on these radiographic assessments, we excluded 275 subjects with radio- graphic OA of higher than Kellgren-Lawrence grade 2 in any compartment of the knee. In addition, we excluded 13 subjects for the following reasons: 1) a condition that had the potential to affect BMD score (n = 8), 2) a history of hip or spine surgery (n = 5). Consequently, 273 controls (the control group) remained before matching for age or body mass index (Fig. 1).
Then, we matched these two cohorts (advanced knee OA pa- tients and control subjects without OA in knee radiography) for age and body mass index using the propensity score matching method with the assistance of a statistician. The propensity score matching is a method of adjusting for observed characteristics can lead to selection bias or confounding. The propensity score is usually estimated using a logistic regression model, and the scores range from 0 to 1. Any two subjects with the same pro- pensity score can have different values for specific covariates, but overall, covariates entered in the propensity score model will tend to be balanced for study and control subjects with sim- ilar propensity score (22, 23). In this study, age and body mass index of the study and control cohorts were entered in the pro- pensity score model. After matching for age and body mass in- dex, 424 subjects (212 subjects in the age and body mass index- matched OA group and 212 subjects in the age and body mass index-matched control group) remained for this study.
Evaluation of BMD
All study subjects were evaluated for BMDs using a DXA scan (Lunar, GE, Milwaukee, WI, USA). Patients in the OA group un- derwent DXA scanning at 2-4 weeks before TKA, and subjects in the control group underwent scanning when they visited our institute to complete evaluations for KLoSHA. BMDs were mea- sured in lumbar vertebrae (L1-L4) and in the proximal femur (neck, trochanter, ward, and total) in all. Based on these values, BMD T-scores were calculated based on standard deviations Fig. 1. Study subjects enrollment flowchart. OA, osteoarthritis; TKA, total knee arthro-
plasty; K/L, Kellgren-Lawrence; BMI, body mass index.
212 Advanced knee OA patients
212 Control subjects 522 female patients
underwent TKA between 2005 and 2007
561 community-based elderly ( ≥ 65 yr) women
347 elderly ( ≥ 65 yr) female patients with advanced knee OA
273 elderly ( ≥ 65 yr) women without advanced knee OA Knee OA Group Control Group
Exclusion: 175 patients (age of < 65 yr, diagnosis other than
primary OA, etc.)
Exclusion: 288 subjects (Radiographic knee OA > K/L grade 2, etc.)
Age and BMI matching
(SDs) of reference BMD values for the young Korean female po- pulation (age 20-40 yr) (24).
The BMD T-scores of study subjects were interpreted accord- ing to the guidelines issued by the International Society for Clin- ical Densitometry (ISCD) (25). When interpreting BMD values of the proximal femur, values of the ward and trochanter were not used to determine the presence of osteoporosis. On the oth- er hand, lumbar BMDs were calculated by averaging the BMDs of L1 to L4. However, if an abnormal vertebral condition, such as, a compression fracture, was found on lumbar spine radio- graphs, and/or if the BMD T-scores of adjacent vertebrae dif- fered by more than 1.0, the BMD T-scores of affected vertebrae were not used to determine the presence of osteoporosis. In addition, when a subject had three or more vertebrae affected by these abnormal conditions, lumbar BMD T-scores was not used to determine the presence of osteoporosis. After applying these criteria, the lumbar BMD T-scores of 49 cases and 23 cas- es were not used for data analyses in the knee OA and the con- trol groups, respectively before matching process. Because of the exclusion, the lumbar BMD T-scores of 15 cases were not used for data analyses in both of these groups for the age and body mass index-matched comparisons. However, the BMD T-scores of the proximal femur of the entire subjects in the knee OA group and the control group were able to be used in the analyses
Evaluation of preoperative symptom severity and functional deterioration in the OA group
The clinical information of patients with advanced knee OA undergoing TKA prospectively collected using pre-designed datasheets and archived in our database by an independent in- vestigator. Preoperative American Knee Society (AKS) knee and function scores (26), Western Ontario McMaster University Os- teoarthritis Index (WOMAC) scores (27), and Short Form-36 (SF-36) scores (28) were used as proxies of preoperative symp- tom severity and functional deterioration. The evaluated pre- operative clinical scores are presented in Table 1.
Statistical analysis
The BMD T-scores and the BMD categories of the pre-matched knee OA group and the control group were computed and doc- umented. Then, comparative analyses of proximal femur and lumbar BMD T-scores and of BMD categories based on BMD T- scores (normal BMD, osteopenia, and osteoporosis) between the pre-matched knee OA groups and the control groups were carried out using the Student’s t-test and the chi-square test, re- spectively. In the analyses of BMD categories, we separately compared the BMD categories of the proximal femur and the lumbar spine based on the BMD T-scores of the corresponding area. We then compared the final BMD category of the subjects, which was defined as a lowest BMD T-score among the proxi- mal femur and the lumbar spine T-scores.
To compare the BMD conditions between the knee OA and the control groups after adjusting for the age and body mass in- dex, comparative analyses of proximal femur and lumbar BMD T-scores between the age and the body mass index-matched knee OA and the control groups were carried out using the Stu- dent’s t-test. Then, BMD categories between the two groups were compared using the chi-square test.
For the 347 patients in the pre-matched knee OA group, the relationships between the preoperative clinical scores (AKA, WOMAC and SF-36 scores) and the two BMD T-scores (lowest T-scores between the neck and total scores of the proximal fe- mur and the average T-scores of the lumbar spine) were inves- tigated using linear regression analyses. In the linear regression analyses, we entered age and body mass index as baseline co- variates. In addition, as all clinical scores except SF-36 mental component summary were significantly correlated with each other, we performed multiple linear regression analyses for each clinical score separately. Regression analyses results were sum- marized using regression coefficients (unstandardized coeffi- cients) and 95% confidence intervals for the coefficients.
Statistical analysis was performed using SPSS® for Windows® (Version 17.0, SPSS Inc., Chicago, IL, USA). P values of < 0.05 were considered significant.
Ethics statement
Approval for this study was granted by the institutional review board of Seoul National University Bundang Hospital (B-0912/
090-103). Informed consent was waived by the board.
RESULTS
We found considerable prevalence of coexistent osteoporosis (108 patients in 347 patients, 31%) in the pre-matched knee OA patients undergoing TKA. However, this prevalence was signifi- cantly lower than that of the pre-matched control group (31%
vs. 42% respectively, P = 0.001) (Table 2). In addition, the pre- matched knee OA group had better proximal femur and lum- Table 1. Summary of the preoperative WOMAC, SF-36 and AKS scores of the knee
OA group warranting TKA
Parameters Mean (Standard deviation)
WOMAC score (points) Pain (20) Function (68) Stiffness (8)
11.2 (4.1) 40.4 (12.5)
4.8 (2.0) SF-36 score (points)
Physical component summary
Mental component summary 28.6 (6.9)
41.0 (10.9) AKS score (points)
Knee (100)
Function (100) 43.6 (10.3)
55.3 (16.1)
WOMAC, Western Ontario McMaster University Osteoarthritis Index; SF-36, Short Form-36; AKS, American Knee Society; OA, Osteoarthritis; TKA, Total Knee Arthro- plasty.
bar BMD T-scores than the pre-matched control group. Never- theless, subjects of the knee OA group were significantly youn- ger and had higher body mass index than those of the pre-mat- ched control group (Table 3).
In the comparison of the BMD conditions between the age and body mass index-matched knee OA and control groups, we found no significant differences of the BMD T-scores and the prevalence of osteoporosis between the two groups (Tables 4, 5).
In the multiple regression analyses to find relationships be- tween the clinical status and the BMD T-scores in the pre-match- ed knee OA group, even after controlling effects of age and body
mass index on the BMD T-scores, majority of the clinical scores were significantly related to the BMD T-scores, in particular scores of the proximal femur. We found that poorer clinical scores but SF-36 mental component summary were related to poorer BMD T-scores of the proximal femur, while poorer WOMAC pain and function scores, and AKS function scores were related to poorer BMD-T scores of the lumbar spine (Table 6).
DISCUSSION
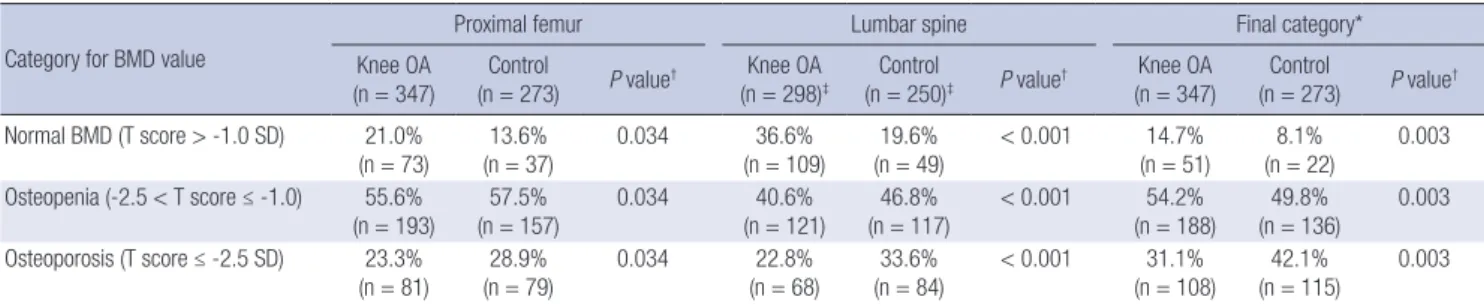
A number of previous studies in community-based populations Table 2. Comparisons of distributions of the bone mineral density (BMD) categories between the knee OA and control groups before age and body mass index matching process
Category for BMD value
Proximal femur Lumbar spine Final category*
Knee OA
(n = 347) Control
(n = 273) P value† Knee OA
(n = 298)‡ Control
(n = 250)‡ P value† Knee OA
(n = 347) Control
(n = 273) P value† Normal BMD (T score > -1.0 SD) 21.0%
(n = 73) 13.6%
(n = 37) 0.034 36.6%
(n = 109) 19.6%
(n = 49) < 0.001 14.7%
(n = 51) 8.1%
(n = 22) 0.003 Osteopenia (-2.5 < T score ≤ -1.0) 55.6%
(n = 193)
57.5%
(n = 157)
0.034 40.6%
(n = 121)
46.8%
(n = 117)
< 0.001 54.2%
(n = 188)
49.8%
(n = 136)
0.003 Osteoporosis (T score ≤ -2.5 SD) 23.3%
(n = 81) 28.9%
(n = 79) 0.034 22.8%
(n = 68) 33.6%
(n = 84) < 0.001 31.1%
(n = 108) 42.1%
(n = 115) 0.003
*Final category means BMD category defined using a lowest BMD T-score among the proximal femur or the lumbar spine T-scores; †Statistical analysis was performed using the chi-square test; ‡According to the guidelines issued by the International Society for Clinical Densitometry, inappropriate lumbar BMD T-scores of 49 cases and 23 cases were excluded from the knee OA and the control groups, respectively. OA, Osteoarthritis; SD, Standard Deviation.
Table 3. Comparisons of the demographics, bone mineral density (BMD) T-scores, between the knee OA and control groups before age and body mass index (BMI) matching process
Parameters Knee OA group (n = 347) Control group (n = 273) P value*
Mean SD (range) Mean SD (range) Demographics
Age (yr) Height (cm) Weight (kg) BMI (kg/m2)
70.6 151.6 60.5 26.3
4.4 (65-84) 6.5 (135-174) 9.0 (41-98) 3.4 (18.9-41.3)
72.4 150.9 56.3 24.7
6.6 (65-95) 5.6 (129-167) 8.5 (35-86) 3.1 (16.6-35.8)
< 0.001 0.127
< 0.001
< 0.001 BMD T-scores
Proximal femur Neck Femur total Lumbar spine
-1.67 -1.37 -1.35
0.92 (-4.0-2.2) 1.07 (-4.6-2.3) 1.37 (-4.25-3.35)
-1.84 -1.62 -1.92
0.88 (-4.4-0.9) 1.02 (-4.6-1.6) 1.24 (-6.10-1.80)
0.020 0.003
< 0.001
*Statistical analysis was performed using the Student’s t-test. P values with statistical significance (P value < 0.05) are in bold font. OA, Osteoarthritis; SD, Standard Deviation.
Table 5. Comparisons of distributions of the bone mineral density (BMD) categories between the knee OA and control groups after matched for age and body mass index Category for BMD value
Proximal femur Lumbar spine Final category*
Knee OA
(n = 212) Control
(n = 212) P value† Knee OA
(n = 197)‡ Control
(n = 197)‡ P value† Knee OA
(n = 212) Control
(n = 212) P value† Normal BMD (T score > -1.0 SD) 12.3%
(n = 26)
14.6%
(n = 31)
0.449 23.4%
(n = 46)
18.8%
(n = 37)
0.496 6.6%
(n = 14)
9.0%
(n = 19)
0.629 Osteopenia (-2.5 < T score ≤ -1.0) 57.1%
(n = 121) 59.9%
(n = 127) 0.449 47.7%
(n = 94) 48.7%
(n = 96) 0.496 53.3%
(n = 113) 50.5%
(n = 107) 0.629 Osteoporosis (T score ≤ -2.5 SD) 30.7%
(n = 65)
25.5%
(n = 54)
0.449 28.9%
(n = 57)
32.5%
(n = 64)
0.496 40.1%
(n = 85)
40.6%
(n = 86)
0.629
*Final category means BMD category defined using a lowest BMD T-score among the proximal femur or the lumbar spine T-scores; †Statistical analysis was performed using the chi-square test; ‡According to the guidelines issued by the International Society for Clinical Densitometry, inappropriate lumbar BMD T-scores of 15 cases in each group were excluded. OA, Osteoarthritis; SD, Standard Deviation.
Table 4. Comparative analysis of demographics and bone mineral density (BMD) T- scores of the advanced knee OA group and of the control group after matched for age and body mass index (BMI)
Parameters Knee OA group Control group
P value*
Mean SD (range) Mean SD (range) Demographics
Age (yr) Height (cm) Weight (kg) BMI (kg/m2)
71.1 150.3 57.5 25.4
4.5 (65-84) 5.7 (135-167) 7.6 (41-77) 2.8 (18.9-35.6)
71.0 151.3 58.4 25.5
5.3 (65-86) 5.5 (134-164) 7.9 (37-86) 2.9 (18.9-35.8)
0.940 0.070 0.259 0.883 BMD T-scores
Proximal femur Neck Femur total Lumbar spine
-1.81 -1.58 -1.81
0.83 (-4.0-0.4) 1.00 (-4.6-1.1) 1.17 (-4.55-2.37)
-1.70 -1.44 -1.92
0.86 (-4.4-0.9) 0.97 (-4.0-1.6) 1.11 (-4.23-1.70)
0.176 0.140 0.333
*Statistical analysis was performed using the Student’s t-test. OA, Osteoarthritis; SD, Standard Deviation.
have presented evidence of an inverse relationship between os- teoporosis and OA (11-14). However, little information is avail- able on whether patients with advance knee OA would be far less likely to develop osteoporosis by the inverse relationship.
As the patients with advanced knee OA have elevated risks of incident vertebral and nonvertebral (including hip) fractures (29, 30), precise information on the nature of BMD in this pa- tient group would be valuable to those involved in patient care and to those interested in social health care burden imposed by advanced knee OA (6, 7).
In the present study, the prevalence of osteoporosis in the pre-matched knee OA group was considerable, but lower than in that of the pre-matched control group. However, subjects in pre-matched knee OA group were younger and also had signifi- cantly higher body mass index, which have been reported to have a protective against osteoporosis (17, 18). To elucidate the isolated effect of advanced knee OA on BMD T-scores, the same comparisons were made after matching for both age and body mass index. We found that BMD T-scores in the age and body mass index-matched OA group were not significantly different from those in the age and body mass index-matched control group. In addition, the prevalence of osteoporosis between these two groups was also similar. This finding suggests that even thou- gh knee OA was known to have protective effect against osteo- porosis in the study based on community-based population (11-14), severe stage of knee OA per se would lose the protec- tive effect for some reason.
The results of regression analyses found that poorer preoper- ative functional statuses determined by AKS, WOMAC, and SF- 36 scores were related to poorer BMD T-scores, even after ad- justing for the effects of major confounders, namely, age and body mass index. These findings lead us to speculate that the
protective effect of a greater body mass index against osteopo- rosis is diluted by functional deterioration in patients with ad- vanced knee OA. Several previous studies have also reported the presence of a positive correlation between BMD and physi- cal exercise (19, 20). We also found that the relationship was more prominent in BMD T-score of the proximal femur than that of the lumbar spine (Table 6). The reason of this finding is unclear. One possible explanation might be that, compared to the BMD of the lumbar spine, the BMD of the proximal femur would be more susceptible to the functional deterioration caused by advanced knee OA, such as difficulty in walking, stair climb- ing, and so on. However, this speculation should be confirmed by further study. Moreover, as this study is a cross-sectional study, we were not able to draw a conclusion for a causal relationship between the functional status and the BMD condition.
Several limitations of the present study should be noted. First, although the calculated sample size using a priori power analy- sis was a minimum of 64 subjects per study group for this study, we recruited more subjects than the sample size to provide more reliable information on the prevalence of osteoporosis in the knee OA patients. When a sample size is too large, there would be a risk that very small difference of the results between the groups could be interpreted as clinically meaningful difference.
Nevertheless, even with large sample size, the BMD values and prevalence of osteoporosis between the age and body mass in- dex-matched knee OA and control groups were not statistically different in this study. Thus, large sample size would not make a problem for interpretation of our results. Second, our study was conducted in Korean women aged > 65 yr, and thus, our results may not be applicable to other populations, such as, men, younger subjects, and subjects with different ethnicities. Third, this study focused on advanced OA of the knee, and thus, our conclusions concerning the relationship between BMD and OA cannot be applied to other joints or to those with earlier stage knee OA. Fourth, as mentioned previously, even though we found relationship between poorer clinical scores and poorer BMD T-scores in our knee OA group, this result cannot be used to determine a causal relationship because of cross-sectional nature of our study.
In conclusion, this study demonstrates that a considerable proportion of elderly female patients with advanced knee OA have osteoporosis and its prevalence is similar with the com- munity based control group when matched age and body mass index. This finding indicates that advanced knee OA per se does not have a marked protective effect against osteoporosis. In ad- dition, this study found that more functional deteriorations would be related to poorer BMD in the patients with advanced knee OA. Based on our findings, we propose that more attention should be paid to identification and treatment of osteoporosis in elder- ly female patients with advanced knee OA undergoing TKA.
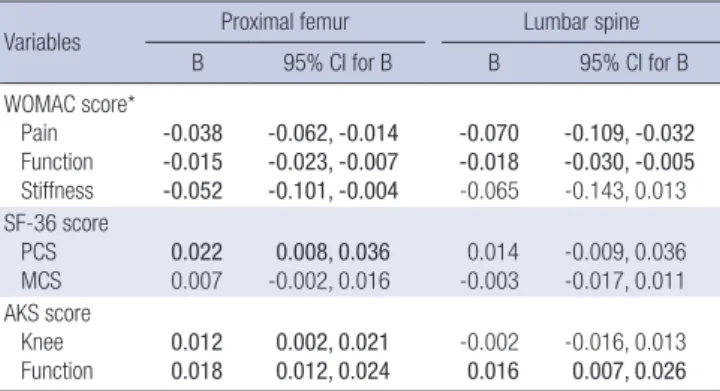
Table 6. The results of regression analyses to find relationships between the clinical status and the bone mineral density (BMD) T-scores in the pre-matched knee OA group
Variables Proximal femur Lumbar spine
B 95% CI for B B 95% CI for B
WOMAC score*
Pain Function Stiffness
-0.038 -0.015 -0.052
-0.062, -0.014 -0.023, -0.007 -0.101, -0.004
-0.070 -0.018 -0.065
-0.109, -0.032 -0.030, -0.005 -0.143, 0.013 SF-36 score
PCS
MCS 0.022
0.007 0.008, 0.036
-0.002, 0.016 0.014
-0.003 -0.009, 0.036 -0.017, 0.011 AKS score
Knee
Function 0.012
0.018 0.002, 0.021
0.012, 0.024 -0.002
0.016 -0.016, 0.013 0.007, 0.026 Statistical analysis was performed using multiple regression analyses with control of age and body mass index. Results with statistical significance (P value < 0.05) are in bold font. *Higher WOMAC scores represent poorer outcome. OA, Osteoarthritis; B, Regression coefficient; CI, Confidence Interval; WOMAC, Western Ontario and Mc- Master Universities Osteoarthritis Index; SF-36, Short Form-36; PCS, Physical Com- ponent Summary; MCS, Mental Component Summary; AKS, American Knee Society.
DISCLOSURE
The authors certify that they have no commercial associations that might pose a conflict of interest in connection with this ar- ticle.
ACKNOWLEDGEMENTS
The authors thank Soo Lim, MD, PhD, Hak Chul Jang, MD, PhD (Department of internal medicine, Seoul National University Bundang Hospital), and Ki Woong Kim, MD, PhD (Department of Neuropsychiatry, Seoul National University Bundang Hospi- tal) for their important contributions to this study. The authors also thank Sung Ju Kim, MS (Department of Statistics, Korea University) for his assistance with statistical analysis.
ORCID
Chong Bum Chang http://orcid.org/0000-0002-8597-1054 Tae Kyun Kim http://orcid.org/0000-0001-6345-4227 Yeon Gwi Kang http://orcid.org/0000-0002-3346-0068 Sang Cheol Seong http://orcid.org/0000-0003-0613-538X Seung-Baik Kang http://orcid.org/0000-0002-1184-4482
REFERENCES
1. Corti MC, Rigon C. Epidemiology of osteoarthritis: prevalence, risk fac- tors and functional impact. Aging Clin Exp Res 2003; 15: 359-63.
2. Dixon T, Shaw M, Ebrahim S, Dieppe P. Trends in hip and knee joint re- placement: socioeconomic inequalities and projections of need. Ann Rheum Dis 2004; 63: 825-30.
3. Wells VM, Hearn TC, McCaul KA, Anderton SM, Wigg AE, Graves SE.
Changing incidence of primary total hip arthroplasty and total knee ar- throplasty for primary osteoarthritis. J Arthroplasty 2002; 17: 267-73.
4. Felson DT, Zhang Y, Hannan MT, Naimark A, Weissman BN, Aliabadi P, Levy D. The incidence and natural history of knee osteoarthritis in the elderly. The Framingham Osteoarthritis Study. Arthritis Rheum 1995;
38: 1500-5.
5. Zhang Y, Xu L, Nevitt MC, Aliabadi P, Yu W, Qin M, Lui LY, Felson DT.
Comparison of the prevalence of knee osteoarthritis between the elderly Chinese population in Beijing and whites in the United States: The Bei- jing Osteoarthritis Study. Arthritis Rheum 2001; 44: 2065-71.
6. Atik OS, Gunal I, Korkusuz F. Burden of osteoporosis. Clin Orthop Relat Res 2006; 443: 19-24.
7. Payer J, Killinger Z, Sulková I, Celec P. Preferences of patients receiving bisphosphonates: how to influence the therapeutic adherence. Biomed Pharmacother 2008; 62: 122-4.
8. Hahn MH, Won YY. Bone mineral density changes after total knee re- placement in women over the age of 65. J Bone Metab 2013; 20: 105-9.
9. Labuda A, Papaioannou A, Pritchard J, Kennedy C, DeBeer J, Adachi JD. Prevalence of osteoporosis in osteoarthritic patients undergoing total hip or total knee arthroplasty. Arch Phys Med Rehabil 2008; 89: 2373-4.
10. Simonelli C, Killeen K, Mehle S, Swanson L. Barriers to osteoporosis iden-
tification and treatment among primary care physicians and orthopedic surgeons. Mayo Clin Proc 2002; 77: 334-8.
11. Sowers M, Lachance L, Jamadar D, Hochberg MC, Hollis B, Crutchfield M, Jannausch ML. The associations of bone mineral density and bone turnover markers with osteoarthritis of the hand and knee in pre- and perimenopausal women. Arthritis Rheum 1999; 42: 483-9.
12. Lethbridge-Cejku M, Tobin JD, Scott WW Jr, Reichle R, Roy TA, Plato CC, Hochberg MC. Axial and hip bone mineral density and radiograph- ic changes of osteoarthritis of the knee: data from the Baltimore Longitu- dinal Study of Aging. J Rheumatol 1996; 23: 1943-7.
13. Nevitt MC, Lane NE, Scott JC, Hochberg MC, Pressman AR, Genant HK, Cummings SR. Radiographic osteoarthritis of the hip and bone mineral density. The Study of Osteoporotic Fractures Research Group. Arthritis Rheum 1995; 38: 907-16.
14. Hart DJ, Mootoosamy I, Doyle DV, Spector TD. The relationship between osteoarthritis and osteoporosis in the general population: the Chingford Study. Ann Rheum Dis 1994; 53: 158-62.
15. Franklin J, Ingvarsson T, Englund M, Lohmander LS. Sex differences in the association between body mass index and total hip or knee joint re- placement resulting from osteoarthritis. Ann Rheum Dis 2009; 68: 536- 40.
16. Reijman M, Pols HA, Bergink AP, Hazes JM, Belo JN, Lievense AM, Bier- ma-Zeinstra SM. Body mass index associated with onset and progres- sion of osteoarthritis of the knee but not of the hip: the Rotterdam Study.
Ann Rheum Dis 2007; 66: 158-62.
17. Barrera G, Bunout D, Gattas V, de la Maza MP, Leiva L, Hirsch S. A high body mass index protects against femoral neck osteoporosis in healthy elderly subjects. Nutrition 2004; 20: 769-71.
18. Albala C, Yanez M, Devoto E, Sostin C, Zeballos L, Santos JL. Obesity as a protective factor for postmenopausal osteoporosis. Int J Obes Relat Metab Disord 1996; 20: 1027-32.
19. Petrella RJ, Jones TJ. Do patients receive recommended treatment of os- teoporosis following hip fracture in primary care? BMC Fam Pract 2006;
7: 31.
20. de Kam D, Smulders E, Weerdesteyn V, Smits-Engelsman BC. Exercise interventions to reduce fall-related fractures and their risk factors in in- dividuals with low bone density: a systematic review of randomized con- trolled trials. Osteoporos Int 2009; 20: 2111-25.
21. Lim S, Yoon JW, Choi SH, Park YJ, Lee JJ, Park JH, Lee SB, Kim KW, Lim JY, Kim YB, et al. Combined impact of adiponectin and retinol-binding protein 4 on metabolic syndrome in elderly people: the Korean Longitu- dinal Study on Health and Aging. Obesity (Silver Spring) 2010; 18: 826- 32.
22. Austin PC. A critical appraisal of propensity-score matching in the medi- cal literature between 1996 and 2003. Stat Med 2008; 27: 2037-49.
23. Stürmer T, Joshi M, Glynn RJ, Avorn J, Rothman KJ, Schneeweiss S. A review of the application of propensity score methods yielded increasing use, advantages in specific settings, but not substantially different esti- mates compared with conventional multivariable methods. J Clin Epi- demiol 2006; 59: 437-47.
24. Cui LH, Choi JS, Shin MH, Kweon SS, Park KS, Lee YH, Nam HS, Jeong SK, Im JS. Prevalence of osteoporosis and reference data for lumbar spine and hip bone mineral density in a Korean population. J Bone Miner Me- tab 2008; 26: 609-17.
25. Writing Group for the ISCD Position Development Conference. Posi-
tion statement: introduction, methods, and participants. The Writing Group for the International Society for Clinical Densitometry (ISCD) Position Development Conference. J Clin Densitom 2004; 7: 13-6.
26. Insall JN, Dorr LD, Scott RD, Scott WN. Rationale of the Knee Society clinical rating system. Clin Orthop Relat Res 1989; 248: 13-4.
27. Bellamy N, Buchanan WW, Goldsmith CH, Campbell J, Stitt LW. Vali- dation study of WOMAC: a health status instrument for measuring clini- cally important patient relevant outcomes to antirheumatic drug thera- py in patients with osteoarthritis of the hip or knee. J Rheumatol 1988;
15: 1833-40.
28. Ware JE Jr, Sherbourne CD. The MOS 36-item short-form health survey (SF-36). I. Conceptual framework and item selection. Med Care 1992;
30: 473-83.
29. Arden NK, Crozier S, Smith H, Anderson F, Edwards C, Raphael H, Coo- per C. Knee pain, knee osteoarthritis, and the risk of fracture. Arthritis Rheum 2006; 55: 610-5.
30. Bergink AP, van der Klift M, Hofman A, Verhaar JA, van Leeuwen JP, Uitterlinden AG, Pols HA. Osteoarthritis of the knee is associated with vertebral and nonvertebral fractures in the elderly: the Rotterdam Study.
Arthritis Rheum 2003; 49: 648-57.