INTRODUCTION
Research and development (R&D) can be classified into basic and applied research. Since there is little consensus on the definition of basic research, various standards have been adopted (1).
Although there is no internationally accepted definition of basic science, it is generally understood to involve the natural sciences, including some of the medical sciences. The Frascati Manual of the Organization for Economic Co-operation and Development (2) includes various definitions of basic research;
the best known of these defines it as experimental and theo- retical work that is conducted to obtain fundamental knowl- edge of observable facts and phenomena, without considering specific applications or uses. Basic research does not focus on a particular objective but on experimental and theoretical work with a view to devising new theories and extending knowl- edge in the basic sciences and engineering (3). The purpose of basic research is to obtain general knowledge and under- standing of a certain subject, without necessarily considering specific applications. From an industrial perspective, this
might be defined as not pertaining to specific, commercial knowledge, but as an enhancement of scientific knowledge (4).
The importance of basic research is increasing with the devel- opment of innovative knowledge, technological innovation, and knowledge-based industries; in addition, this kind of research fosters high-level science and engineering manpower.
There has been a call for increased cooperation among indus- tries, universities, and research institutes with regard to basic research in the medical sciences so that we can face the chal- lenges confronting us in the 21st Century. This kind of ap- proach requires an operating paradigm whereby academia faces no walls or boundaries, allowing internationalization and mobility among academics.
In particular, the importance of focusing university research on basic studies has increased under the National Innovation System. Appropriate research funding should be allocated to ensure commitment and achievement; in addition, the mode of funding is also important. Consequently, it is impor- tant to evaluate current research funding to universities, as funding that plays a crucial role in the medical sciences. This study evaluated research in the medical sciences through an
Tae-Sun Min, Jin Han*,
Seong-Yong Kim�, Byoung-Doo Rhee�, Myung-Suk Kim�
Korea Science and Engineering Foundation, Daejeon;
Mitochondrial Signaling Laboratory*, Department of Physiology and Biophysics, College of Medicine, Inje University, Busan; Korea Institute of Geoscience and Mineral Resources�, Daejeon; Department of Internal Medicine�, College of Medicine, Inje University, Busan;
Department of Physiology�, College of Medicine, The Catholic University of Korea, Seoul, Korea
Address for correspondence Tae-Sun Min, Ph.D.
Korea Science and Engineering Foundation (KOSEF), 180-1 Gajeong-dong, Yuseong-gu, Daejeon 305-350, Korea
Tel : +82.42-869-6531, Fax : +82.42-869-6641 E-mail : [email protected]
*This study was supported by the Staff Study Group Grants from the Korea Science and Engineering Foundation, Republic of Korea.
345
The Medical Science Research and Development Supported by the Korea Science and Engineering Foundation
This study examined ways of promoting research in the medical sciences by eval- uating trends in research funding, and the present status of research funding by the Korea Science and Engineering Foundation (KOSEF). This study analyzed statistics from KOSEF from 1978 to 2003 to examine support for research. In medical science field, group-based programs receive more funding than do individual-based programs.
The proportion of research funds allocated to the medical sciences has increased markedly each year. Researchers in the medical sciences have submitted more articles to Science Citation Index (SCI) journals than to non-SCI journals, relative to other fields.
Researchers supported by the Mission-Oriented Basic Grants program have pub- lished the majority of these papers, followed by those supported by the Programs for Leading Scientists, Regional Scientists, Leading Women Scientists, Young Sci- entists, and Promising Women Scientists, in that order. Funding by KOSEF reflects many decades of government support for research and development, the develop- ment and maintenance of necessary infrastructure, and the education and training of medical scientists.
Key Words : Research Support; Research; Biomedical Research; Research Activities; Korea
Received : 27 December 2004 Accepted : 4 April 2005
� SPECIAL ARTICLE �
analysis of funding in this field by the Korea Science and Engineering Foundation (KOSEF) by comparing funding in other research sectors over the past 26 yr and examining the number of sector-specific research tasks and funding allo- cations, the age and scholarship distribution of the research manpower in this field, and the number of their publications, as well as present alternatives for developing the most appro- priate research strategies and systems.
MATERIALS AND METHODS
This study analyzed statistics from the Korea Science and Engineering Foundation from 1978 to 2003 to examine support for research undertaken by individuals, including new professors, basic researchers, core-specific researchers, and by those involved in International Bank for Reconstruc- tion and Development (IBRD) loan-assisted projects, interna- tional cooperative research projects, and group/collective stud- ies, including Mission-Oriented Basic Grants (including high- end research projects), and projects for centers of excellence.
We examined support for training researchers, including scholarships for masters and doctoral candidates, overseas and domestic post-doctoral training, research infrastructure establishment projects, and operational support for special research material banks and special research information cen- ters. The statistical data do not agree with the annual accounts and project budgets of KOSEF; the statistical analysis only included support for research projects and not support for small-scale academic activities.
Since the research management system of KOSEF does not use a consistent classification system for the areas of research supported, we classified research projects into 15 categories and compiled basic statistics on each. The categories were aging and cancer, allergy and immunology, anatomy and cell biology, biochemistry and molecular biology, clinical sciences, clinical technology and methodology, genetics, hygienic chem- istry, neurosciences, pharmaceutics, pharmaceutical chemistry, physiology and pharmacology, public health and safety, and others. In many cases, it was not clear which category a re- search project fell into. Therefore, many projects were classi- fied as ‘‘other’’. For projects involving more than two resear- chers, we attempted to identify the interests of the chief re- searcher. All research funding was rounded off to the nearest thousand won and the data for the research team were pro- cessed using internal data from KOSEF.
RESULTS
Analysis of research funding trends in the medical sciences
In Korea, real national R&D started in 1978 with the estab- lishment of KOSEF. National R&D funds have grown con-
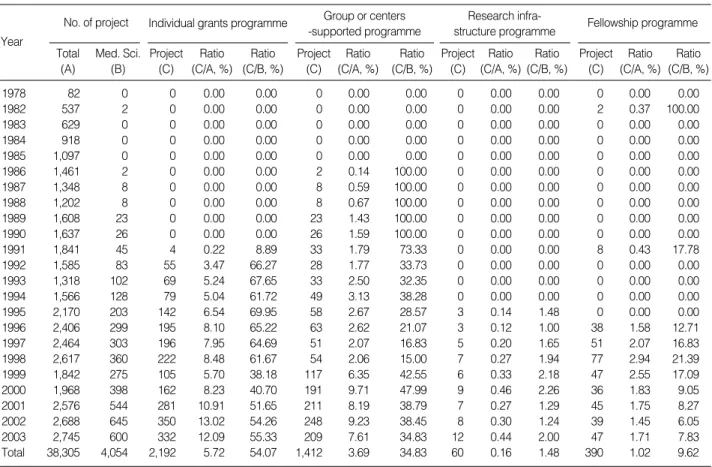
tinuously and reached a record 5.28 trillion won in 2003 (5). Between 1978 and 2003, KOSEF invested 129.54 bil- lion won in a total of 38,305 grants. Of this, 19.93 billion won went towards supporting 4,054 projects in the medical sciences. Over the period studied, the medical sciences received between 10.6 and 13.6% of the grant money each year. In 2003, KOSEF spent an estimated 4.25 billion won of its own funds on R&D in the medical sciences, providing 32.6% of the national total of 13.04 billion won (5).
From 1978 to 2003, the total number of projects increased by a factor of 33.5, and the corresponding research expenses increased by a factor of 695.6. For the medical sciences, in 2003, 600 projects (21.9% of the total) received 42.5 billion won (18.9% of the total) in grants, whereas no medical sci- ence projects were supported in 1978 (Table 1). In general, support for the medical sciences by KOSEF relative to the total number of projects has increased steadily in terms of both the number of projects and the level of funding since 1978.
In 1983/1984, no medical science projects received grants;
this gradually increased to 14.9-24.0% of projects and 11.4- 20.3% of total funds for 1999-2003 (Table 1). This parallels the increase in funding for medical sciences in the United States from 23.5-23.9% for 1975-1985 to 28.9-31.1% for 1998-2001. R&D in the U.S.A. has contributed to innovation and growth materially. Federal R&D funds have been espe-
Year
No. of Project Med. Sci.
(A)
Total (B)
Ratio (A/B, %)
Expenditure Med. Sci.
(A)
Total (B)
Ratio (A/B, %)
1978 0 82 0.0 0 322,400 0.0
1982 2 537 0.4 10,788 1,632,550 0.7
1983 0 629 0.0 0 2,133,010 0.0
1984 0 918 0.0 0 3,558,565 0.0
1985 0 1,097 0.0 0 5,134,633 0.0
1986 2 1,461 0.1 61,500 9,364,947 0.7
1987 8 1,348 0.6 231,000 11,142,596 2.1 1988 8 1,202 0.7 242,000 11,485,090 2.1 1989 23 1,608 1.4 740,000 14,416,002 5.1 1990 26 1,637 1.6 923,000 17,893,409 5.2 1991 45 1,841 2.4 1,639,760 28,492,656 5.8 1992 83 1,585 5.2 2,449,500 37,280,340 6.6 1993 102 1,318 7.7 3,101,200 37,564,963 8.3 1994 128 1,566 8.2 3,860,316 48,054,043 8.0 1995 203 2,170 9.4 6,592,328 67,033,035 9.8 1996 299 2,406 12.4 8,502,546 85,409,824 10.0 1997 303 2,464 12.3 9,761,790 102,699,447 9.5 1998 360 2,617 13.8 10,508,807 106,104,444 9.9 1999 275 1,842 14.9 13,191,006 115,946,728 11.4 2000 398 1,968 20.2 23,584,990 147,730,307 16.0 2001 544 2,576 21.1 30,251,547 184,250,951 16.4 2002 645 2,688 24.0 41,184,599 203,084,546 20.3 2003 600 2,745 21.9 42,477,224 224,271,064 18.9 Total 4,054 38,305 10.6 199,313,901 1,295,408,550 13.6 Table 1.Number of research projects and expenditures in med- ical sciences supported by the KOSEF
(Unit: Project, Thousand Korean Won)
cially important to the academic sector, which is the source of much of the nation’s basic research. Federal funds consti- tuted close to 60% of academic R&D expenditures over the past decade. The majority of expenditures for academic R&D in 2001 went to the life sciences, which accounted for 59%
of all academic R&D expenditures, 58% of Federal academic R&D expenditures, and 59% of non-Federal academic R&D expenditures. Within the life sciences, the medical sciences accounted for about 31% of academic R&D expenditures
and the biological sciences for about 18%. The next largest block of academic R&D expenditures went to engineering, with about 15% in 2001 (4, 6).
Analysis of research trends in the medical sciences by type
We examined support for individual research projects, group/collective research projects, research infrastructure,
Year
No. of project Total
(A)
Med. Sci.
(B)
Individual grants programme Project
(C)
Ratio (C/A, %)
Ratio (C/B, %)
Group or centers -supported programme Project
(C) Ratio (C/A, %)
Ratio (C/B, %)
Research infra- structure programme Project
(C) Ratio (C/A, %)
Ratio (C/B, %)
Fellowship programme Project
(C) Ratio (C/A, %)
Ratio (C/B, %)
1978 82 0 0 0.00 0.00 0 0.00 0.00 0 0.00 0.00 0 0.00 0.00
1982 537 2 0 0.00 0.00 0 0.00 0.00 0 0.00 0.00 2 0.37 100.00
1983 629 0 0 0.00 0.00 0 0.00 0.00 0 0.00 0.00 0 0.00 0.00
1984 918 0 0 0.00 0.00 0 0.00 0.00 0 0.00 0.00 0 0.00 0.00
1985 1,097 0 0 0.00 0.00 0 0.00 0.00 0 0.00 0.00 0 0.00 0.00
1986 1,461 2 0 0.00 0.00 2 0.14 100.00 0 0.00 0.00 0 0.00 0.00
1987 1,348 8 0 0.00 0.00 8 0.59 100.00 0 0.00 0.00 0 0.00 0.00
1988 1,202 8 0 0.00 0.00 8 0.67 100.00 0 0.00 0.00 0 0.00 0.00
1989 1,608 23 0 0.00 0.00 23 1.43 100.00 0 0.00 0.00 0 0.00 0.00
1990 1,637 26 0 0.00 0.00 26 1.59 100.00 0 0.00 0.00 0 0.00 0.00
1991 1,841 45 4 0.22 8.89 33 1.79 73.33 0 0.00 0.00 8 0.43 17.78
1992 1,585 83 55 3.47 66.27 28 1.77 33.73 0 0.00 0.00 0 0.00 0.00
1993 1,318 102 69 5.24 67.65 33 2.50 32.35 0 0.00 0.00 0 0.00 0.00
1994 1,566 128 79 5.04 61.72 49 3.13 38.28 0 0.00 0.00 0 0.00 0.00
1995 2,170 203 142 6.54 69.95 58 2.67 28.57 3 0.14 1.48 0 0.00 0.00
1996 2,406 299 195 8.10 65.22 63 2.62 21.07 3 0.12 1.00 38 1.58 12.71
1997 2,464 303 196 7.95 64.69 51 2.07 16.83 5 0.20 1.65 51 2.07 16.83
1998 2,617 360 222 8.48 61.67 54 2.06 15.00 7 0.27 1.94 77 2.94 21.39
1999 1,842 275 105 5.70 38.18 117 6.35 42.55 6 0.33 2.18 47 2.55 17.09
2000 1,968 398 162 8.23 40.70 191 9.71 47.99 9 0.46 2.26 36 1.83 9.05
2001 2,576 544 281 10.91 51.65 211 8.19 38.79 7 0.27 1.29 45 1.75 8.27
2002 2,688 645 350 13.02 54.26 248 9.23 38.45 8 0.30 1.24 39 1.45 6.05
2003 2,745 600 332 12.09 55.33 209 7.61 34.83 12 0.44 2.00 47 1.71 7.83
Total 38,305 4,054 2,192 5.72 54.07 1,412 3.69 34.83 60 0.16 1.48 390 1.02 9.62
Table 2.The number and properties of medical research projects by funding types from KOSEF (Unit: No. of project)
No.of project
700 650 600 550 500 450 400 350 300 250 200 150 100 50 0
78 82 83 84 85 86 87 88 89 90 91 92 93 94 95 96 97 98 99 00 01 02 03 Year
Fig. 1.Types of research programs supported by KOSEF, and the number of research projects in the medical sciences.
Fellowship programme
Research infra-structure programme Group or centers-supported programme Individual grants programme
and research manpower training. Of 4,054 programs in the medical sciences from 1978 to 2003, 2,192 (54.1%) were individual projects, 1,412 (34.8%) were group/collective research projects, 60 (1.5%) were research infrastructure pro- jects, and 390 (9.6%) were manpower training projects.
Before 1990, 70% of research involved group studies and few significant projects were initiated by individuals. By con-
trast, since 2000, only 35 to 48% of all medical science pro- jects involved group or center-supported programs. In 2003, 332 grants were for individual projects (55% of the total for medical sciences), whereas there were no such grants before 1990 (Table 2, Fig. 1).
Between 1978 and 2003, the medical sciences received 199.3 billion won in grants out of a total of 1,465 billion won (13.6%). Of this, 44.3 billion won (22.2%) went to individ-
Year
Grant amount
Total (A)
Med. Sci.
(B)
Individual grants programme
Group or centers -supported programme Amount
(C)
Research infra- structure programme
Ratio (C/A,
%) Ratio (C/B,
%) Ratio
(C/A,
%) Ratio (C/B,
%) Amount
(C) Ratio (C/A,
%) Ratio (C/B,
%)
Fellowship programme
Amount (C) Amount
(C)
Ratio (C/A,
%) Ratio (C/B,
%)
1978 322,400 0 0 0.00 0.00 0 0.00 0.00 0 0.00 0.00 0 0.00 0.00
1982 1,632,550 10,788 0 0.00 0.00 0 0.00 0.00 0 0.00 0.00 10,788 0.66 100.00
1983 2,133,010 0 0 0.00 0.00 0 0.00 0.00 0 0.00 0.00 0 0.00 0.00
1984 3,558,565 0 0 0.00 0.00 0 0.00 0.00 0 0.00 0.00 0 0.00 0.00
1985 5,134,633 0 0 0.00 0.00 0 0.00 0.00 0 0.00 0.00 0 0.00 0.00
1986 9,364,947 61,500 0 0.00 0.00 61,500 0.66 100.00 0 0.00 0.00 0 0.00 0.00
1987 11,142,596 231,000 0 0.00 0.00 231,000 2.07 100.00 0 0.00 0.00 0 0.00 0.00
1988 11,485,090 242,000 0 0.00 0.00 242,000 2.11 100.00 0 0.00 0.00 0 0.00 0.00
1989 14,416,002 740,000 0 0.00 0.00 740,000 5.13 100.00 0 0.00 0.00 0 0.00 0.00
1990 17,893,409 923,000 0 0.00 0.00 923,000 5.16 100.00 0 0.00 0.00 0 0.00 0.00
1991 28,492,656 1,639,760 61,000 0.21 3.72 1,563,000 5.49 95.32 0 0.00 0.00 15,760 0.06 0.96 1992 37,280,340 2,449,500 421,000 1.13 17.19 2,028,500 5.44 82.81 0 0.00 0.00 0 0.00 0.00 1993 37,564,963 3,101,200 548,700 1.46 17.69 2,552,500 6.79 82.31 0 0.00 0.00 0 0.00 0.00 1994 48,054,043 3,860,316 879,716 1.83 22.79 2,980,600 6.20 77.21 0 0.00 0.00 0 0.00 0.00 1995 67,033,035 6,592,328 1,784,368 2.66 27.07 4,354,960 6.50 66.06 453,000 0.68 6.87 0 0.00 0.00 1996 85,409,824 8,502,546 2,525,060 2.96 29.70 5,135,700 6.01 60.40 300,000 0.35 3.53 541,786 0.63 6.37 1997 102,699,447 9,761,790 3,067,790 2.99 31.43 5,248,980 5.11 53.77 580,000 0.56 5.94 865,020 0.84 8.86 1998 106,104,444 10,508,807 3,211,120 3.03 30.56 5,609,300 5.29 53.38 693,000 0.65 6.59 995,387 0.94 9.47 1999 115,946,728 13,191,006 1,502,790 1.30 11.39 9,577,000 8.26 72.60 1,450,000 1.25 10.99 661,216 0.57 5.01 2000 147,730,307 23,584,990 4,407,830 2.98 18.69 17,674,979 11.96 74.94 888,000 0.60 3.77 614,181 0.42 2.60 2001 184,250,951 30,251,547 6,621,920 3.59 21.89 22,231,000 12.07 73.49 958,000 0.52 3.17 440,627 0.24 1.46 2002 203,084,546 41,184,599 8,624,500 4.25 20.94 30,889,000 15.21 75.00 832,000 0.41 2.02 839,099 0.41 2.04 2003 224,271,064 42,477,224 10,647,853 4.75 25.07 29,917,000 13.34 70.43 1,272,000 0.57 2.99 640,371 0.29 1.51 Total 1,465,005,550 199,313,901 44,303,647 3.02 22.23 141,960,019 9.69 71.22 7,426,000 0.51 3.73 5,624,235 0.38 2.82 Table 3.The medical research expenditures by funding types from KOSEF (Unit: Thousand Korean Won)
Average grants per project (Constant thousand Won) 100,000
75,000
50,000
25,000
0
1975 1980 1985 1990 1995 2000 2005 Year
Fig. 2.Research expenditure per project in the medical sciences (*Grants amounts: Datus of Individual Grants Program and Group or Centers-supported Programme).
Total
Medical Sciences
Average grants per project (Constant thousand Won) 35,000 28,000 21,000 14,000 7,000 0
1975 1980 1985 1990 1995 2000 2005 Year
Fig. 3.Individual research grants per project in the medical sci- ences (Grants amounts: Datus of Individual Grants Program).
Total
Medical Sciences
ual research programs, 142.0 billion won (71.2%) went to group research, 74.3 billion won (3.7%) went to research infrastructure programs, and 56.2 billion won (2.8%) went to manpower training programs (Table 3).
Unit cost analysis of medical science research programs
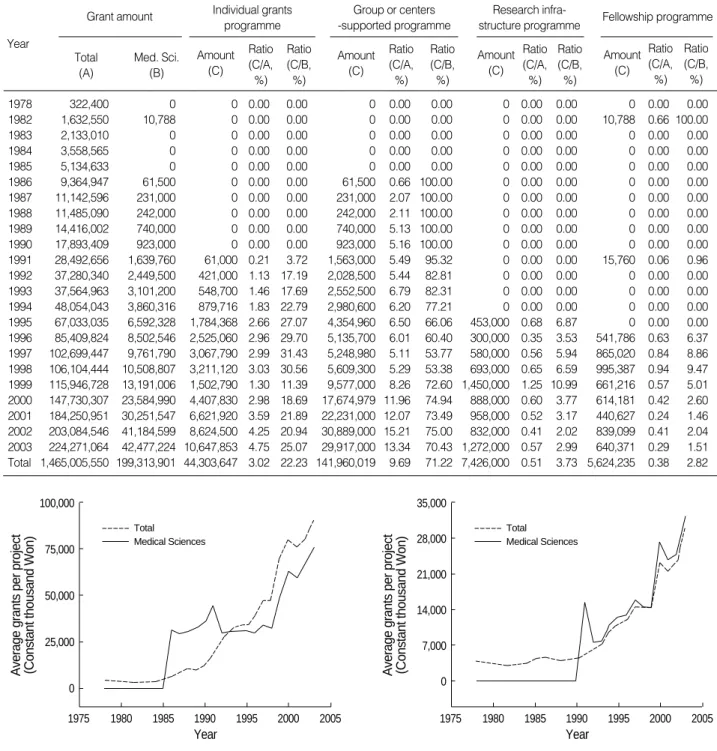
The total number of projects supported by KOSEF has in- creased every year, especially in the medical sciences. Research funding per project reached 90 million won in 2003.
Since 1978 the average amount of support in the medical
sciences has remained low compared with other fields. Even in 2003 it amounted to only 75 million won, 83.5% of the average investment of 90 million won per other project (Fig.
2). The average amount of the Korean Research Foundation (KRF) support in the medical sciences area showed the same phenomenon, as represented by KOSEF (7).
Based on a constant price index, in the 16-yr period (1978- 1993), the average amount granted per project to support the research programs of individuals almost doubled, from 3.9 to 7.3 million won. In the medical sciences, there are no records for before 1990, and support has gradually increased to date. This period can be regarded as a time of supporting wider fields of research. With the budget increases from the government and the implementation of the Science Research Center/Engineering Research Center (SRC/ERC), unit sup- port has increased sharply since 1991.
This trend was a little sluggish in 1999, but improved in 2000 following both the transfer of core special research pro- jects to the Ministry of Education (MOE) and the introduc- tion of a new individual-support program for regional uni- versity scientists (25 million won), leading scientists (100 million won), and female scientists (25 million for the most promising and 40 million for excellence).
As of 2003, the unit support amount averaged 30 million won overall and 32.1 million won in the medical sciences, whereas the annual average amount per project for the peri- od 1978 through 2003 was 20 million won for the medical
Sub-field 61-
Male Female Average
age (yr)
56-60 Male Female
51-55 Male Female
46-50 Male Female
41-45 Male Female
36-40 Male Female
-35
Male Female Male Female Total
Total Ratio
Clinica Sciences 47 42 2 63 3 116 13 200 21 282 47 178 49 27 21 908 156 1,064 23.7
Clinical 48 10 10 13 19 29 27 48 56 55 44 26 20 5 15 186 191 377 8.4
Technology &
Methodology
Anatomy & 45 12 0 17 1 19 2 44 9 86 20 48 16 19 12 245 60 305 6.8
Cell Biology
Aging & Cancer 45 5 0 7 2 31 7 70 10 85 29 62 25 9 12 269 85 354 7.9
Biochemistry & 44 22 5 26 7 54 7 147 31 181 34 124 32 54 31 608 147 755 16.8
Molecular Biology
Genetics 45 6 1 8 3 11 1 32 6 45 7 28 7 17 6 147 31 178 4.0
Allergy & 44 5 0 6 3 13 0 42 12 62 16 47 16 14 13 189 60 249 5.5
Immunology
Neurosciences 44 12 0 15 0 19 2 82 11 115 19 77 21 30 14 350 67 417 9.3
Physiology & 45 13 1 10 2 34 2 41 10 67 14 45 13 18 11 228 53 281 6.3
Pharmacology
Pharmaceutical 48 4 1 3 2 6 1 9 0 11 4 8 6 4 0 45 14 59 1.3
Chemistry
Pharmacognosy 46 9 0 9 2 5 5 20 4 25 6 14 8 11 7 93 32 125 2.8
Pharmaceutics 45 4 1 3 0 1 0 9 1 13 4 1 6 4 2 35 14 49 1.1
Hygienic Chemistry 47 4 0 3 1 5 1 5 2 8 4 6 1 3 2 34 11 45 1.0
Public Health & 46 11 3 17 1 26 5 36 11 51 9 34 17 7 9 182 55 237 5.3
Safety
Medical Sciences 46 159 24 200 46 369 73 785 184 1,086 257 698 237 222 155 3,519 976 4,495 100.0 Total
Table 4.Manpower in medical sciences in Korea (Unit: Headcount, %)
*Source, amended from KOSEF Manpower DB (2004).
Output of research publications
Non-SCI Manpower Ratio
SCI Manpower Ratio
Total Manpower Ratio
0-5 9,670 21.5 35,535 79.2 7,012 15.6
6-10 7,287 16.2 3,623 8.1 6,900 15.4
11-20 10,025 22.3 3,174 7.1 9,942 22.2
21-30 5,842 13.0 1,193 2.7 6,215 13.8
31-40 3,465 7.7 590 1.3 3,922 8.7
41-50 2,268 5.1 295 0.7 2,653 5.9
51-60 1,449 3.2 177 0.4 1,940 4.3
61-70 1,065 2.4 102 0.2 1,259 2.8
71- 3,804 8.5 186 0.4 5,032 11.2
Total 44,875 100.0 44,875 100.0 44,875 100.0 Table 5.Output of research publications by the researchers regis- tered in KOSEF Manpower database (Unit: Headcount, %)
*Source, amended from KOSEF Manpower DB (2004).
sciences and 11.6 million won for other fields (Fig. 3). The average total research expense (29,827 thousand won) per project in the individual-support program in all fields in 2003 was 146% that of similar funding (Grants for provincial uni- versities, newly-appointed professors and leading researchers) from KRF (8) during the same period. Such a rapid increase in the amount of support per project has played an important role in improving the stability of the research environment for basic science research programs by enhancing the quality and training of competent research manpower.
Analysis of research manpower and number of publica- tions in the medical sciences sector
KOSEF constructed a research manpower database in the mid 1980s, based on data relating to research grantees and evaluations of project participants, for the systematic man- agement of those who had performed and were capable of performing such research. This system was improved in 2000 by allowing data to be updated by the researchers themselves every two years. Accordingly, it cannot be regarded as the
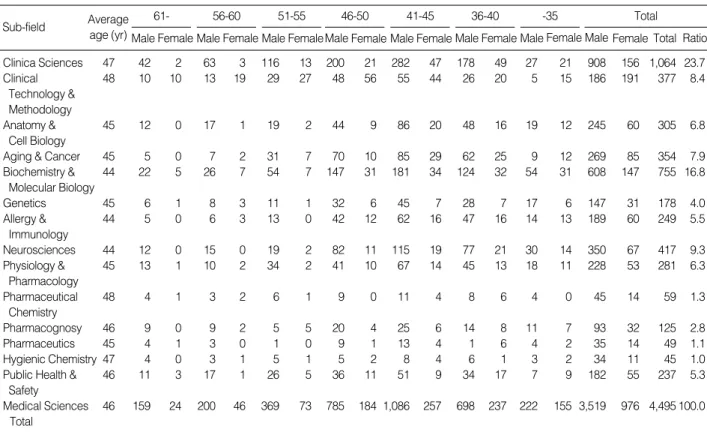
latest data on manpower. Based on the 20,186 researchers who have input their area code out of the total 44,875 reg- istered on the database as of May 2004, the number of research personnel in the medical sciences was 4,495 (22.3%).
By sector, there are 1,064 researchers (23.7%) in the clinical sciences, 377 (8.4%) in clinical technology & methodology, 305 (6.8%) in anatomy & cell biology, 354 (7.9%) in aging
& cancer, 755 (16.8%) in biochemistry & molecular biology, 1,778 (4.0%) in genetics, 249 (5.5%) in allergy & immunol- ogy, 417 (9.3%) in neuroscience, 281 (6.3%) in physiology
& pharmacology, 59 (1.3%) in pharmaceutical chemistry, 125 (2.8%) in pharmacognosy, 49 (1.1%) in pharmaceutics, 45 (1.0%) in hygienic chemistry, and 237 (5.3%) in public health & safety. Among researchers involved in the medical sciences, the youngest average age was 44 yr, in biochemistry and molecular biology, allergy and immunology and neuro- science, while the oldest average age, 48 yr, was in clinical technology and methodology and pharmaceutical chemistry.
Male researchers overwhelmingly dominated with respect to numbers: only 22% of researchers were female (Table 4).
We investigated the number of papers published by KOSEF
Output of research publica- tions
Journal type
Clini- cal Sci-
ences Clinical Techno- logy &
Metho- dology
Anato- my &
Cell Bio- logy
Aging
&
Cancer Bio- chemi-
stry &
Mole- cular Biology
Gene- tics
Aller- gy &
Immu- nology
Neu- roscie nces
Physi- ology
&
Phar- macol ogy
Phar- mace utical Chemi
stry Phar- maco gnosy
Phar- mace utics
Hygie nic Chemi
stry Public Health
&
Safety
Medical Sciences Total
Man- power Ratio
0-5 Non-SCI 86 21 55 36 193 40 60 72 33 15 14 11 6 25 667 14.9
SCI 761 298 118 173 235 68 77 186 110 18 65 22 27 187 2,345 52.3
Total 58 17 14 13 46 8 17 32 11 4 6 5 4 21 256 5.7
6-10 Non-SCI 95 35 28 42 98 28 27 42 21 8 12 6 4 27 473 10.6
SCI 114 31 54 74 161 40 55 78 48 7 12 8 7 26 715 16.0
Total 94 28 22 29 83 22 20 33 18 3 8 5 1 18 384 8.6
11-20 Non-SCI 219 82 62 61 150 34 35 85 59 15 20 4 13 50 889 19.8
SCI 107 21 66 55 191 46 67 88 66 17 31 12 7 15 789 17.6
Total 195 76 54 69 138 43 40 67 42 7 17 7 12 51 818 18.3
21-30 Non-SCI 159 71 41 51 101 17 37 52 38 6 19 4 8 34 638 14.2
SCI 44 13 34 26 97 15 26 34 23 6 7 3 2 4 334 7.5
Total 147 66 41 48 127 19 38 73 36 9 15 6 11 30 666 14.9
31-40 Non-SCI 130 41 33 39 64 18 23 39 24 6 22 5 1 37 482 10.8
SCI 17 2 16 10 40 8 15 17 16 5 2 2 1 2 153 3.4
Total 129 49 45 35 95 25 34 41 32 10 24 3 2 31 555 12.4
41-50 Non-SCI 80 39 26 18 44 9 15 30 19 5 10 4 2 15 316 7.1
SCI 7 5 7 5 11 0 8 9 4 0 3 1 0 0 60 1.3
Total 88 34 28 27 60 12 18 37 25 9 10 2 3 23 376 8.4
51-60 Non-SCI 69 19 14 16 24 10 14 17 20 1 5 1 4 15 229 5.1
SCI 3 2 5 3 6 1 2 3 5 3 3 1 0 1 38 0.8
Total 65 20 24 25 58 15 23 27 19 7 9 5 3 16 316 7.1
61-70 Non-SCI 43 14 10 23 19 7 10 14 10 1 3 4 2 9 169 3.8
SCI 0 1 2 5 4 1 1 1 0 2 0 0 0 0 17 0.4
Total 54 15 19 15 34 7 11 16 19 3 8 4 2 16 223 5.0
71- Non-SCI 178 51 35 68 60 16 30 68 53 2 19 10 4 23 617 13.8
SCI 6 0 2 3 8 0 0 3 5 1 1 0 0 0 29 0.6
Total 229 68 57 93 112 28 50 93 75 7 27 12 6 29 886 19.8
Table 6.Output of research publications by medical science researchers registered in KOSEF Manpower DB (Unit: Headcount, %)
*Source, amended from KOSEF Manpower DB (2004).
researchers in terms of 1) the number of papers published in general academic journals not listed in the Science Citation Index (SCI; hereinafter referred to as ‘‘number of non-SCI papers’’), 2) the number of papers published in SCI academic journals (hereinafter referred to as ‘‘number of SCI papers’’) and 3) total number of papers published including 1) and 2) (hereinafter referred to as ‘‘total number of papers’’). The non- SCI paper statistics show that among 44,875 researchers, most (10,025, 22.3%) had published 11-20 papers, while 8.5%
(3,804) had published more than 70. For SCI papers, 35,535 researchers (79.2%) had published less than 5 papers, and 186 (0.4%) had published more than 70. In total, the num- bers were 11-20 papers (9,942 persons, 22.2%), >0-5 papers (7,012 persons, 15.6%), >6-10 papers (6,900 persons, 15.4%),
>21-30 papers (6,215 persons, 13.8%), >over 70 papers (5,032 persons, 11.2%) (Table 5).
We investigated the publication status of researchers in the medical sciences based on the above statistics. The number of non-SCI papers published was quite uniformly distribut- ed, with 889 researchers (19.8%) publishing 11 to 20 papers, followed by 667 (14.9%) who published 0 to 5 papers. For SCI-papers, most (2,345, 52.3%) were by researchers who
published 0-5 papers, while 789 (17.6%) were by researchers who published 11-20 papers, and only 29 researchers (0.9%) published more than 70 papers. Based on the total numbers of papers, the order was as follows: over 70 (886, 19.8%), >
11-20 (818, 18.3%), >21-30 (666, 14.9%), >31-40 (555, 12.4
%), >6-10 (384, 8.6%), >41-50 (376, 8.4%), >51-60 (316, 7.1%), >0-5 (256, 5.7%), >61-70 (223, 5.0%) (Table 6).
Analysis of papers listed by researchers selected for KOSEF projects
Researchers selected for Mission-Oriented Basic Grants, which support excellence in small research groups, published an average of 48 papers in non-SCI journals in the most recent 5-yr period, and averaged 15 papers in SCI journals. The team leaders of Mission-Oriented Basic Grants are outstanding researchers who have led and conducted research for an aver- age of three years, and who have participated actively in the activities of academic societies, in addition to contributing frequently to SCI journals.
Researchers in the program for Leading Scientists, which was implemented to further motivate scientists, foster world-
Program SCI Total Non-SCI,
recent 5 yr
SCI, recent 5 yr
Total, recent 5 yr Non-SCI
Program for Leading Women Scientists 33 15 50 20 12 32
Program for Promising Women Scientists 17 11 28 13 9 23
Program for Young Scientists 15 14 29 12 12 24
Program for Regional Scientists 42 14 59 26 11 38
Program for Leading Scientists 45 27 72 17 21 39
Mission-oriented Basic Grants 48 21 70 26 15 41
Table 7.Average output of research publications by researchers given grants in medical sciences by program (FYs 2002-2003) (Unit: Project)
Field 2001
Amount Distribution, %
1980 1985 1990 1995 2000
1975
Sciences 3,027 5,200 8,268 13,630 18,650 25,494 27,725 84.7
Physical sciences 350 677 1,148 1,807 2,255 2,708 2,800 8.6
Mathematics 40 78 128 222 279 341 357 1.1
Computer sciences 46 124 281 515 682 875 954 2.9
Earth, atmospheric, and ocean sciences 255 508 705 1,069 1,433 1,763 1,827 5.6
Life sciences 1,900 3,218 5,279 8,725 12,186 17,460 19,190 58.6
Agricultural sciences, amount 384 676 999 1,349 1,814 2,175 2,318 7.1
(Agricultural sciences, ratio, %) 11.3 11.2 10.3 8.3 8.2 7.2 7.1 7.1
Biological sciences 630 1,028 1,781 2,859 3,834 5,613 5,944 18.2
Medical sciences 811 1,423 2,318 4,154 6,070 8,986 10,177 31.1
Other 75 91 181 363 468 686 751 2.3
Psychololgy 80 110 158 253 370 516 582 1.8
Social sciences 256 339 383 703 1,019 1,297 1,436 4.4
Other sciences 100 146 186 336 426 534 579 1.8
Engineering 381 862 1,418 2,656 3,515 4,547 5,000 15.3
Total 3,408 6,062 9,686 16,286 22,165 30,041 32,725 100.0
Table 8.Expenditure for academic R&D in U.S.A. (Unit: Millions of current dollars)
*Source: National Science Foundation, 2004, Science & Engineering Indicators 2004, v2. A5-9~A5-11.
leading scientists, and widen Korea’s capacity for basic science to a world-class level, published an average of 27 papers in SCI journals, and over the most recent 5-yr period averaged 21 publications in SCI journals. This is the highest number of any SCI sector.
Researchers in the Program for Promising Women Scien- tists and the program for Young Scientists have published fewer articles in each sector, as compared to other programs.
However, since the selected researchers published an average of 28 and 29 papers each in 2002 and 2003, respectively, and in the most recent 5-yr period averaged a total of 23 and 24 papers each, it is clear that recent performance has improved markedly (Table 7).
Analysis of research funding in the major advanced coun- tries
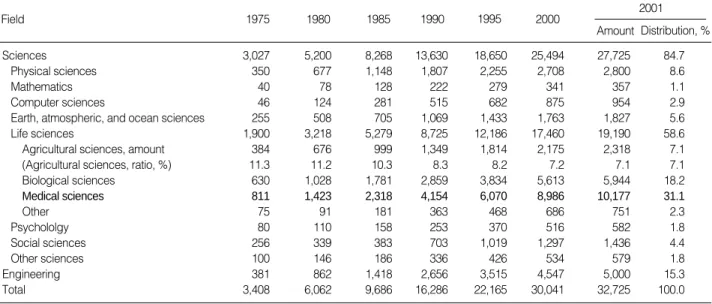
Analysis of academic funding in the USA shows that of a total of 32.7 billion dollars (2001 basis), 31.1% or 2.3 billion dollars were allocated to the medical sciences and 58.6% or 19.2 billion dollars were allocated to all the life sciences, in- cluding agricultural science, biology, and others. The increasing trend, evident in annual figures for the medical sciences of 0.811 billion dollars in 1975, 2.318 billion dollars in 1985, 4.154 billion dollars in 1990 and 10.177 billion dollars in 2001, roughly corresponds to the case analyzed in this paper (Table 8).
DISCUSSION
From an economic applications perspective, derived from basic research, it has been reported that government invest- ment in basic research provides returns to society and makes a crucial contribution to economic growth. Moreover, a per- centage of the increase in sales by companies results from taking advantage of university research. Basic research pro- vides society with practical information, new forms of mech- anization and methodologies, trained manpower, a system- atic organizational structure based on expertise and techno- logical solutions to problems, and leads to the creation of new companies (9).
As a result of the importance of basic research, research spending has been the fastest growing item in the national budget. However, the medical sciences will inevitably require longer-term and more stable investment than is offered to other fields. Stable opportunities for academic and research jobs, in comparison with other fields, will prevent the brain drain of promising new researchers and graduates. It will be necessary to establish a plan to strengthen our research com- petitiveness in order to entice our brightest minds to return to Korea and occupy positions of leadership in society, as well as in research institutes. This may be effected, in part, by devel- oping new inter-disciplinary studies in the life sciences. In
addition, we must acknowledge the external threats created by grouping specific university graduates.
In this study we analyzed both the strengths and weaknesses of the internal environment for research in the medical sci- ences, as well as the opportunities offered and threats posed by the external environment surrounding the medical sci- ences, in relation to other academic fields. As compared to other fields, the major strengths of the medical sciences lies in their research manpower, the advanced level of their research facilities, and research and technological capabilities that are not far behind those of the most advanced countries.
Concerning weaknesses in this area, first, relatively little attention has been paid to strengthening relationships between different academic fields or to generating new inter-disci- plinary areas; this is because the relevant societies and research institutes have failed to assume a leadership role in this respect.
Second, researchers’ preferences for the medical sciences have led to limited research manpower being available for other fields. Third, the distribution of research endeavor on the part of universities has not diversified and has, instead, been grouped according to specific university background. Fourth, few government officials, such as ministers and vice-ministers, are qualified to take part in the decision-making process in this field, as compared to other areas, such as the social sci- ences, physics, chemistry, agriculture and fisheries, and engi- neering. Furthermore, opportunities for these officials to do so have been considerably limited.
As for the opportunities offered by the external environ- ment, increasing emphasis has been placed on medical research and there has been increased interest in biotechnology. In addition, many international cooperative research projects are presently underway, thanks to the relatively small gap in capabilities, even in relation to the most advanced countries.
Finally, the biotechnology industry is still at a primitive stage and many areas in this field remain to be explored.
In contrast, the external environment can pose a threat in that creative and stable long-term research activities pertain- ing to basic research in the medical sciences, with relatively long recovery periods, have not been implemented smoothly by the investment of research funds in such visible areas as the 10 Growth Propulsion Power and The National Tech- nology Guidance projects.
Research trends in the medical sciences by the type of programme
Around 1990, many large-scale research programs emerged owing to the influence of research in advanced countries. These started with the awarding of group Mission-Oriented Basic Grants, which gave rise to SRC/ERC in February 1990 and inter-disciplinary cooperative research projects. Subsequently, the proportion of funds supporting individual projects and manpower training programs has increased gradually. Sup- port for research in the medical sciences has improved steadily
since 1986, thanks to the Research Support Project for Spe- cialization Encouragement, which was initiated in 1995.
For the sciences in general, support for group research ver- sus individual research has grown rapidly since 2000. With this increase in group research has come an increased aware- ness of the benefits of inter-disciplinary co-operative research.
Programs supporting group research, such as SRC/ERC, Regional Research Center, Medical Research Center, and local university-based research support, play a significant role in enhancing the national level of capability with respect to science technology. For these projects to be successful there must be a sound framework that allows individual researchers at universities and institutes to conduct creative, ongoing projects. Fundamental research in various fields is necessary to meet the needs of a rapidly changing society, and to boost its capability to incorporate future technology. As support has tended to focus on group research, it has become more difficult for individual researchers not involved in groups to undertake research. For this reason, we need to construct a stronger base for basic research.
Comparing the rate of successful applications to the National Science Foundation of the United States (NSF) and the KRF, in 2003, the NSF awarded 10,844 grants in response to a total of 40,075 applications (27%), while in 2003 the KRF awarded 2,433 grants in response to 9,523 applicants (23%).
For specific programs sponsored by the KOSEF, the success rate was even lower: 11% for programs supporting research scientists (63 out of 589), 11% for those fostering leading scientists (25 out of 176), and 22% for the program promot- ing excellence among scientists in regional universities (361 out of 1,656). Furthermore, the rate of support for new pro- jects has decreased each year since 2002: it was 39% in 2002 (932 of 2,380), 26% in 2003 (1,002 of 3,844), and 20% in 2004 (738 of 3,867). In this regard, inter-departmental com- petition for group research program grants has been severe.
Consequently, the funds available to individuals have been greatly limited, and the support for young scientists is decreas- ing. Therefore, when designing group research programs, it is necessary to establish a solid national support program, as a part of the National Millennium Plan, through extensive evaluation of the expertise available, after considering the opinions of scientists.
In part, the lower proportion of grants for individual research programs, compared to group research programs in Table 3, occurred because the average unit research cost of group re- search is considerably higher than that of other programs.
More attention should be paid not only to increasing the unit cost, but also to enlarging support for individuals, infrastruc- ture, and manpower training programs in order to improve the research environment.
There was considerable support for individual programs up to the late 1980s. Beginning in the 1990s, grants favored group research or center-supported programs, and this trend continued until 2003. The reason for this decline in support
for individual programs was that group research had an advan- tage in terms of increased output of publications, both qual- itatively and quantitatively (10, 11), while fewer research activities were available to researchers who were not invited into large-scale projects. However, even among individual projects, it is not easy to conclude that giving large amounts of money to a few projects increases output, as compared to giving small amounts to numerous projects. Moreover, it has been suggested that group research does not result in out- put of a quality that is equivalent to that from individuals (10, 11). A slight increase in the rate of grants to individual projects (25.1%) in 2003 might be regarded as an appropri- ate measure to counter these problems.
Our research support system can be described as an invert- ed triangle. There was a severe imbalance in the amounts granted in 2001, as only 11% was invested in infrastructure supporting individual and group/collective projects, which were deemed a focus, whereas 37% went to specific research areas, and 52% was poured into special tasks that were initi- ated nationally. Researchers in charge of infra-research account- ed for 15% of the researchers receiving grants. High-level researchers at SRCs/ERCs accounted for 40% (10). Theoret- ically, the ideal situation occurs when at least 70% goes to individual-oriented tasks, 20-30% to collective research in specific areas by medium-sized groups, with the balance going to special nationally designated large-scale research projects.
In the U.S.A. in 2002, most of the university R&D funds, about 74%, were invested in basic research comprised mainly of projects undertaken by individuals, whereas applied research received 22% and R&D 4% (7)
From this perspective, it appears highly advisable to review policy on national R&D projects and research budget allo- cation. Conversely, coverage by the manpower-training pro- gram increased between 1995 and 1999, but then decreased following the discontinuance of the domestic post-doc train- ing program and the curtailment of foreign post-doc train- ing programs as a result of the Korean financial crisis in 1997.
Certain measures are needed to enhance the quality of the next generation of researchers in the medical sciences.
Unit cost trends in the medical sciences
Research funding per project has increased every year, as seen in Table 4, thanks to the implementation of Mission- Oriented Basic Grants in 1987 and the SRC/ERC program in 1990. Although less than the NSF average of $135,609 per research project in 2003 (4), it is much more than the sum of approximately 47 million won that was provided by the Korea Research Foundation under the MOE and Human Resources Development (8), and it can be regarded as an appropriate amount in terms of the average amount vs. the per capita gross national product (GNP). The report by the MOE stating that the average R&D expense of 40 million won per university staff in 2003 was 25% (8 million won) higher