gt+qqhJS+q 7(1 xj1153 4]38(2005* 12%) J Korean Soc Occup Environ Hyg 2005;15(3):16@165
(HCHO) ~flsq 434 451
l-%q%7)9 714 937)
Evaluation of Indoor Air Quality Improvenlent by Formaldehyde Emission Rate in School Indoor Environment Using Mass Balance
Won-Ho Yangt . Bu-Soon Son1)
.
Dae-Won Kim2).
Young-Hee Kim . Jae-Cheol Byeon . Soon-won Jungl)Department of Occupational Health, Catholic University of Daegu .
"Department of Environmental Health Science, Soonchyunhyang University . Z'Department of Environmental Science, Catholic University of Daegu .
Schools have significant and serious indoor environmental health problem, of which indoor air quality (IAQ) in school building may affect the health of the students and indirectly affect learning performance. Schools are of special concern when regarding indoor exposure to air pollutants, because students are particularly sensitive to pollutants and spend a significant amount of time in that environment. Therefore researches for improvement of indoor air quality have been developed such as installation of air cleaning device, ventilation system, titanium dioxide(X02) coating and
soon. However, it is cult to evaluate the magnitude of improvement of indoor air quality in field study because indoor air quality can be affected by source generation, outdoor air level, ventilation, decay by reaction, temperature, humidity, mixing condition and
soon.
In this study, evaluation of reduction of formaldehyde emission rate in school indoor environments by far-Infixed ray
coating material was carried out using mass balance model in indoor environment. we proposed the evaluation method of magnitude of improvement in indoor air quality, considering outdoor level and ventilation. Since simple indoor concentration measuements could not properly evaluate the indoor air quality, outdoor level and ventilation should be considered when evaluate the indoor air quality.
Key Words
:school, indoor air quality, evaluation,
forrnaldehyde(HCHO), ventilation
4 gLH37I P $ % E 7 F + 4 q q 44 dil719goz 9 @ 941 9 sk2q ;F 3 4720dskS 833
+ 9 q(Jones, 1999).
q-qqqq Z 5 5 q A J q - q
3%'6FAJgS 44pF 344 47$!g$
6)
%Ad@
A17171~ 1 5 4 1 2aq
4 6 1 + A @ 97492-61q 33 A J $ q q + g % 3 4 q 4 2 q i l
9 O E z 3 4 4 4 q g - q $ + 4 + UHP e + i q ( e + g 5,
2003). 6 1 4 % q i z a g q 8 % 9 4 q q g ? - H + I ~ + ! o ~ 23 PI-g
?-Hz ~ ) # q + ~Hsz+~j +4-lg
$61
! g A J $ q . 614@ % g z %
2 g
$Jq]
-111 5( f o r m a l d e h y d e :
HCHO
), 4
!g+
71 ]3 (volatile
organic compunds: VOCs)
,4
y!5
619 0 q , A$%! k!*J7174lAj 9- A J q k +471& 5 4 ]q-4 96) % A J $ ~ .
61HCHO+ -g
q q 9414 gqaq ~z
g71E4 a* 241 z \ % ( $ % , 714% W 7 F % > $ ?!St. 4
$24 HCHO41 k % q q 2, a , q , q+g z \ q z \ q , 8 4 4 1 ;F yll9 + 9q. H a 3 0 5 5 9 4 g $ q 3 q 9% 90715 %?$
z 9 4 4 4 q-l/-dq+ %W' s
$(Group 2 A ) z g G q 3 9 O q ,
% 5 7 F ulB
271W 4 1 d7-11 4 gq zl q
8 7 1S o l +-+ 3 a+- ,3441 3GiiFZ1] q q a7d-
41 1 1 s
~1317l1q q q A J 5 6 1 f
5% a&%)? 5 h j q z 9 ~ 3
(New School Building Syndrome:
NSBS) g q o l q E # q 3 sr;F(&
$^? +5,2004).
qz 4q5713q q @ 5 7 % 44 qqg +4oz q0,tg 9 771 + s J W %di. 01240F dil q 3 q rAj$+4]Aj
3 A ) gVOCS
% r + sJ$ 433k267 g / m 3 % E# 4 2 uj (Fantuzzi et a1 .
,1996)
,Daiseyeta1.(2003)$ 3 k 3 4 l A j h1.g
7 3 3 4*4 q s il $ r q
HCHOk$ 7)9~-jg
J L ~ L Z ) ~ ~ . EE@zg& q3 3 4 44571
?$
4 u+ S 8
7J4 q Ad (Meininghaus, 2003), g q q 3 3 4 q 4q371
3 q q 4 1 qs 4 4 5 $71
(Rosen and Richardson, 1999
), 9 3
3)3 4 l A j g$g@ 337141 4s
3$54 COz %r(LeeandChang,2000)
s 2 3 z ) + 5 q q . q 4 o s q-3 3 4 4 q 5 7 ] g q 575
q A J g 0 1
441pF ;T14q A/%%+
01
% ~ 2 @
A] 7141 9Onz 3-4 qqoz %Q@ 9749-6171 q eqq (q'&+!, 1911.
qzagq q 4 2 4q 8 3 % Q-371 +lq 4141 6c1E51 LFq"11."1
+ 199 % g q q 0 ) 3 4 7 1 8 % 3 4 q - 1 ~ 4 1 u+q 33 513 % O q , ?-jgz)q q 4 4 g q @ q k @ q ?gQ$471 g+ 33 9 q . + + - + q q l A j r 4 2 'qzxdq"7H34) qq 3 4 4
~ H I A J ~ I W 4 1 71414 ~ ~
8 7 1 ~ 1 4 %
6 ] # @93 $ 5 4
8 7 1 %
%)SF %)3 97.1
D,F
01 7 1 5 %
Q-+%)+q3+
7-l4 $5 4301q.
g $l?$ q~~gg(rernode1ing)
@
% q k g q q g q 4 q % b g 7
$ @ 35q-3 ~ ~ j g g z f l + j o ~ HCHO xl]q# 3 4 4 3
*JA)3 9
""2
o)#%)q HCHO !g~J$q
x z z
7,Fh 3 2 s 442713 Q941
4-1q-q
5$j7)Z)5g q q .
61g 71*J%& 4~437144 4 4 % ~ 2
9 7 15 q 0 d 3 k g g g 3 4 @ 3 0 s q 3 3 4 4 q g q 39 61 q
hfl4 q 3 (Sick House
-- -
g+g : m g 49 49, >(qg : m g
9 9 1297 i z 4 x j 4 : Ojga(g+ 8 3 ~ 1
-~;FO~%r;H1-7FWr;Hq~ 36d~zjqq
Tel: 053-85@3739, Fax: 053-W3736, E-mail, [email protected])
Syndrome: SHS
) i+ @ 014 + a 9
Aj ! g A J q + 3 7 ] 9 $ 3 $
q e& 3lg g7\g + 9 3 VJgg 4193 + ;I$ g01q.
a . g p g y
q%F+rq 4313 A % q z q q y . g g + q q 4 q q 7 4 1 4%)
@
B x % q 3 q
h ] ] g4 q%%
7~ ~ ~ j g g q g O z $ 4 4
+j
v J h \ g g q 3g41 ol]@ HCHO
HI$% 7,Fh 32s 3% &!$'i;F
9 q . g $l'Fq."l dil* 3 4 s 4E$g%)71 3 ( 4 4 3 F 7"d
a ) , q E 3 g @ S ( 4 4 3 ?q S ) , 3 4 3 2.443
* J h ) g 33 % 8 7-FZF 3 4 4441Aj 27H
q z l q A ] s , 3 4 4q
3 7 11 3 4 ) A j HCHOS +$ F , SAl 8
71
8 % +3i;F9q. A 5 3 k 3 qq 4 4 414s 230m3, B 3 5 5 ) ~ 5
~jaq 414s 2 6 5 m 3 0 z +JGq 2q.
H C H O ~ A J S g & 4 ] 0OJg~l a g g s g g 2 g z ) q a+$bqg
@ 3 + A ] 7 ] 3
ggq q q x 1 3 9 3
+L%\+
* q q x ] g g 4 4 g s
DF
L = q
s01E q941 2 . q q + j % v J h \ g q 9 % 27)s YA'i3'Fk
$x)q g%*Jq)q Ad"?% tl)yq 414 QE+&G gAd]gozq
HCHOS 3q40z 3 q g + 9
5 71%% 71x12 41
0406650, % q 3 , 2 0 0 3 ) . q 4 q 3
* J h ) g 3 &
q*OZ g?i?l)Aj (cornpressor)g 01#%)q A + q 3 41 A j 5 q Q g g @ q-gq g q o ]
Zz)717 xgg, q 5 4 7
3£q41 3 g % ) g 3 , B iL5q34'.1 5 4 4 g q q - xgq 3 g q 9 q . 43713& 20059 1 3 - 2 3
59 + B 4 % q .
X ~ ~ L I ] % ~ S ( H C H O ) ~
~ l s 3 I )4 2 8 3 q - 4 443713 % 3 A ]
g*Jqq 2zl-q +gz)%q(8?!
,"-, 2004). Fig. 1 4 g o ) 4 4 5 3
g ,
% k g5%
7fl*J%)iJ 01h,Fq g 3 0 3 019 ;i]+2 q , 9l79 7lsF g 4 2 7fl?+(%BFa, $9
g , g7]7 5)s 5 4 3
o]aF9
f- 9 1 449l $714 ol%% *J
43 B 3 5 4 q 9 q .
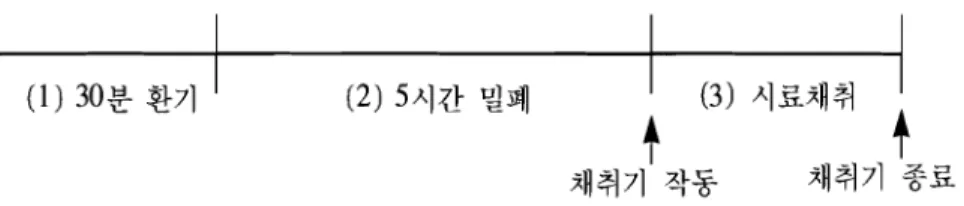
( 2 ) HCHO $ 3 2 2 4 44*71 +6]) P x l % ) k e g g q 1
%]G
% E g
+33\7]4 3
A ] %p J q 0 3 + % q % 4 4 8 3 9 4 q4i+ E A j 9 q A j q q 1000 mL/minq + g o 1 30% +$9 jI)
#%)q 2 , 4 - q q K Z 4 ] $ % ] S ~ + 3 (2,4 -DNPH
;2,4-dinitrophenylhydrazine, Supelco, USA) 2 3 + 5 41 4 9 $ ,
01
2,4-DNPH + ~ q J ] g X J j + q 41 Z Z ~ \ E Z ~ ~ ( H p L C l o l l f 9 4 q zpq$-&%7;1571q
&$-.I+%360nmol]Aj d $ q k 3 1 ~ ~ 5 . 1 ~
4 q2qs
2xg.gq]%]"q +x
g =?z)9q. 4S4 g y a7Fzl d"L2.3 % f d O q , 442713 S B A ] ~ ~ g MOSH2016pJQ$
3 s z \ d r ] g y g % q ( p a q - , 2W,iuIOSH,2003j.
A ] S ~3.~0)
41 E q
01 E3
(acetonitrile ql
01 -$q +??jg%q. +8 -$qS 2 mP
~ ) 0 ]
9 4) q , HPLC/UV4 360 nmqlAj % Y l i i F % q . % % S
C8(150mm x 3.9mm x 5 vm) q.1F 2
%2 ol-$z)%q. 01%ab+ 4-4
E q o l g g i q e G $ = g 4 5 5 5 4
-1183 gg9 -$qg o]-$z)%0
q , ++P 1.5 rnt/min03
+xli3'F9q. gyA1
A 1 S? 3 %
$
20
'do12 q .
717)T g ! . s l ; - ' g
$
Table 1 4 @ q . 9$j-$q$
2,4-DNPH ?j$gg~j]%]S
s$j-$j-q (100 ppm, Supelco, USA)$
6)41Eq~JggZ q y 4 q
01%~ ) 9 ~ + . 0 . 0 6 - 3 . 8 5 p p m @ q q 471
% s + 2 0 2 4 1 3 % k % O q , 7-F '"'4 35s o1-$*q 4 3 4
$ 74 83% q A d % \ 2 1 q .
( 3 )
8 7 13 93
8
7-719s
f4
7)."(tracer gas) g
01-$z\q 4% 9 8 % $= 2 q . 3 7 qaF9 A +TLyJ q T F 4 2 B
iJ++qa r A j a q ~ 7 1 . 1 ~ q 4
71414
@-713!X17F35271 4 l F q 1
q 3 ~ 1 3 8 7 1 9 pxNz)2 302 a ) q % q . 3 3 7 o l l A - l 9 HCHO$;ZI $
+ A ]Co2%$j7F
."s 014j-%)q q q 4 CQ % E 7 )
Fig. 1. Sampling process for formaldehyde in schoolroom.
Table 1. lnstrwmen t and a.nafysis condition for HCHO concentration Instrument HPLC (Waters 2690)
UV Detector ( W a t e ~ 2487), 360 nm
Column C8(Symme&y HPLC column), Reversed-phase Effluent Acetonitn1e:DW
=4555
Flow rate 1.5 nla/min Injection Volume 20 fit
",t 1500ppmol) ~ 3 3 % rrH C02 9
$ 7 ) & g
~ Z ] A ] ~ ) Z5 g u \ q C02
g % r g +$qq qqgq C02 3 ~ 7 ) O,t m p p m 3~611 o ] s @
g3g % z ] q % q . C02
937\h g h )4 g
g h \% q F a n 6 q S
o]-$z);F6Cl A+$Vii!q i$'6;F4 g B i l 5 q - a q s A j g % q7-F @ a $ g(completemixing) abqz 330 q C02 % s 7 F 63 1500ppmq
0 1 s@ F a n g 3 ~ 1 ~ 1 7 1 3 6$ l o g B q q C02 +ss 43i3'F%i~, 9 3 4 9 s data-loggerq 4
4%02 z j " b F q r g z ) % q . C02
% r g + j P lpoint41Aj s)%Oq i+q-44 E A j 3 +$!"11Aj q7-F
5 3 4 9 q .
8 7 1 %%i-;z)$ f ?
7 ) 5
% E g k q 0 3 qI;rl*Jq (regression method
)3 o] -$q q 2
718
713 +(Air Change per Hour; ACH) S Al+iiF%di("2+!3 5, 2000).
cc] 71
Aj , Ci=indoor concentration (fig / m'
), Co= outdoor concentration (fl g/m3), I=air exchange per hour (hr-I), SER=sourceemissionrate(g/hr), R=
removal rate ( B / h
) ,V
=volume of the space (m') , t =time
(hr
), and m
=mixing factor (0 <m
51
).
4 ( 1 1 4 4 44 $71P$S"?
q g & g (R)
$g - & + + ( K , hr-'
)4 (21% 4 ( 1 ) 4 ] ~Hgga dil
9 4 q z 7 , t q ~ j 9 8 . g ~ ~
(completely mixed condition, m= 1
)g
7l-48\'3, 4 (11% qg4-
2 0 1+ ( 3 1 0 3 L F ~ % 9 aq.
4 4 2 7 1 3 ! z g q ] ~ j HCHO4
% 5 7 \
g 9 g t l l J ( t = a ) 4 ] ~ 3 9 rrH A17,tql qs %E @*+ 3 + J F
3)-q(dCi/dt=O)jz 7\49 9 92 nl, H a 0 9 4 3 9 4148% 3 5 3 ( K : = O ) - s z
?A\%\fil7\44 '3 HChO
Gl Id,c 4g (source emissio~
rate:SEK)-s y-$q @ q .
SER --VI(Ci 40) (4 1
III. g T g q 2 23
1.1
) , j
,Cz, :Indoor HCHO ma ar?Ooc. Tr: meanmmtemperallure(~), CT :
nleasuredindm HCHO m n t m t i o n
Table 1. bstrumen t and a.nalysis condition for HCHO concentration Sample site
Outdoor
4.1Before 0.130 0.002
remodeling Indoor 7.3 (R2=0.954
)Indoor
After remodehg
Outdoor Indoor Indoor
1 day after coating
Outdoor Indoor Indoor
-
Mmisq of Education
(Japan 1
: 0.08ppm
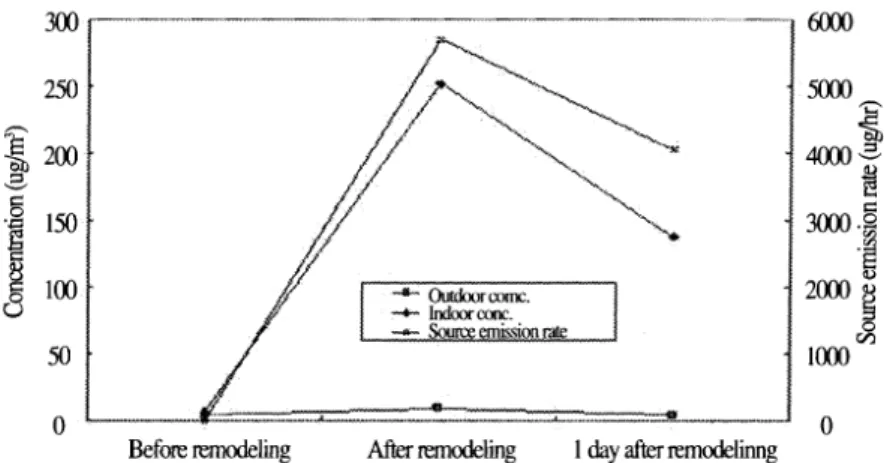
S E R S 3341.39 g / h r S 2Afi);FFd
3 ,
2 9 , 3 9 $6115 q q 2811.12 g / h r , 2130.20 g / h r O z A] +q
0e 7,~a + t q s
L F ~ L H61% ~ ~ .q7-F 12.8%, 26.6%, 44.4% 4
$i&4$ L F q 4 l 2 q . ?!-@ 44%3 4 l A ) + % @ 44 HCHO
%I;*298olJ 36.5 @ / m 3 9 * e , 3 9
$5 51.9
@/m3,51.7 K/m3, 42.45
@ / m 3 C j Z Q ' i i l q q 2 33%4 5 7 F g 8 x@+.
612s"rk B 5q
a q A j 4 ~ ~ 9 3 i+qaq 3%
Q+
~)37\4e 4 4 S 7 1 4 q7F
*J%A) +jq57]4
8 7 ] $ $ &$-5
A1 i l 4 4 q @& q-qg 3 q q .
0 Before remodehg After remodeling 1 day after remodehg-1
0Fig. 2. Comparison be tween indoor HCHO concentrations and source emission rates of HCHO.
4% q * q *
BJA\3q+k42
O Beforenew desk Afternew desk 1 day after 2dayafter 3day after Oo]-$z)q HCHO !g~J$q. 7 , F k 4
installation instalIation coating coating coating5s
+j4%71"?Z P ~ 4 % ~ Fig. 3. Comparison between indoor HCHO concentrations and
% 7 \ 5 ) 3 d r . 341 W$-'6FollA-l 4 4 source em ission rates of HCHO.
Table 3. Source emission rate of HCHO in library with new purchased desk sampling
. . . . . . . . . . . . . . . . . . . . . . . . . . . . . . . . . . . . . . . . . . . . . . . . . . . . . . . . . . . . . . . . . . . . . . , . . . . . . . . . . . . . . . . . . , . . . . . . . , . .
Conc. ACH SER
sampling Sample site i l h ) (&I Standard
ipdm3
Before Outdoor
new desk Indoor
installation Indoor
After Outdoor 7.0 0.49
-Mitustry of
new desk Indoor 3830.58
(R2=0.99
)Environment
mtdation Indoor 36.5 (Korea 1
1 day Outdoor 5.2 : 0.lppm
0.27
after Indoor 3341.39
51.9 (Rd.89)
coating Indoor
-Ministry of
2 d a ~ Outdoor 7.5 0.24 Education
after Indoor 2811.12
(R'9.95
)(Japan 1
coating Indoor 51.7 : 0.08ppm
3 day Outdoor 7.5 0.23
after Indoor 2130.20
coating 42.45 (R2=0.97
)Indoor
REFERENCES
q%q. qizgg. @qq-izgaq-q
~1 1991;4: 31-38 kxa
wj A r p1 - 0 I - O L ,
4?3g9
7d$q93
$9, elm, w f .
A ~ Q A ~9
;?- 5)xq 44 2714 zhi 2 9 4 %
327).q@qAJqqX]
2003;18(3):101-110
oJqa.4q27) 1 $ g $ q kg
" -
A3347).q@f q2ht
fg 4 4 0 0
q g ~ ] 2003;79:1(n-117
O~+e,qgf, 61719, 3 s a . 48
A I ~ , F ~ I
rdrs i - f f q q -17126
A13 1%41 a@ 97. @qg
$ ~ A J % L ~ x ]
2000;26(3):50-54
$*4,4~19, ol%Q, @I-%+, ",F
f-9. +-qz+h]+jq 421 2 4L# .4q41 qE Zsgrj]%]S
%LE @3+.