1. INTRODUCTION
The health system in developing countries has changed drastically in the last few years from a paper-based system to a computerized system.
Therefore, medical data has been storing in the better way than the past, which helps managers to be able to conduct and develop their facilities and hospital easier. Health Information System (HIS) is an advanced information system that be able to connect to technological devices such as
smart phone, wearable devices [1] in order to as- sists physicians, nurses and other medical staffs to work more effectively in the attempt to improve the quality of healthcare services.
With big data growth in biomedical and health- care communities, accurate analysis of medical da- ta benefits early disease detection, patient care, and community services [2]. In developing countries, healthcare managers used only data for storing, basic statistic and looking back when they need.
Currently, the massive amount of data on the pa-
Unsupervised Outpatients Clustering: A Case Study in Avissawella Base Hospital, Sri Lanka
Huu-Trung Hoang†, Quoc-Viet Pham††, Jung Eon Kim†††, Hoon Kim††††, Junseok Park†††††, Won-Joo Hwang††††††
ABSTRACT
Nowadays, Electronic Medical Record (EMR) has just implemented at few hospitals for Outpatient Department (OPD). OPD is the diversified data, it includes demographic and diseases of patient, so it need to be clustered in order to explore the hidden rules and the relationship of data types of patient's information. In this paper, we propose a novel approach for unsupervised clustering of patient's demographic and diseases in OPD. Firstly, we collect data from a hospital at OPD. Then, we preprocess and transform data by using powerful techniques such as standardization, label encoder, and categorical encoder. After obtaining transformed data, we use some strong experiments, techniques, and evaluation to select the best number of clusters and best clustering algorithm. In addition, we use some tests and measurements to analyze and evaluate cluster tendency, models, and algorithms. Finally, we obtain the results to analyze and discover new knowledge, meanings, and rules. Clusters that are found out in this research provide knowledge to medical managers and doctors. From these information, they can improve the patient management methods, patient arrangement methods, and doctor’s ability. In addition, it is a reference for medical data scientist to mine OPD dataset.
Key words: Clustering, Developing Countries, EMR, Healthcare, Outpatient Department, Unsupervised Learning.
※ Corresponding Author : Won-Joo Hwang, Address:
197 Injero, Gimhae, Gyeongnam 50834, South Korea, TEL : +82-55-320-3847, FAX : +82-55-322-6275, E-mail : [email protected]
Receipt date : Nov. 22, 2018, Revision date : Mar. 19, 2019 Approval date : Mar. 26, 2019
††Dept. of Information and Communication System, Inje University (E-mail: [email protected])
††ICT Convergence Center, Changwon National University (E-mail: [email protected])
††††††Dept. of Emergency Medicine, Inje University, Ilsan Paik Hospital (E-mail: [email protected])
††††††Dept. of Emergency Medicine, Inje University, Ilsan Paik Hospital (E-mail: [email protected])
††††††Dept. of Emergency Medicine, Inje University, Ilsan Paik Hospital (E-mail: [email protected])
††††††Dept. of Information and Communication System, Inje University
tient is not exploited properly, which is a wasteful use of resources. Actually, this massive data can be used to improve healthcare services in hospital.
Data science is growing and changing the world quickly, especially machine learning and deep learning. However, the application of these modern techniques is mainly carried out in developed countries. If these techniques are used in develop- ing countries, it helps to discover the huge amount of left knowledge. Therefore, the urgent need is now to apply data science to analyze data at OPD in order to explore the knowledge and hidden rules in the dataset.
To implement this research, we collected data from Avissawella Base Hospital (ABH). ABH is a base hospital in Western Province, Sri Lanka, ap- proximately 59 km east of the capital Colombo. Dr.
Aruna Jayathilaka, Medical Superintend of the Hospital stated that in OPD, beyond 1000 patients are being care everyday. In Fig. 1, when we came to work here, we took some pictures and remarked that although established a long time ago, the hos- pital had still used paper to store medical data. This caused the lack of storage space, prone to damage, inefficient document transportation, and so on.
From this situation, we implemented Hospital Health Information Management System (HHIMS) in ABH. We analyzed and researched ABH's sit- uation and developed EMR for ABH based on HHIMS (This was developed by ICTA of Sri Lanka
- Information and Communication Technology of Sri Lanka). OPD module was deployed at ABH and since then whole data have been storing in HHIMS.
After using HHIMS, the number of OPD daily pa- tient is around 1000 and they had exceeded 50000 electronic patient registered in the database in a span of 7 months [3]. In Fig. 2, after using HHIMS, we took some pictures and we can see that ABH managers and doctors could retrieve data more easily at anytime.
However, if we only use this system for storing data, this is wasteful because we can use this data for mining knowledge. In developed countries, they use EMRs, and handheld, wearable and smart de- vices to collect and storage data, thus they have many types of data to be able to predict disease from other features with high correlation between disease and other attributes (symptoms, indexes and so on) [2,4,5]. In ABH and other hospitals in developing countries, they only can collect mainly primitive data such as demographic and disease, and encounter the difficulty in collecting intensive data. These features do not correlate each other, so we can not use these attributes to predict dis- ease or future. Therefore, with this problem, we can use this dataset to cluster these data to various groups.
Data served for this research were collected from 01st April 2014 to 31st March 2015, it includes 119,535 records. There are many tables and col-
Fig. 1. Information management situation of ABH before using HHIMS.
Fig. 2. Information management situation of ABH after using HHIMS.
umns in the database but we only used 6 attributes for this research because they are appropriate for our goals and their data ability are good for transformation. Other attributes were removed be- cause ethical and legal reasons, such as IDs, ad- dresses, phone numbers and so on. In addition, we eliminated data with the following attributes: a) at- tributes that were unknown and not used by the doctors at the time of examination, b) attributes that were unfilled in every instance of the database, c) irrelevant attributes. Finally, we selected 6 fol- lowing features:
In summary, we propose in this paper a un- supervised clustering approach for OPD based on patient’s demographic and diseases in developing countries. Our main contributions can be listed as follows:
- We propose existing techniques to preprocess and transform dataset in order to obtain transformed data for the experiment.
- We use cluster tendency analysis to make sure that the dataset can be divided into natural subsets.
- We propose existing solid methods to select the best number of clusters for clustering. We implement different algorithms with the in- ternal validation in order to compare and eval- uate their performance. From the obtained re- sult, we can select the best algorithm for our problem.
- We obtain the results of clustering and get some knowledge and interpretation of data of OPD.
2. APPROACH
In this section, we propose a comprehensive ap- proach to perform the unsupervised clustering of outpatient in ABH, it is showed in Fig. 3. After transforming data in the previous section, we ana- lyze cluster tendency to answer the question "Is it advisable to cluster our data?". Next, we find the optimal number of cluster assessment. After that, we select the best clustering algorithm to find an appropriate algorithm for ABH dataset. Finally, we analyze and interpret results of clustering.
3. PERFORMANCE EVALUATION
3.1. Data Transformation
3.1.1. Transforming Numerical Attribute
In ABH dataset, only Age is the numerical at- tribute. To transform this attribute, we use stand- ardization method. Unlike min-max scaling, stand- ardization does not bound values to a specific range, which may be a problem for some algo- rithms (for example, neural networks often expect
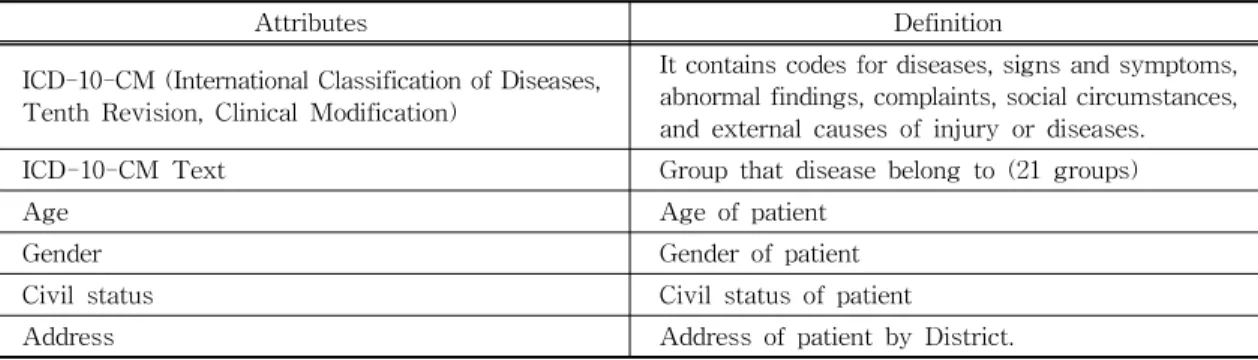
Table 1. Attributes were selected from dataset
Attributes Definition
ICD-10-CM (International Classification of Diseases, Tenth Revision, Clinical Modification)
It contains codes for diseases, signs and symptoms, abnormal findings, complaints, social circumstances, and external causes of injury or diseases.
ICD-10-CM Text Group that disease belong to (21 groups)
Age Age of patient
Gender Gender of patient
Civil status Civil status of patient
Address Address of patient by District.
Fig. 3. Approach of unsupervised clustering of Outpa- tiens.
an input value ranging from 0 to 1). However, standardization is much less affected by outliers.
Min-max scaling would then crush all the other values from 0-15 down to 0-0.15, whereas stand- ardization would not be affected [6]. That why we choose this method to transform Age attribute.
3.1.2. Transforming Text and Categorical Attributes In ABH dataset, we have 5 text and categorical attributes including ICD-10-CM Code, ICD-10- CM Text, Gender, Civil Status and District. These features are not the numerical attribute so we have to convert them to numerical attributes. To do it, we use either Categorical Encoder or Label Encoder.
Prior to the method selection, we need to review the number of different categories in each attribute:
- Gender has two categories including Male and Female;
- Civil Status has four categories;
- District has 25 categories;
- ICD-10-CM Text has 21 categories;
- ICD-10-CM Code has 329 categories.
From those above statistics, we can see that all of attributes have countable categories, so we should use Label Encoder to transform these fea- tures. However, one issue with this method is that Machine Learning algorithms will assume that two nearby values are more similar than two distant values. Obviously, this is not the case. For exam- ple, the civil status has four categories included single, married, widow and divorced. The first at- tribute single is assigned to 0 and the last attribute divorced is assigned to 3. It means category 0 and 1 are more similar than category 0 and 2. To solve this issue, we should use Categorical Encoder.
After transforming these attributes by Categorical Encoder, there are 2 new attributes from original Gender attribute, 4 new attributes from original Civil Status attribute, 21 new attributes from origi- nal ICD-10-CM Text attribute, 25 new attributes from original District attribute and 329 new attrib- utes from original ICD-10-CM Code attribute.
However, although ICD-10-CM Code attribute is the countable categories but it created too many new attributes in the dataset (329), this uses up tons of memory mostly to store zeros, which would be very wasteful. Therefore, instead of using this method, we should use Label Encoder for this issue. Although there are many codes in ICD-10- CM, it just belongs to 21 categories (ICD-10-CM Text), so two nearby values are also more correla- tive than two distant values. Therefore, Label En- coder is appropriate for ICD-10-CM Code attribute.
After transforming ICD-10-CM Code attribute by Label Encoder, we used Standardization method to standardize this feature that was transformed.
3.2 Cluster Tendency Analysis
Analyzing cluster tendency is really important in the clustering task so that during this analysis, we try to figure out that the dataset can be divided into natural subsets. Indeed, a clustering that is ap- plied to a dataset, without naturally occurring clus- ters, will impose artificial and meaningless struc- ture [7]. This test measures the probability that the dataset has a uniform distribution. Hopkins checks the spatial randomness of variables as distributed in a space [8].
We perform the Hopkins test to check the cluster tendency in the ABH dataset. The value of ABH dataset equal to 0.997. Therefore, it showed that ABH data is highly clusterable as its value is far away from the threshold 0.5.
3.3 Best Number of Clusters Assessment Determining the number of clusters in a dataset is one of the most important steps for the success of clustering. It has the great impact on clustering accuracy, not only because some clustering techni- ques like partitioning methods require the number of clusters as a prior knowledge about the data, but also because the appropriate number of clusters determines the proper granularity of cluster analy-
sis [9]. Its assessment can be regarded as finding a good balance between compressibility and accu- racy in cluster analysis. Finding the right number of clutters depends strongly on the characteristics of the dataset [8]. There are several methods to estimate the best number of clusters such as the Elbow method [10] and the average Silhouette method [11]. In this research, we use the Elbow method and the average Silhouette method to find the best number of cluster for ABH dataset.
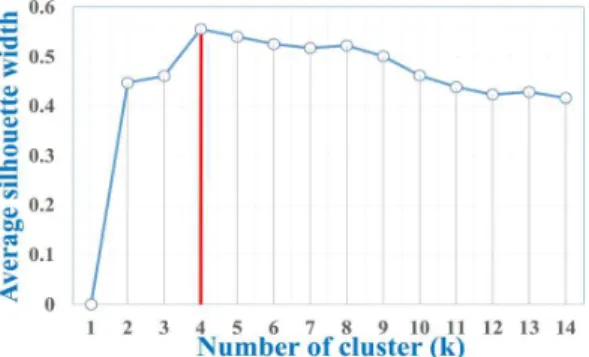
In Fig. 4, x-axis is the number of cluster, y- axis is the total within sum of square (WSS). In Fig. 5, x-axis is the number of cluster, y-axis is the average silhouette width, we provide a sum- mary explanation about this method in next chap- ter 3.4. Fig. 4 and Fig. 5 show that the best number of clusters is 4 using the Elbow method and Average Silhouette method. In conclusion, four is the number of clusters that was suggested and confirmed by two experiments.
3.4 Best Clustering Algorithm Selection
One of the biggest issue with cluster analysis is that the clustering process performance depends on the features of the dataset. Thus, it is very hard to select which algorithm would be the most suit- able for a certain dataset. In this research, we try
some practical analysis to select the most suitable clustering algorithm that fits the ABH dataset. We associate the validation results with the clustering algorithm results to choose the best clustering al- gorithm for ABH dataset.
Countable measurements that are applied to judge various aspects of cluster validity are classi- fied into the following two types: Internal vali- dation and external validations. Internal validation measures only the dataset and clustering partitions as input. It uses essential information in the data to evaluate the quality of the clustering. Otherwise, external validation measures the extent to which cluster labels match externally supplied class labels.
In this paper, we select internal clustering vali- dation because internal validation measures only rely on the intrinsic structure of the dataset with- out the need for any external knowledge about the dataset. Moreover, in the absence of a ground truth regarding the clusters (unsupervised learning) we cannot rely on external validation measures [8].
The two common parameters that measure in- ternal properties of the cluster validity are com- pactness and separation [12]. Compactness meas- ures to which extent the objects in the same cluster are similar whereas separation measures to which extent objects in different clusters are dissimilar.
A good clustering will create clusters with high compactness and separation.
Connectivity index [13], average silhouette width [11], and Dunn index [14] are three common meth- Fig. 4. Best number of clusters using Elbow method.
Fig. 5. Best number of clusters using Elbow method.
ods employed to measure the compactness and separation of any clustering technique [15]. We pro- vide a summary explanation of these three measures.
Connectivity index
This measure comes from graph theory. It takes into account the graph structure of the dataset. It measures to which extent objects are joint in the same cluster as their nearest neighbor in the data space. Thus, the connectivity index range is from zero to infinity and gets its minimum value when all the clusters are connected and well-separated as well [15]. Therefore, it should be minimized.
Average silhouette width
This measure is based on the difference between the distances an object has to other objects in the same cluster and the distance it has to other objects in other clusters. For object in a cluster
, the silhouette width is defined as:
max
where
min
≠
min
The silhouette width range is from -1 to 1, where a good clustering algorithm has a value close to 1 and the bad clustering algorithm has a value close to -1.
Dunn index
The Dunn method provides a score based on the square root of the minimum distance between any two clusters (m in, measuring separation) divided by the square root of the maximum distance be- tween any two points in the same cluster (m ax, measuring compactness) [14]. Dunn index is cal- culated as:
m ax
m in
where
m in min ∈ ∈ ≠
m ax max ∈ ∈
The Dunn index has a range between 0 and infinity. When the Dunn index is large, it means that the clusters are well separated. Therefore, the Dunn index should be maximized.
In this step, we use the R package clValid [16], which compares different clustering algorithms for the sake of identifying the best clustering algo- rithm. We experiment internal validation on 4 algo- rithms including Hierarchical, K-means, Partition- ing Around Medoids (PAM) and Clustering for Large Applications (CLARA).
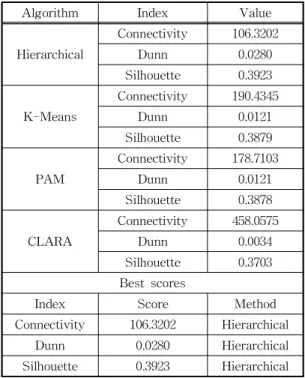
It is observed from Table 2 that the Hierarchical clustering is superior to three other algorithms in all cases. Hereafter, we apply the Hierarchical clustering for our result, where the best number of clusters is four.
Table 2. Obtained results from different clustering algo- rithms using the R package clValid.
Algorithm Index Value
Hierarchical
Connectivity 106.3202
Dunn 0.0280
Silhouette 0.3923
K-Means
Connectivity 190.4345
Dunn 0.0121
Silhouette 0.3879
PAM
Connectivity 178.7103
Dunn 0.0121
Silhouette 0.3878
CLARA
Connectivity 458.0575
Dunn 0.0034
Silhouette 0.3703 Best scores
Index Score Method
Connectivity 106.3202 Hierarchical
Dunn 0.0280 Hierarchical
Silhouette 0.3923 Hierarchical
4. RESULT INTERPRETATION
4.1 Visualization
We use Scikit-learn - a free software machine learning library for Python - to cluster ABH dataset. Before clustering, Principal Component Analysis (PCA) is the selected method to reduce the dimension of the dataset for visualizing. Next, Hierarchical clustering is used to process ABH da- taset to 4 separated clusters.
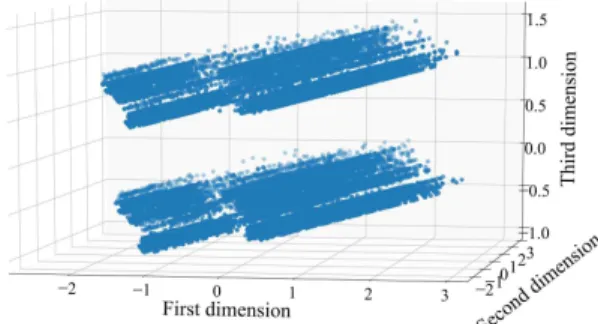
After applying PCA, Fig. 6 and Fig. 7 show, re- spectively, the visualization of dataset before and after clustering in three dimensions. Fig. 6 shows that there are two layers and their shape is almost the same with four groups. Meanwhile, Fig. 7 shows four clusters of data.
4.2 Result Interpretation
In Fig. 8, The results of clustering process show that there are 4 clusters after using Hierarchical clustering for ABH dataset with the percentage of
cluster 1, cluster 2, cluster 3 and cluster 4 in whole ABH dataset being 34.42%, 18.41%, 27.66% and 19.51% respectively.
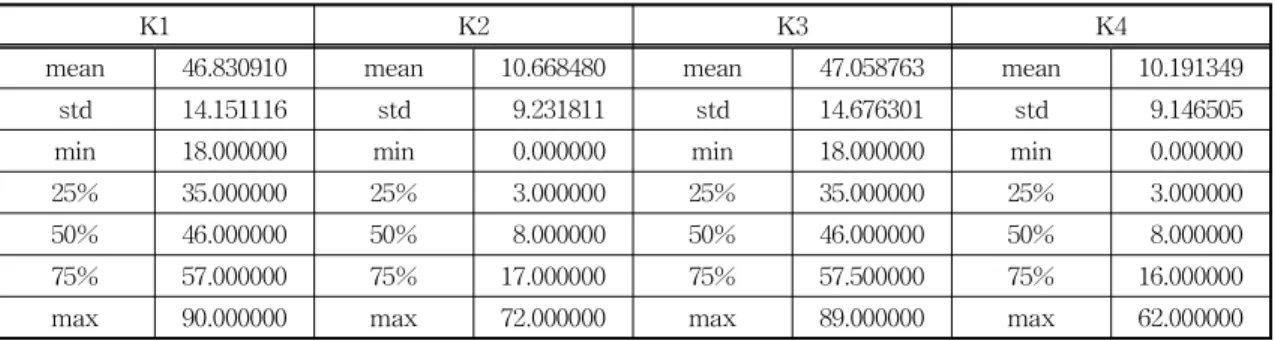
Table 3 illustrates the summary of Age attrib- utes in 4 clusters. Overall, it can be seen that clus- ter 1 and cluster 3 are the groups of adult, the mean of age into 2 these groups are 46.83 and 47.06, from 18 to 90 and 18 to 89 respectively. In contrast, clus- ter 2 and cluster 4 are the groups of children, the average age are 9.23 and 9.15, from 0 to 72 and 0 to 62 respectively.
Fig. 9 shows that female occupies 72.1% and 61.45% in cluster 1 and cluster 3 respectively.
Meanwhile, the proportion of male and female in cluster 2 and cluster 4 are relatively balance, 54.34
% and 50.98% are the percentage of the male in these two clusters respectively.
Regarding the districts where the patient come Fig. 6. Visualizing ABH dataset before clustering.
Fig. 7. Visualizing ABH dataset after clustering.
Fig. 8. The percentage of each cluster.
Fig. 9. The percentage of each cluster by gender.
from, most of the patient lives in Colombo, Ratna- pura, and Kegalle. This trend is because 3 these districts are near ABH.
With regard to the civil status of the patient, most of the patient's civil status in cluster 1 and cluster 3 are married. On the other hand, the pro- portion of single is nearly 100% in cluster 2 and cluster 4. Actually, this trend can be found out from Table 2, group 1 and group 3 are for adult and re- maining groups are for children.
The last features which we need to be interested in are the diseases of the patient (ICD Code and ICD Text):
- In cluster 1, the majority of the patient have common cold, joint pain, stomachache and headache. Most of the diseases belong to 2 groups “Diseases of the musculoskeletal sys- tem and connective tissue" and “Diseases of the respiratory system".
- In cluster 2, the majority of the patient have fever and cough. There are only 4 groups of disease into this cluster such as “Symptoms, signs and abnormal clinical and laboratory findings, not elsewhere classified", “Injury, poisoning and certain other consequences of external causes", “Factors influencing health status and contact with health services" and
“External causes of morbidity". Most of the diseases belong to group “Symptoms, signs and abnormal clinical and laboratory findings, not elsewhere classified".
- In cluster 3, the majority of the patient have
cough, fever. There are only 5 groups of dis- ease into this cluster such as “Symptoms, signs and abnormal clinical and laboratory findings, not elsewhere classified", “Injury, poisoning and certain other consequences of external causes", “Factors influencing health status and contact with health services", “Ex- ternal causes of morbidity" and “Pregnancy, childbirth and the puerperium". Most of the diseases belong to group “Symptoms, signs and abnormal clinical and laboratory findings, not elsewhere classified".
- In cluster 4, the majority of the patient have common cold. Most of the diseases belong to
“Diseases of the respiratory system" group.
In conclusion, there are 4 groups of the patient in OPD at ABH, these groups have some features as follows:
- Most of the patient come from group 1, this include the patients who are adult and married.
In addition, female occupies almost three quarters in this group. Most of the patient had common cold, joint pain, stomachache and headache.
- Group 2 has the smallest number of patients.
Most of the patients are children, single and the proportion of male and female is quite balanced. Furthermore, the majority of patient had fever and cough and belong to group
“Symptoms, signs and abnormal clinical and laboratory findings, not elsewhere classified".
Table 3. Obtained results from different clustering algorithms using the R package clValid.
K1 K2 K3 K4
mean 46.830910 mean 10.668480 mean 47.058763 mean 10.191349
std 14.151116 std 9.231811 std 14.676301 std 9.146505
min 18.000000 min 0.000000 min 18.000000 min 0.000000
25% 35.000000 25% 3.000000 25% 35.000000 25% 3.000000
50% 46.000000 50% 8.000000 50% 46.000000 50% 8.000000
75% 57.000000 75% 17.000000 75% 57.500000 75% 16.000000
max 90.000000 max 72.000000 max 89.000000 max 62.000000
- In group 3, most of the patients are adult and married and the proportion of female is ap- proximately three fifths. Another interesting observation is that the majority of patients belong to group “Symptoms, signs and abnor- mal clinical and laboratory findings, not else- where classified", it is similar group 2.
- Group 4 are children and single group and the number of male and female in this group is almost equal. The majority of the patient had common cold and belong to “Diseases of the respiratory system" group.
5. CONCLUSION
In this study, we proposed a holistic approach to perform the unsupervised clustering of out- patient in developing countries based on historical data of patient in a particular hospital. We use pre- processing and transforming techniques to prepare data from an EMR database for experiment. To en- sure that dataset is suitable for clustering, we used cluster tendency analysis to show that dataset is highly clusterable. Several tests are conducted to determine the best number of clusters and the best clustering algorithm for the input data. Finally, we obtained good results and significant knowledge.
These highly valueable results help the managers and doctors to improve health care quality in de- veloping countries.
Although we obtained some good results, this research still has a few limitations. We only use six attributes to cluster, other attributes such as drug, prescription and so on have not been applied yet because of the computer literacy of doctors, i.e., they entered incomplete and irrelevant information.
In the future, we intend to collect data from more hospitals and to use more attributes and the longer period in order to get the better meaningful result.
In addition, we will find some strong techniques to preprocess incomplete data such as drug, pre- scription and so on to improve the quality of clustering.
REFERENCE
[ 1 ] M.I. Joo, D.H. Ko, and H.C. Kim, “Develop- ment of Smart Healthcare Wear System for Acquiring Vital Signs and Monitoring Perso- nal Health,” J ournal of Korea Multimedia Society, Vol. 19, No. 5, pp. 808- 817, 2016.
[ 2 ] M. Chen, Y. Hao, K. Hwang, L. Wang, and L.
Wang, “Disease Prediction by Machine Learning Over Big Data from Healthcare Communities,” IEEE Access, Vol. 5, pp. 8869- 8879, 2017.
[ 3 ] The Hexagon, Korea helps Sri Lanka Install a Hospital Health Information System(2014).
https://aehin.hingx.org/Share/Details/2255 (accessed Apr., 26, 2019)
[ 4 ] N.M. Saravana Kumar, T. Eswari, P. Sam- path, and S. Lavanya, “Predictive Methodol- ogy for Diabetic Data Analysis in Big Data,”
P rocedia Computer Science, Vol. 50, pp.
203-208, 2015.
[ 5 ] R. Miotto, L. Li, B.A. Kidd, and J.T. Dudley,
“Deep Patient: An Unsupervised Representa- tion to Predict the Future of Patients from the Electronic Health Records,”Scientific Reports, 2016.
[ 6 ] A. Géron,Hands-On Machine Learning with Scikit-Learn and TensorFlow, O'Reilly Media, Boston, MA, 2017.
[ 7 ] H.S. Le and V.H. Pham, “A Novel Multiple Fuzzy Clustering Method based on Internal Clustering Validation Measures with Gradient Descent,” International J ournal of Fuzzy Systems, Vol. 18, No. 5, pp. 894-903, 2016.
[ 8 ] H. Yahyaoui and H.S. Own, “Unsupervised Clustering of Service Performance Behav- iors,” Information Sciences, Vol. 422, No. C, pp. 558-571, 2018.
[ 9 ] R. Tibshirani, G. Walther, and T. Hastie, “Es- timating the Number of Clusters in a Data Set Via the Gap Statistic,” J ournal of the Royal Statistical Society Series B, Vol. 63, No. 2, pp.
411- 423, 2002.
[10] P. Bholowalia and A. Kumar, “EBK-means:
A Clustering Technique Based on Elbow Method and K-Means in WSN,”International J ournal of Computer Applications, Vol. 105, No. 9, pp. 17-24, 2014.
[11] P. Rousseeuw, “Silhouettes: A Graphical Aid to the Interpretation and Validation of Cluster Analysis,” Journal of Computational and Applied Mathematics, Vol. 20, pp. 53-65, 1987.
[12] M. Rezaei and P. Fränti, “Set Matching Measures for External Cluster Validity,”
IEEE Transactions on Knowledge and Data Engineering, Vol. 28, No. 8, pp. 2173-2186, 2016.
[13] K. Tasdemir and E. Merenyi, “A New Cluster Validity Index for Prototype Based Clustering Algorithms based on Inter- and Intra-cluster
Density,” P roceeding of 2007 International Joint Conference on Neural Networks, pp.
2205-2211, 2007.
[14] J.C. Dunn, “Well-separated Clusters and Optimal Fuzzy Partitions,”J ournal of Cyber- netics, Vol. 4, No. 1, pp. 95-104, 1974.
[15] S. Saha and S. Bandyopadhyay, “A Validity Index based on Connectivity,”P roceeding of 2009 Seventh International Conference on Advances in Pattern Recognition, pp. 91-94, 2009.
[16] G. Brock, V. Pihur, and S. Datta, “Clvalid: An R Package for Cluster Validation,”Journal of Statistical Software, Vol. 25, No. 4, pp. 1-22, 2008.
Huu-Trung Hoang
2013 Business Information Sys- tem, Hue University, Viet- nam (B.S.)
2018 Information and Commu- nications Engineering, Inje University, Korea (M.S.) 2018∼Current Department of Information and Com-
munication System, Inje University, Ph.D.
Quoc-Viet Pham
2013 Electronics and Telecom- munications Engineering, Hanoi University of Sci- ence and Technology, Viet- nam (B.S.)
2015 Information and Commu- nications Engineering, Inje University, Korea (M.S.)
2017 Information and Communications Engineering, Inje University, Korea (Ph.D.)
2018∼Current ICT Convergence Center, Changwon National University, Research Professor
Kim Jung Eon
2006 Gyeongsang National Uni- versity, School of Medicine (M.D.)
2018∼Current Inje University Ilsan Paik Hospital, Depar- tment of Emergency Med- icine, Clinical Professor
Kim Hoon
2002 Inha University, College of Medicine (M.D.)
2007 Inha University, College of Medicine, Graduate school, (M.S.)
2017 Inha University, College of Medicine, Graduate school (Ph.D.)
2010~Current Inje University Ilsan Paik Hospital, Department of Emergency Medicine, Professor
Park Junseok
1997 Yonsei Wonju Medical school (M.D.)
2008 Yonsei University College of Medicine, Graduate School (M.S.)
2014 Chungnam Univeristy Col- lege of Medicine, Graduate School (Ph.D.)
2005∼Current Inje University Ilsan Paik Hospital, Department of Emergency Medicine, Professor
Hwang Won-Joo
1998 Pusan National University Dept. of Computer Engin- eering (B.E.)
2000 Pusan National University Dept. of Computer Engin- eering (M.E.)
2002 (Japan) Osaka University Dept. of Information Systems Engineering (Ph.D.)
2002∼Current Inje University Dept. of Electronic, Telecommunications, Mechanical & Automotive Engineering, Professor