* Department of Mechanical Engineering, Korea Advanced Institute of Science and Technology, Daejeon, Korea
† 연락저자, [email protected]
열병합 발전소의 구성안별 성능 평가 방안 - 플랜트 열성능 및 단순화 발전단가 분석
김승진*․최상민*†
Performance Evaluation of Combined Heat and Power Plant Configurations
-Thermodynamic Performance and Simplified Cost Analysis
Seungjin Kim and Sangmin Choi
ABSTRACT
Thermodynamic and economic analyses of various types of gas turbine combined cycle power plants have been performed to establish criteria for optimization of power plants. The concept of efficiency, in terms of the difference in energy levels of electricity and heat, was introduced. The efficiency of power and heat generation by power plants with other purposes was estimated, and power generation costs were figured out for various types of combined heat and power plants(i.e., fired and unfired, condensing and non-condensing modes, single or double pressure HRSG).
Key Words : Gas turbine combined cycle power plants, Combined heat and power, Thermal efficiency, Utili- zation factor, Generation costs
기 호 설 명 Alphabets
: Capacity factor
: Total construction costs
: Construction costs per kW
: Heat
: Work
: Annual cost of electricity generation
: Annual cost of heat generation
Greeks
: Heat generation rate
: Fixed cost ratio
: Efficiency of electricity generation
1. Introduction
For many industries, combined heat and power(CHP) systems offer higher efficiency than separate generation of heat and power using boilers and turbine generators.
Prior to 1960, most combined heat and power systems were based on steam turbine cogeneration systems. Re- cently, however, because of the availability of high tem- perature exhaust gases caused by high operating tempe- ratures in industry, and of the economic benefits resulting
from a high power to heat ratio, gas turbine cogeneration systems have become prime movers in many applica- tions. Such systems, combined heat and power with gas engines and heat recovery boilers, can also be used for generating the heat used in buildings. The combined cycle power plant(CCPP), has drawn keen interest as an effective measure of energy utilization. The recent growth of the CCPP market has been caused by policies for regulation of emission gasses in the United States and Europe[1]. The combined cycle system(i.e., a com- bination of Brayton and Rankine cycles), can achieve high efficiency by utilizing hot flue gasses exhausted from gas turbines as the energy source for power genera-
(a) Type 1: Desalination plant (b) Type 2: Urban combined (c) Type 3: Power generation plant heat and power plant
Fig. 1. Schematic diagram of subject power plants.
tion by steam turbines. A CCPP is composed of a gas turbine, a steam turbine, and a heat-recovery steam ge- nerator(HRSG) for generating high temperature steam.
The HRSG is the key component of the CCPP, the role of which is to be a nexus of the Brayton and Rankine cycles. Until now, the focus of the CCPP design has been on steam cycle called bottoming cycle deciding the design of the steam turbine and HRSG, according to the operating conditions of the gas turbine, including such as capacity, gas turbine outlet temperature, and flue gas flow rate.
However, both power output and costs become impor- tant when considering the gas turbine performance and the HRSG design as elements influencing the total ef- ficiency of CCPPs, because of the trade-offs among various purposes such as combined heat and power pro- duction or desalination[2]. Therefore, ways to optimize design of CCPPs are needed, considering the competing design criteria related to both efficiency and scale. Also, a set of evaluation criteria to determine whether a plant design has been optimized is needed. In this study, to suggest the performance evaluation criteria for CCPPs, various evaluation factors including thermal efficiency were applied to three different commercial power plants.
Then, thermodynamic and economic analyses were con- ducted on six different cycle configurations of plants with fixed gas turbines and steam turbines.
Most of the previous studies on optimization of CCPPs have focused on HRSG design optimization with 1st and 2nd thermodynamic efficiencies for entire power plants [3-5]. In addition to this, some progress has occurred in the form of studies on the thermoeconomic optimi- zation of HRSGs[6], and the determination of design according to steam generation rate and stack tempera- ture of HRSGs[7]. There were also studies on economic
evaluation of the various configurations of plants[8,9]
and design optimization focused on gas turbine cycles [10,11].
Considering the characteristic of CCPPs having not only power but also heat generation, the simple evalu- ation methods used before are insufficient to evaluate the performance of CCPPs properly. Especially, to com- pare different types of CCPPs having different objec- tives, it is necessary to suggest a performance evaluation method that would accommodate the different uses in- tended for CCPPs. The objective of this study was to suggest a methodology to evaluate different types of CCPPs and select the best one corresponding to the use purpose of a plant, through the proper performance evaluation. To determine the important design conside- rations, this study focused on thermodynamic perfor- mance of subject CCPPs having mixed purposes. The heat and electricity generation costs were derived from different combinations of system configurations with fixed gas and steam turbines.
2. Methodology
2.1. Target Plant Selection2.1.1. Target Power Plants
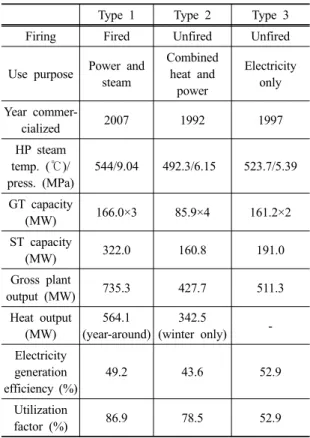
In this study, three types of plants selected for case study were subjected to analyses of efficiency, based on the first law of thermodynamics(see Fig. 1 and Table 1). Fig. 1 represents the schematic capacity and steam (or heat) use of the selected plants. Table 1 presents the purpose, steam condition, specific electricity and heat output and efficiency of power plants. The purposes and compositions of the case plants were varied: Type 1 plant generates electricity and steam for desalination plants, Type 2 plant generates electricity and heat for
Table 1. Examples of combined cycle power plants cases
Type 1 Type 2 Type 3
Firing Fired Unfired Unfired
Use purpose Power and steam
Combined heat and
power
Electricity only Year commer-
cialized 2007 1992 1997
HP steam temp. (℃)/
press. (MPa)
544/9.04 492.3/6.15 523.7/5.39
GT capacity
(MW) 166.0×3 85.9×4 161.2×2
ST capacity
(MW) 322.0 160.8 191.0
Gross plant
output (MW) 735.3 427.7 511.3
Heat output (MW)
564.1 (year-around)
342.5
(winter only) - Electricity
generation efficiency (%)
49.2 43.6 52.9
Utilization
factor (%) 86.9 78.5 52.9
district heating, and Type 3 plant generates electricity only. The demand and usage of heat and steam by Type 1 and Type 2 plant are different. Type 1 plant uses steam year-around, but Type 2 plant uses heat in the winter only.
However, this method for evaluating performance by comparing the rates of power and heat generation of different types of CCPPs, is limited because of their different operating purposes and turbine models. Com- parisons of electricity output alone cannot suggest op- timal solutions for dealing with use demand. Also, the thermodynamic efficiency of the plants in Fig. 1 cannot be the criterion for evaluation of performance coincident with the demands of customers. To figure out specific impacts from selection of different equipment in plants, simple configurations of fixed gas and steam turbines were suggested in the next part.
2.1.2. System Configuration
Unlike Type 1 and Type 3, as a combined heat and power plant, Type 2 has various modes of operation because of regional and seasonal differences in demand
for heat and electricity energy. The operation modes can be divided into back pressure mode(generating both electricity and heat; equipped with heat exchangers at the steam turbine outlet) and condensing mode(genera- ting electricity only equipped with condensers instead of heat exchangers). These modes of operation are se- lected according to seasonal, regional, and customer demands. Since the operation mode of Type 2 is related to the cycle configurations, for a detailed analysis of this study, analysis in various operation modes(back pre- ssure mode and condensing mode) should be additio- nally considered. Therefore, the analysis will include not only the three different types of power plants, but also different configuration cycles of the target CCPPs.
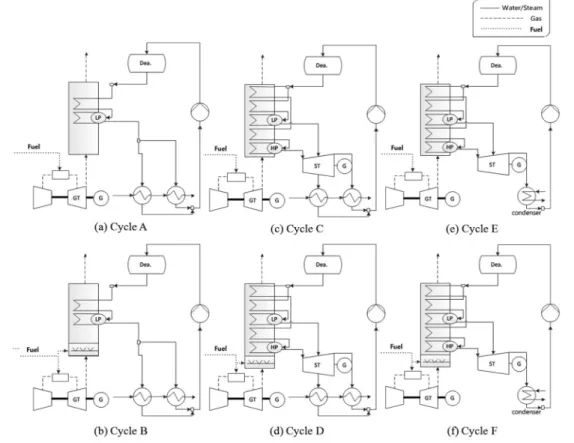
To figure out the effect of HRSG types and conden- sers, on total electricity and heat outputs in power plants with fixed gas and steam turbine models(Type 2 power plants in Fig. 1), combined heat and power plants, will be analyzed in six different cycle configurations. As shown in Fig. 2, various cycle configurations involve different equipment. Cycle A consists of a gas turbine, single-pressure HRSG, and heat exchangers. Cycle C consists of a gas turbine, steam turbine, double-pressure HRSG and heat exchangers. Cycle E consists of a gas turbine, steam turbine, double-pressure HRSG and con- denser. In addition, to figure out the effect of duct bur- ners supplying additional heat to exhaust gas from gas turbines, in order to increase the steam generation rate, heat and electricity generation rates are derived for cy- cles B, D, and F, which are configurations like A, C and E, but with additional duct burners(Fig. 2). Furthermore, the simple electricity and heat generation costs which could provide criteria for cycle selection, were also de- rived and evaluated.
(a) Cycle A - Unfired HRSG LP process steam(0.685 MPa)
(b) Cycle B - Supplementary fired(gas temperature at gas turbine outlet : 922 K) HRSG, LP process steam
(c) Cycle C - Combined cycle, unfired, double-pressure level HRSG, HP at 6.149 MPa, 765 K(steam pressure and temperature), LP at 0.685 MPa, 437 K (saturated), noncondensing steam turbine-generator (d) Cycle D - Combined cycle, supplementary fired HRSG, HP at 6.149 MPa, 765 K. LP at 0.685 MPa, 437 K(saturated), noncondensing steam tur- bine-generator
Fig. 2. System configurations.
(e) Cycle E - Same as Cycle C, but with admission condensing steam turbine-generator
(f) Cycle F - Same as Cycle D, but with condensing steam turbine-generator
* LP: Low pressure level, HP: High pressure level
** Fired/unfired: with/without supplementary firing at duct burner with fixed gas and steam turbines.
2.2. Simulation
2.2.1. Thermodynamic Evaluation
One of the most representative of the performance evaluation criteria, is thermodynamic efficiency, repre- senting the ratio of output energy to input energy. In this study, three efficiencies, shown as Eqs. (1)-(3), are used to evaluate performance of the different types of power plants in Fig. 1 and Table 1.
(1)
(2)
× ×
(3)
Eq. (1) represents electrical efficiency, and is gene- rally used in performance evaluation of power plants by creating a ratio of the rates of electricity generation to heat consumption. Eq. (2) represents the fuel utiliza- tion factor, and creates a ratio of the rates of total heat and electricity generation, to heat consumption; in fuel units. Eq. (3) represents R1 energy efficiency, which is used to compare combined generation of heat and power, with divided generation[12,13]. In R1 energy efficiency, equivalence factors are multiplied to work and heat output which are derived from efficiency of divided ge- neration of heat and power, respectively. The factor 2.6 for electricity can be calculated as the inverse number of electricity generation efficiency and an average Eu- ropean coefficient of coal plants, 38%, is used. Similarly, the factor 1.1 for generated heat can be obtained from the inverse number of heat generation efficiency and an average European coefficient of heat plants, 91%, is used. By multiplying these equivalence factors, R1 ener- gy efficiency represents ratio of heat consumption rate
between divided generation and combined generation of heat and power.
2.2.2. Economic Evaluation - Heat and Electricity Generation Costs per kWh
A balance between economic factors and design ef- ficiency should be considered for power plant optimiza- tion. In general, when power plants are designed, if cost factor is the limiting condition among several designs, the optimized design is the plant with the highest effi- ciency, which does not go over the project budget. This study was focused on electricity and heat generation costs of six different cycle configurations of combined heat and power plants(Type 2) consuming relatively large amounts of steam, with fixed gas and steam tur- bines as shown in Fig. 2. The cost for generation of 1 kWh of electricity was figured out using Eq. (4), and the cost for heat generation was figured out using Eq.
(5). Eq. (6) represents the possible revenue of power plant when electricity and heat are sold in generating their generating cost.
×
×
(4)
×
××
(5)
× ×
×
×
(6)
The unit generating cost as shown in Eq. (4) and Eq.
(6) are sum of fixed cost and fuel cost. Ic, Ψ, and If represents construction cost, fixed cost rate, and fuel cost at each. The operating hour of power plant is assumed as 8,760 hours and capacity factor C is assumed as 90%. In Eq. (5), the construction cost is subtracted to avoid the double counting, and also, the difference of efficiency and generation rate of heat and power is considered. In Eq. (6), the operating cost is considered with assumptions that operating cost is 25% of fuel cost in general.
Every power generation cycle in this study used na- tural gas as a fuel in gas turbines. The three subject po- wer plants and six system configurations were simulated using Gate Cycle, a commercial software[14]. The pro- perties needed in Eq. (1)-(6), such as fuel consumption rate, temperature and pressure profile, can be attained
by analyzing cycle. Using TPX in Excel[15], the ther- modynamic properties of steam, such as enthalpy and entropy, can be obtained from pressure and temperature conditions. From the T-s diagram of each cycle, the po- wer generation rate of the turbine, and the heat genera- tion rate of the heat exchanger can be figured out.
3. Results
3.1. EfficiencyFig. 3 represents the efficiency of three different types of gas turbine combined cycle power plants. The elec- tricity generation efficiency was determined for each subject plant type(Type 1 54.74%, Type 2 44.92%, and Type 3 49.80%). Utilization factors considering both electricity and heat generation for each plant type were also calculated(Type 1 93.55%, Type 2 83.21%, and Type 3 with condensing steam turbine, does not gene- rate heat). Last, equalized, or R1, energy efficiency re- presenting the effect of gas turbine-CCPPs comparing to divided generation was calculated for each type (Type 1 185.0%, Type 2 158.9%, and Type 3 129.5%).
The Type 3 plant had the lowest, and the Type 1 had the highest equalized efficiency. Because Type 1 plants had highest value in three points of view of perfor- mance efficiency, Type 2 plants and Type 3 plants can be compared to suggest the need of various efficiency factors. Type 2 plants can be interpreted as having a more effective combined cycle, because Type 3 plants, whose purpose is electricity generation had higher elec- tricity generation efficiency, but lower equalized effici- ency than did Type 2 plants. Therefore, it was showed that equalized efficiency, considering generation of electricity and heat separately, can usefully compare the effects of combined cycle configurations.
Fig. 3. Efficiency of various gas turbine combined cycle power plants.
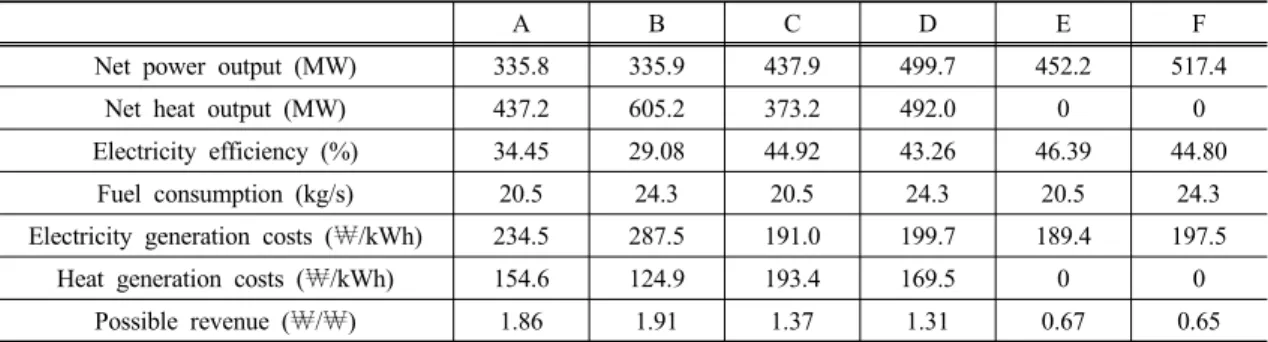
Table 2. Economic Analysis of Various System Configurations
A B C D E F
Net power output (MW) 335.8 335.9 437.9 499.7 452.2 517.4
Net heat output (MW) 437.2 605.2 373.2 492.0 0 0
Electricity efficiency (%) 34.45 29.08 44.92 43.26 46.39 44.80
Fuel consumption (kg/s) 20.5 24.3 20.5 24.3 20.5 24.3
Electricity generation costs (₩/kWh) 234.5 287.5 191.0 199.7 189.4 197.5
Heat generation costs (₩/kWh) 154.6 124.9 193.4 169.5 0 0
Possible revenue (₩/₩) 1.86 1.91 1.37 1.31 0.67 0.65
Fig. 3 represents the efficiency of three different types of gas turbine combined cycle power plants. The elec- tricity generation efficiency was determined for each subject plant type(Type 1 54.74%, Type 2 44.92%, and Type 3 49.80%). Utilization factors considering both electricity and heat generation for each plant type were also calculated(Type 1 93.55%, Type 2 83.21%, and Type 3 with condensing steam turbine, does not generate heat). Last, equalized, or R1, energy efficiency repre- senting the effect of gas turbine-CCPPs comparing to divided generation was calculated for each type(Type 1 185.0%, Type 2 158.9%, and Type 3 129.5%). The Type 3 plant had the lowest, and the Type 1 had the highest equalized efficiency. Type 2 plants can be in- terpreted as having a more effective combined cycle, because Type 3 plants, whose purpose is electricity ge- neration had higher electricity generation efficiency, but lower equalized efficiency than did Type 2 plants. There- fore, it was showed that equalized efficiency, considering generation of electricity and heat separately, can use- fully compare the effects of combined cycle configu- rations.
3.2. System Configuration
Fig. 4 represents the electricity and heat generation rates of six different cycle configurations of Type 2 combined heat and power plants. This result is similar to that of a technical report about gas turbine cogene- ration system[16].
Fig. 4 displays the options available using a gas turbine in a combined heat and power system. In this study, the area of the heat exchanger units in the HRSG, gas turbine and steam turbine were fixed, and at the same time, the efficiency of each component was con- sidered. Table 2 represents the electricity and heat ge- neration cost of six cycle-configurations of combined heat and power plants with a 14% fixed charge rate,
Fig. 4. Performance envelope for gas turbine combined heat and power system.
100% capacity use rate, and with operating and manage- ment costs included in fixed costs. As shown in Table 2, comparing A, C, and E configurations, although the construction costs increased when using double-pressure HRSG, the electricity generation costs decreased as the efficiency of the power plant increased. However, the heat generation costs increased because of a decline in the total heat generation rate. In addition, comparing the C and D configurations, the efficiency of the power plants increased as fuel was added to the boilers, and heat generation costs decreased as the total heat gene- ration rate increased. The electricity generation cost increased because of increasing construction and fuel costs. Compared to unfired configurations(A, C, E) having same conditions, except fuel consumption, the electricity generation cost of every fired configurations (B, D, F) are increased. On the other hand, compared to unfired configuration(A, C), the heat generation cost of fired configurations(B, D) are decreased. Especially, in the case of the comparison of the A and B configu- rations, the additional combustion have only influence on net heat output. There are no steam turbine in the
Fig. 5. Heat to power ratio
Fig. 6. Heat and electricity generation costs.
both configurations. It explains that the additional fuel in the B configuration can not generate additional el- ectricity from supplementary firing and make more el- ectricity generation than the case A. Looking at the possible revenue, supplementary firing of the double- pressure HRSG(D and F) has cost merit but there is no cost merit in supplementary firing of the single- pressure HRSG(B).
To figure out the effect of the different operation modes which are back pressure mode and condensing mode, comparison between the C and E, and also those between D and F, are necessary. As shown in the Table 2, regardless of supplementary firing, since the net power generation of condensing mode are slightly more than those of back pressure mode, electricity generation cost of condensing mode is slightly cheaper than the cost in the back pressure mode. However, considering the po- ssible revenue, the possible revenue of the condensing mode is half the value of the back pressure mode.
Figs. 5 and 6 represent the result of cost estimation
in the form of graphs. As shown in Fig. 5 displaying the heat to power ratio, E and F cycles have zero value because they generate electricity only using condensing steam turbines. Fig. 6 displays the total generation costs, including heat and electricity generation. Also shown in Fig. 6, E and F cycles indicate the costs of electricity generation only.
4. Conclusion
The thermodynamic analysis of different types of gas turbine combined cycle power plants was executed.
Power and heat generation rates, and the generation costs of various cycle configurations were derived in order to determine a set of optimization criteria for de- sign of gas turbine combined cycle power plants. The results including economic evaluation were derived for simpler models than real combined cycle power plants.
The conclusions from this study are as follows.
1) The R1 efficiency can be interpreted as a crite- rion to compare the effect of combined cycle plants with other power plants having different objectives.
2) Thermodynamic efficiency cannot be an absolute criterion for comparing the performance of com- bined cycle power plants with different purpose and configurations.
3) The different type of performance evaluation fac- tors should be applied considering objectives of power plants.
4) The suggested method for design of combined cycle power plants is regarded as reasonable for appli- cation to commercial power plants.
To decide the optimal power plant configuration, pro- ject-planners of a power plant must know exactly what customers need. Depending on the requirements of cus- tomers, such as the amount of heat and power genera- tion, project-planners have to select the proper evaluation methods, compare the performance of power plants, and then decide the optimal power plant satisfying the demands of customers. However, considering only the power plant efficiency is not sufficient to decide the cycle configuration. In this case, the cost factor can be one of the boundary factors in the final selection of the cycle. Parametric studies on these plants of interest, must proceed before optimization criteria can be suggested.
Consequently, the results of this study can be used as a first step to suggest performance evaluation method
of new type of power system. Also, it can be extended by being applied to new type of power plant such as power generation with carbon capture unit. This study suggested the need of different point of view to evaluate performance of power plant, and further study will pro- ceed about suggestion of integrated process in power plant design considering objectives of system.
Acknowledgement
This work was supported by Brain Korea 21.
Reference
[1] H. Nusseler, Reinhard Preiss, Peter Eisenkolb, “De- velopments in HRSG technology”, in 7th Annual Industrial & Power Gas Turbine O&M Confe- rence, Birmingham, UK, 2001.
[2] M. Valdés and J. L. Rupún, “Optimization of heat recovery steam generators for combined cycle gas turbine power plants”, Applied Thermal Engineering, Vol. 21, Issue 11 2001, pp. 1149-1159.
[3] N. Ravi Kumar, Dr. K. Rama Krishna & Dr. A.
V. Sita Rama Raju, “Performance simulation of dual pressure HRSG in combined cycle”, Energy Engineering, Vol. 104, Issue 1, 2007, pp. 64-78.
[4] N. Enadi and K. Roshandel, “Thermodynamic mo- deling and parametric study and exergy optimiza- tion of single, dual and triple pressure combined cycle power plants(CCPP)”, Communication Soft- ware and Networks(ICCSN), 2011 IEEE 3rd Inter- national Conference on, IEEE, 2011, pp. 361-365.
[5] J. In and S. Lee, “Optimization of heat recovery steam generator through exergy analysis for com- bined cycle gas turbine power plants”, Int. J. of En- ergy Research, Vol. 32, Issue 9, 2008, pp. 859-869.
[6] C. Casarosa, F. Donatini, A. Franco, “Thermoeco- nomic optimization of heat recovery steam genera- tors operating parameters for combined plants”, Energy, Vol. 29, Issue 3, 2004, pp. 389-414.
[7] A. Pasha and S. Jolly, “Combined cycle heat re- covery steam generators optimum capabilities and selection criteria”, Heat Recovery Systems & CHP, Vol. 15, Issue 2, 1995, pp. 147-154.
[8] R. Kehlhofer, “Comparison of power plants for cogeneration of heat and electricity”, The Brown Bovery Review, Vol. 67, Issue 8, 1980, pp. 504- 511.
[9] R. Kehlhofer, B. Rukes, F. Hannemann, F. Stirni- mann, “Combined-Cycle Gas & Steam Turbine Power Plants (3rd ed.)”, PennWell Corporation, Oklahoma, 2009.
[10] A. Polyzakis, C. Koroneos, G. Xydis, “Optimum gas turbine cycle for combined cycle power plant”, Energy Conversion and Management, Vol. 49, Issue 4, 2008, pp. 551-563.
[11] T. Srinivas, B. V. Reddy, A. V. S. S. K. S. Gupta.,
“Parametric simulation of combined cycle power plant: A case study”, Int. J. Thermodynamics, Vol.
14, No. 1, 2011, pp. 29-36.
[12] EURELECTRIC, “European combined heat &
power: a technical analysis of possible definition of the concept of “Quality CHP” ”, Union of the Electricity Industry-EURELECTRIC, 2002.
[13] European Commision, “Guidelines on the interac- tion of the R1 energy efficiency formula for in- cineration facilities dedicated to the processing of municipal solid waste according to ANNEX II of directive 2008/98/EC on waste”, European Com- mision-Directive-general environment, 2011.
[14] GE Energy, “GateCycle getting started and ins- tallation guide”, GE Enter Software LLC., Califor- nia, 2006.
[15] D. G. Goodwin, TPX : Thermodynamic properties for excel, Version 1.0 beta 2, URL <http://www.
tecnun.es/asignaturas/termo/SOFTWARE/TPX/ind ex.html>. (1998).
[16] R. W. Fisk and R. L. VanHousen, “Cogeneration application considerations”, Technical Report GER- 3430F, GE Power Systems, Newyork, 1996.
논문접수일 : 2013. 08. 22 심사완료일 : 2013. 09. 23