Whole-genome Transcriptional Responses to Hypoxia in Respiration-proficient and Respiration-deficient Yeasts: Implication of the Mitochondrial Respiratory Chain in Oxygen-regulated Gene Expression
Bo Young Lee1, Jong-Hwan Lee2, June-Ho Byun3* and Dong Kyun Woo1*
1College of Pharmacy and Research Institute of Pharmaceutical Sciences, Gyeongsang National University, Jinju, 660-701, Korea
2Department of Biotechnology and Bioengineering, Dong-eui University, Busan 614-714, Korea
3Department of Oral and Maxillofacial Surgery, Gyeongsang National University School of Medicine and Gyeongsang National University
Hospital, Institute of Health Sciences, Gyeongsang National University, Chilam-dong, Jinju 660-702, Korea Received September 6, 2016 /Revised September 25, 2016 /Accepted September 26, 2016
Cells sense, respond, and adapt to a low oxygen environment called hypoxia, which is widely in- volved in a variety of human diseases. Adaptation to low oxygen concentrations includes gene ex- pression changes by inducing hypoxic genes and reducing aerobic genes. Recently, the mitochondrial respiratory chain has been implicated in the control of these oxygen-regulated genes when cells expe- rience hypoxia. In order to obtain an insight into an effect of the mitochondrial respiratory chain on cellular response to hyxpoxia, we here examined whole genome transcript signatures of respira- tion-proficient and respiration-deficient budding yeasts exposed to hypoxia using DNA microarrays.
By comparing whole transcriptomes to hypoxia in respiration-proficient and respiration-deficient yeasts, we found that there are several classes of oxygen-regulated genes. Some of them require the mitochondrial respiratory chain for their expression under hypoxia while others do not. We found that the majority of hypoxic genes and aerobic genes need the mitochondrial respiratory chain for their expression under hypoxia. However, we also found that there are some hypoxic and aerobic genes whose expression under hypoxia is independent of the mitochondrial respiratory chain. These results indicate a key involvement of the mitochondrial respiratory chain in oxygen-regulated gene expression and multiple mechanisms for controlling oxygen-regulated gene expression. In addition, we provided gene ontology analyses and computational promoter analyses for hypoxic genes identified in the study. Together with differentially regulated genes under hypoxia, these post-analysis data will be useful resources for understanding the biology of response to hypoxia.
Key words : Aerobic genes, hypoxia, hypoxic genes, mitochondria, respiration
*Corresponding authors
*Tel : +82-55-772-2428, Fax : +82-55-772-2429
*E-mail : [email protected] (Dong Kyun Woo) [email protected] (June-Ho Byun)
This is an Open-Access article distributed under the terms of the Creative Commons Attribution Non-Commercial License (http://creativecommons.org/licenses/by-nc/3.0) which permits unrestricted non-commercial use, distribution, and reproduction in any medium, provided the original work is properly cited.
Introduction
Cells are capable of responding to an exposure to a low oxygen environment, i.e., hypoxia [6]. This response to hypo- xia includes immediate changes in cellular energy metabo- lism as a short-term adaptation as well as the activation of gene expression pathways as a long-term adaptation, which help the cell cope with an insufficient concentration of oxy- gen [6, 15]. Upon exposure to hypoxia, these gene expression pathways function to up-regulate a large number of hypoxic
genes that are induced under low oxygen environments, and down-regulate a large number of aerobic genes that are ex- pressed optimally in normoxic environments. Thus, the changes in expression of these oxygen-regulated genes (i.e., both hypoxic and aerobic genes) are crucial for cellular adap- tation to a prolonged hypoxic environment.
Recent microarray studies have demonstrated that a sub- stantial number (up to 15%) of the entire genes in yeast are oxygen-regulated [3, 23]. Expression of these oxygen-regu- lated genes is known to be mediated through the control of a handful of transcription factors. For example, Rox1p re- presses transcription of hypoxic genes under normoxic con- ditions [18] while Mga2p activates transcription of hypoxic genes in response to hypoxia [17]. And, Mot3p represses transcription of hypoxic genes [19] whereas Hap1p activates transcription of aerobic genes, including ROX1, under aero- bic conditions [25]. So far, much of the work on these yeast transcription factors has focused on the effects of oxygen
and heme levels on the activity of Hap1p, which is known to regulate most aerobic genes in response to oxygen levels.
The activity of Hap1p is controlled by the level of an intra- cellular heme pool. Under conditions of low oxygen, heme and Rox1p levels drop [31] and Rox1p-regulated hypoxic genes are de-repressed, allowing for their expression under hypoxic conditions. Moreover, Hap1p actively represses transcription of ROX1 in oxygen limiting conditions [10].
In addition to transcription factors mentioned above, sev- eral recent studies have implicated the mitochondrial respi- ratory chain in the induction of hypoxic nuclear genes in both yeast [21, 26] and mammals [9]. Initially, it was pro- posed that the mitochondrial respiratory chain produces in- creased levels of reactive oxygen species (ROS) when cells experience reduced oxygen levels and that these ROS are involved. Although this mechanism for hypoxic gene in- duction in mammals has been controversial in the past, re- cent studies strengthen the conclusion that mammalian cells undergo oxidative stress when exposed to hypoxia and that mitochondrially-generated ROS function in hypoxic signal- ing by stabilizing HIF-1, an important regulator of hypoxic genes [5, 14]. However, it is not clear from these studies if ROS are sufficient for HIF-1 stability. Regardless of exact mechanisms, it seems that the mitochondrial respiratory chain plays a key role in expression of oxygen-regulated genes under hypoxia.
In the present study, we investigated a role for the mi- tochondrial respiratory chain in oxygen-regulated gene ex- pression at whole genome levels using DNA microarrays in the budding yeast, Saccharomyces cerevisiae. By comparing whole genome responses to hypoxia in respiration-proficient and respiration-deficient yeasts, we found that there are sev- eral classes of oxygen-regulated genes. Some of them require the mitochondrial respiratory chain for their expression un- der hypoxia while others do not. These results suggest that the mitochondrial respiratory chain participates in ex- pression of oxygen-regulated genes under hypoxia in multi- ple ways.
Materials and Methods
Yeast strains, media, and growth conditions The following S. cerevisiae strains were used in this study:
JM43 (MATα, his4-580, trp1-289, leu2-3, 112, ura3-52 [ρ+]) [24]
and JM43ρ0 (MATα, his4-580, trp1-289, leu2-3, 112, ura3-52 [ρ0]) [29]. JM43 and JM43ρ0 are iso-chromosomal. Yeast cells were
grown in SSG-TEA, a semisynthetic galactose medium, sup- plemented with Tween 80, ergosterol, silicon antifoam, and amino acids and uracil, as described [7]. Pre-cultures were grown to steady-state on a controlled environment incubator shaker (New Brunswick Scientific, Enfield, USA) at 200 rpm and 30°C and kept in logarithmic growth phase for at least 10 generations. Logarithmic phase pre-cultures were used to inoculate main cultures, which were grown under nor- moxia or anoxia in a New Brunswick BIOFLO 3,000 fermen- tor, as described [7]. Steady-state normoxic and anoxic cul- tures were collected by centrifugation and immediately used or frozen at -80°C prior to further analyses. Anoxic cultures were exposed to anoxia for 24 hr.
RNA isolation and DNA microarray analysis Total RNA from JM43 and JM43ρ0 was isolated by the phenol-chloroform method [13], further purified with a RNeasy midi kit (Qiagen, Venlo, Netherlands) according to the manufacturer’s instructions, and subjected to DNA mi- croarray experiments. cDNAs were synthesized from 5 µg of total RNA by using the Superscript Choice kit (Invitrogen, Waltham, USA) with a T7-(dT)24 primer incorporating a T7 RNA polymerase promoter. cRNAs were generated and bio- tin-labeled by T7-dependent in vitro transcription (Enzo Biochemical, New York, USA). Labeled cRNAs were frag- mented by incubation at 94°C for 35 min in 40 mM Tris acetate, pH 8.1, 100 mM potassium acetate, and 30 mM mag- nesium acetate. Fifteen micrograms of fragmented cRNAs were hybridized for 16 hr at 45°C to Yeast Genome 2.0 Array (Affymetrix, Santa Clara, USA). This yeast genomic chip con- tains probe sets for two yeast species (both S. cerevisiae and S. pombe). Probe sets for S. pombe were excluded and only probe sets for S. cerevisiae were considered in later analysis.
The chips were washed, stained with streptavidin-phycoery- thrin in a fluidics station, and scanned at 3-µm resolution in the Affymetrix Genechip System confocal scanner (Agilent Technologies, Massy, France). For each yeast strain JM43 and JM43ρ0, three independent RNA isolations and mi- croarray experiments including both normoxic and anoxic conditions, were performed.
Microarray data preparation and analysis
All data processing and analysis were performed using R (http://www.r-project.org). Raw data from array scans were normalized using the Robust Multi-chip Average method [16] through the RMA package of Bioconductor [2].
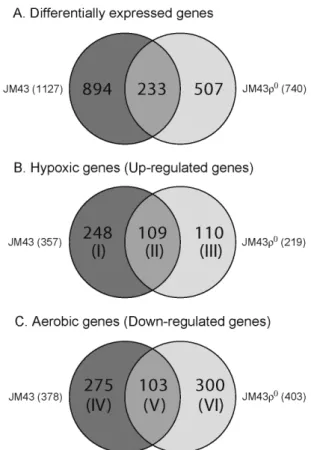
Fig. 1. Venn diagrams representing statistically significant genes that are differentially expressed in response to anoxia for 24 hr. (A) A Venn diagram showing all of differ- entially expressed genes which include both induced and repressed genes in anoxic JM43 and JM43ρ0 cultures.
(B) A Venn diagram illustrating hypoxia-induced genes (hypoxic genes), which are up-regulated at least 1.5-fold in anoxic cultures relative to normoxic cultures. These hypoxic genes are classified into Categories I-III, which are indicated in parentheses. (C) A Venn diagram illus- trating down-regulated genes (aerobic genes) that are re- duced at least 1.5-fold in anoxic cultures relative to nor- moxic cultures. These aerobic genes are classified into Categories IV-VI, which are indicated in parentheses.
After normalization, the data were filtered using two criteria;
(1) Affymetrix mRNA detection calls were used to exclude all Probe Set Ids with an ‘Absent’ call in all samples. (2) Transcripts that demonstrate little variation across all arrays were removed. This is performed by comparing the variance of the log-intensities for each gene with the median of all variance for the entire array. Those genes not significantly more variable then the median are filtered out. After filter- ing, we performed a two-tailed t-test and corrected the p-val- ue with False Discovery Rate (FDR) procedure [4]. At FDR of 0.05, the analysis produced the final lists of 1127 and 740 differently expressed genes in anaerobic conditions relative to matching aerobic conditions in JM43 and JM43ρ0, respectively. These differentially expressed genes were clus- tered using hierarchical clustering approach [2] through the R packages ‘heatmap’ and ‘gradient.rect’. Co-regulated genes were further grouped with respect to existing annota- tions (e.g., Gene Ontology) [1] using FunSpec (a web-based tool available online at http://funspec.med.utoronto.ca) [27]. Transcription regulatory associations between tran- scription factors and co-regulated genes were explored using the YEASTRACT database (www.yeastract.com) [28]. This database provides tools analyzing transcriptional regulatory networks in yeast based on experimental evidence under- lying these regulatory associations, which is spread through- out hundreds of published articles.
Results and Discussion
Involvement of the mitochondrial respiratory chain in global gene expression in response to hypoxia
In order to obtain insights into roles for the mitochondrial respiratory chain in the global gene expression responding to hypoxia in yeast, we have used two S. cerevisiae strains;
the respiration-proficient wild-type JM43 and its respira- tion-deficient derivative, JM43ρ0. JM43ρ0 is iso-chromosomal to JM43 but lacks a mtDNA and a functional mitochondrial respiratory chain, resulting in a complete loss of respiration.
We cultured these strains first aerobically and then exposed them to anoxia for 24 hr. Aerobic and anaerobic cells were harvested by centrifugation. Subsequently, total RNA was isolated, purified, and subjected to Yeast Genome 2.0 Array from Affymetrix. All experiments were triplicated. For each strain, we compared its aerobic transcriptomes with match- ing anaerobic transcriptomes. These comparisons revealed differentially expressed genes in JM43 or JM43ρ0, in response
to oxygen availability. As shown in Fig. 1A, at the false dis- covery rate of 0.05, exposure of yeast cells to anoxia for 24 hr led to change in expression levels of 1127 genes in JM43 and of 740 genes in JM43ρ0. These differentially expressed genes in anaerobic cultures relative to aerobic cultures are oxygen-regulated and include both up-regulated and down-regulated genes. They correspond to an overall change in approximately 17% and 11% of the whole yeast transcriptome in JM43 and JM43ρ0, respectively. From Fig.
1A, 233 genes are affected in both JM43 and JM43ρ0, indicat- ing that their regulation is not dependent on respiration.
However, the gene expression change of 894 genes in JM43
and that of 507 genes in JM43ρ0 are unique to cell’s ability to respire, indicating that respiring cells respond differently to lack of oxygen from non-respiring cells.
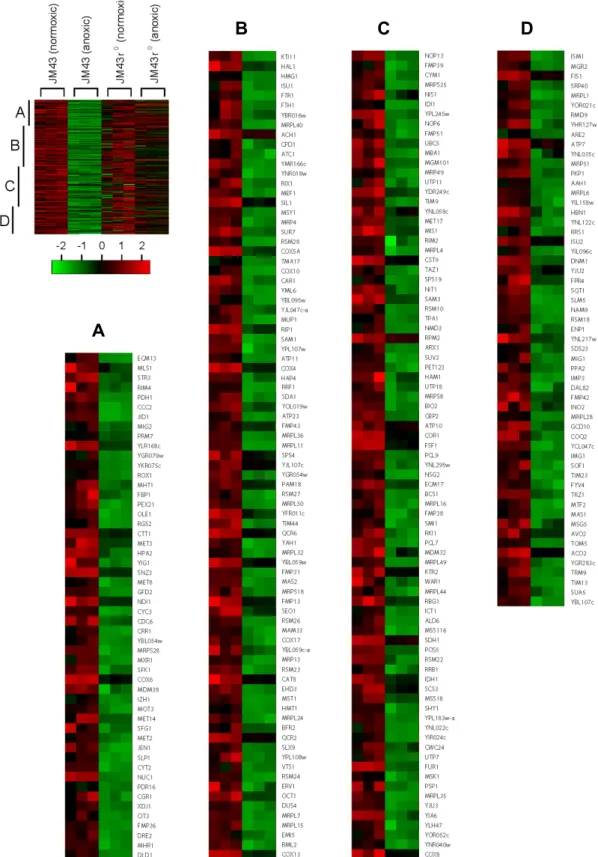
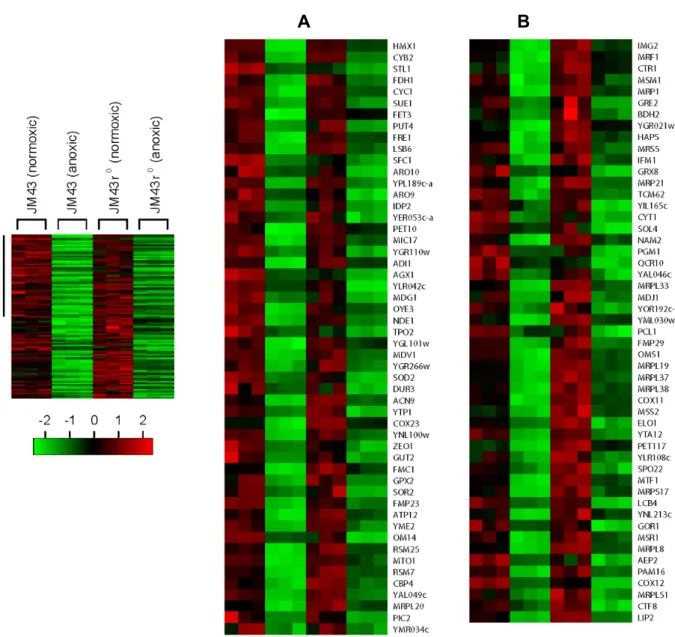
These oxygen-regulated genes were further selected by modes of expression (i.e., induced or reduced) and by de- grees of change in expression (i.e., >1.5-fold up or down) under hypoxia (Fig. 1B and C). Fig. 1B shows up-regulated genes in response to lack of oxygen. These up-regulated genes are referred to hypoxic genes because their expression is induced under hypoxia. These hypoxic genes comprise three Categories (Categories I-III). First, Category I genes are up-regulated exclusively in JM43. Second, Category II genes are increased in both JM43 and JM43ρ0. Third, Category III genes are induced only in JM43ρ0. Category I genes requires the mitochondrial respiratory chain for their induced ex- pression upon hypoxia while Categories II and III genes do not. As shown in Fig. 2B, we revealed 467 yeast hypoxic genes of which 248 genes are Category I, 109 genes are Category II, and 110 genes are Category III. Therefore, the induction of 248 hypoxic genes (Category I) in JM43 is asso- ciated with respiration-proficiency. However, the up-regu- lation of 109 hypoxic genes (Category II) in both JM43 and JM43ρ0, and that of 110 genes (Category III) in JM43ρ0 do not require respiration. Gene names and their expression levels corresponding to Categories I-III are shown in Fig.
2-Fig. 4.
Fig. 1C represents down-regulated genes in response to anoxia. These down-regulated genes are referred to aerobic genes because their optimal expression is reduced under hypoxia. Similarly to hypoxic genes in Fig. 1B, these aerobic genes comprise three categories (Categories IV-VI). First, Category IV genes are down-regulated exclusively in JM43.
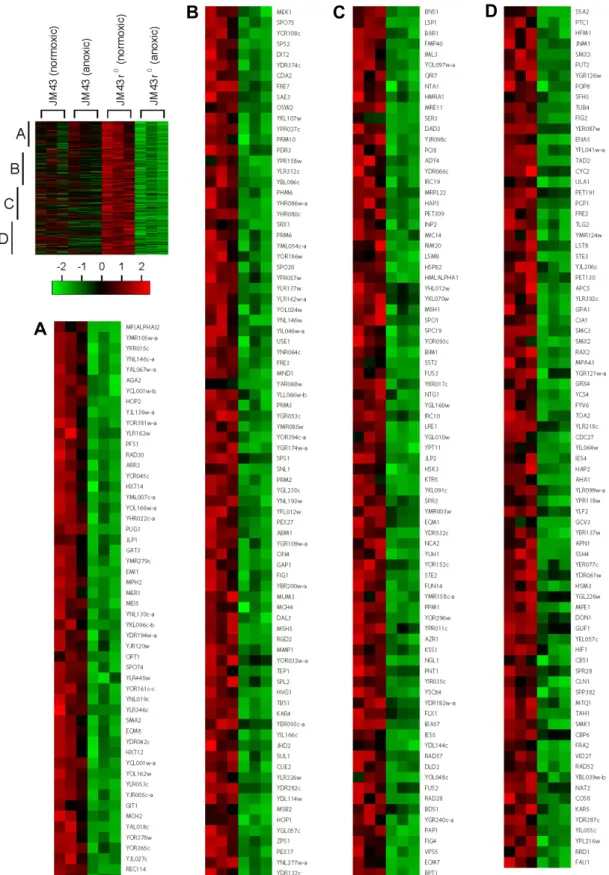
Second, Category V genes are decreased in both JM43 and JM43ρ0. Third, Category VI genes are reduced only in JM43ρ0. Category IV genes requires the mitochondrial respiratory chain for their reduced expression upon hypoxia while Categories V and VI genes do not. From Fig. 1C, we found 678 yeast aerobic genes of which 275 genes are Category IV, 103 genes are Category V, and 300 genes are Category VI. Thus, the down-regulation of 275 aerobic genes (Catego- ry IV) in JM43 is dependent on cell’s ability to respire. But the reduced expression of 103 aerobic genes (Category V) in both JM43 and JM43ρ0, and that of 300 in JM43ρ0 (Category VI) do not require respiration. Gene names and expression levels for Categories IV-VI are shown in Fig. 5-Fig. 7.
Overall, from above results, a large number of genes in
yeast genome are needed for the adaptation from aerobic to anaerobic environments. Among them, some hypoxic and/or aerobic genes are dependent on respiration for their change in expression but others are not. In addition, from the finding that many aerobic genes are down-regulated in response to hypoxia, it is apparent that both up-regulation of hypoxic genes and down-regulation of aerobic genes are required to maximal cellular adaptation to hypoxia. This no- tion is particularly important for hypoxic/aerobic gene pairs.
Because these gene pairs encode interchangeable proteins with different functional properties, the failure to switch off one gene while the other is switched on would result in com- petition between hypoxic and aerobic isoforms, preventing maximal adaptation to hypoxia. Here, we were able to con- firm that the expression of hypoxic/aerobic gene pairs is tightly regulated by oxygen levels. For examples, hypoxic genes COX5b, CYC7, HMG2, and ANB1 are up-regulated in response to hypoxia as their aerobic counterparts COX5a, CYC1, HMG1, and HYP2 (TIF51a) respectively, are simulta- neously down-regulated.
Gene ontology (GO) biological processes enriched in hypoxic genes and aerobic genes (Categories I-VI) relative to the whole yeast genome
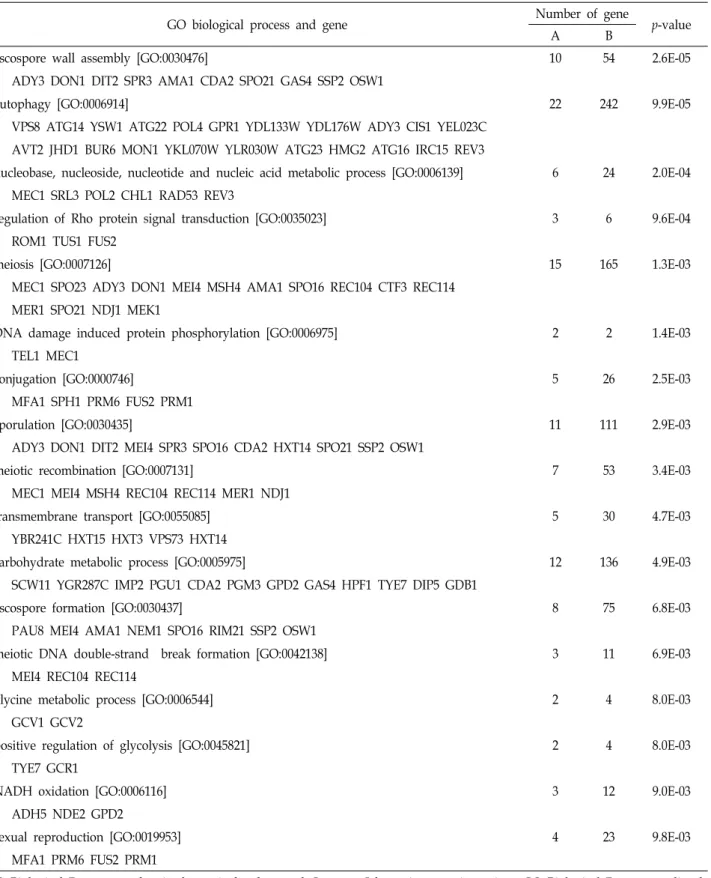
Table 1 lists GO biological processes overrepresented in 248 hypoxic genes (Category I) which require respiration.
Notably, twenty-two genes involved in autophagy are in- duced in response to hypoxia, indicating that autophagy is an important cell survival response to hypoxia. This notion is also supported by studies with mammalian cell cultures [30], in which mitochondrial autophagy is a hypoxia-in- duced adaptive response required for preventing increased levels of ROS and cell death. Another interesting finding is that several GO processes (e.g., DNA damage responses) mediated by MEC1 are enriched in Category I hypoxic genes. MEC1 encodes a yeast homolog of the mammalian tumor suppressor ATM kinase and ensures genome integrity.
Thus, in respiring cells the up-regulation of MEC1 may pro- vide protective responses to hypoxia which can induce ROS-mediated DNA damages. GO biological processes in- volved in the syntheses of cell wall and sterol/ergosterol lipid are enriched in 109 hypoxic genes (Category II) induced in both JM43 and JM43ρ0, indicating these processes are com- mon responses to hypoxia regardless of cell’s ability to respire. Sterol lipid biosynthesis process is overrepresented in 110 hypoxic genes (Category III) induced only in JM43ρ0,
A
B C
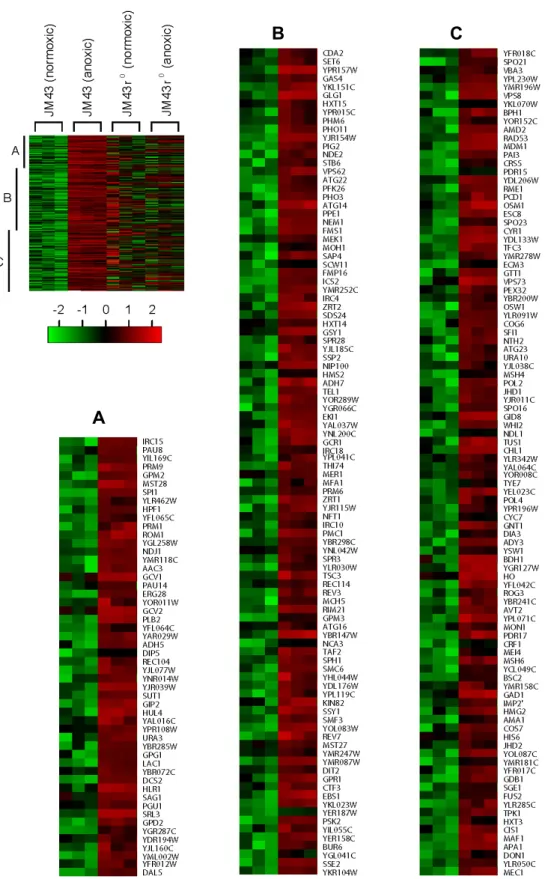
Fig. 2. Category I hypoxic genes. In a left margin, a microarray heat map shows Category I hypoxic genes that are up-regulated in anoxic JM43 cultures but not in anoxic JM43ρ0 cultures relative to their matching normoxic cultures. Red indicates an induced gene expression and green indicates a reduced gene expression according to the scale bar. Three sections (A to C) of the heat map are enlarged and gene names are represented. Each gene is represented by a single row of colored boxes. Three independent microarrays for each strain and oxygen availability are represented by three consecutively adjacent columns.
A B
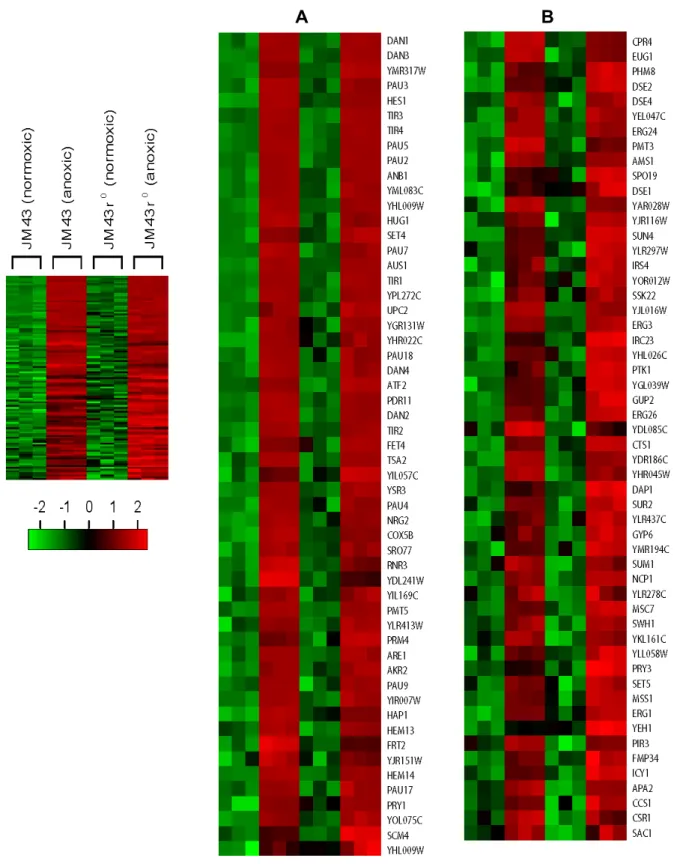
Fig. 3. Category II hypoxic genes. In a left margin, a microarray heat map shows Category II hypoxic genes that are up-regulated in both anoxic JM43 cultures and anoxic JM43ρ0 cultures relative to their matching normoxic cultures. Red indicates an induced gene expression and green indicates a reduced gene expression according to the scale bar. Two sections (A and B) of the heat map are enlarged and gene names are represented. Each gene is represented by a single row of colored boxes. Three independent microarrays for each strain and oxygen availability are represented by three consecutively adjacent columns.
A B
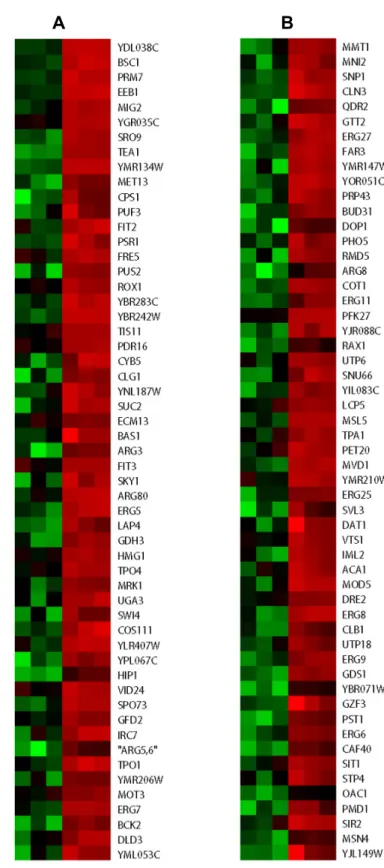
Fig. 4. Category III hypoxic genes. In a left margin, a microarray heat map shows Category III hypoxic genes that are up-regulated in anoxic JM43ρ0 cultures but not in anoxic JM43 cultures relative to their matching normoxic cultures. Red indicates an induced gene expression and green indicates a reduced gene expression according to the scale bar. Two sections (A and B) of the heat map are enlarged and gene names are represented. Each gene is represented by a single row of colored boxes.
Three independent microarrays for each strain and oxygen availability are represented by three consecutively adjacent columns.
A
B C D
Fig. 5. Category IV aerobic genes. In a left margin, a microarray heat map shows Category IV aerobic genes that are down-regulated in anoxic JM43 cultures but not in anoxic JM43ρ0 cultures relative to their matching normoxic cultures. Red indicates an induced gene expression and green indicates a reduced gene expression according to the scale bar. Four sections (A to D) of the heat map are enlarged and gene names are represented. Each gene is represented by a single row of colored boxes. Three independent microarrays for each strain and oxygen availability are represented by three consecutively adjacent columns.
A
B
Fig. 6. Category V aerobic genes. In a left margin, a microarray heat map shows Category V aerobic genes that are down- regulated in both anoxic JM43 cultures and anoxic JM43ρ0 cultures relative to their matching normoxic cultures. Red indicates an induced gene expression and green indicates a reduced gene expression according to the scale bar. Two sections (A to B) of the heat map are enlarged and gene names are represented. Each gene is represented by a single row of colored boxes. Three independent microarrays for each strain and oxygen availability are represented by three consecutively adjacent columns.
further supporting that the hypoxia-induced up-regulation of sterol/ergosterol lipid metabolism is independent of res- piration (data not shown).
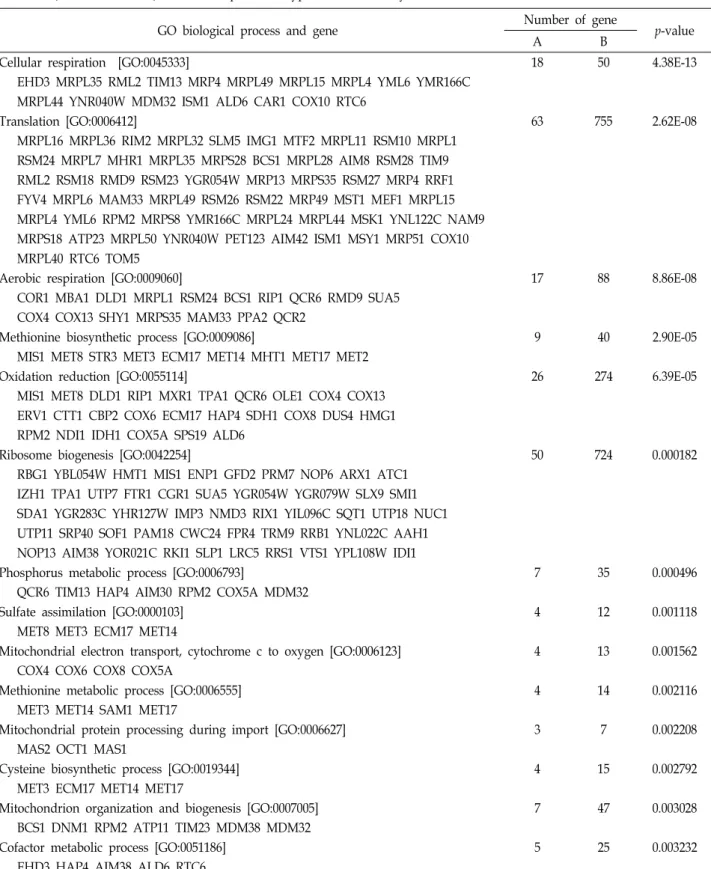
As shown in Table 2, several GO biological processes are enriched in 275 aerobic genes (Category IV) which are down-regulated exclusively in JM43. Not surprisingly, re- duced genes function in the processes requiring oxygen (e.g., respiration and oxidation). Also, genes involved in trans- lation and ribosome biogenesis are down-regulated in re- sponse to anoxia. These results are consistent with the notion that hypoxia induces rapid and dramatic changes in cellular
metabolism, in part through inhibition of target of rapamy- cin (TOR) kinase complex 1 (TORC1) activity which regu- lates protein synthesis. Therefore, under hypoxic conditions yeast cells rapidly initiate a variety of adaptive mechanisms that reduce energy expenditure through inhibition of en- ergy-intensive processes including protein translation. The reduced expression of genes involved in oxidation and trans- lation is also over-represented in 103 aerobic genes (Category V) relative to the whole genome. This finding sug- gests that down-regulation of oxidation and translation proc- esses is a common response to lack of oxygen in both respi-
A
B C D
Fig. 7. Category VI aerobic genes. In a left margin, a microarray heat map shows Category VI aerobic genes that are down-regulated in anoxic JM43ρ0 cultures but not in anoxic JM43 cultures relative to their matching normoxic cultures. Red indicates an induced gene expression and green indicates a reduced gene expression according to the scale bar. Four sections (A to D) of the heat map are enlarged and gene names are represented. Each gene is represented by a single row of colored boxes.
Three independent microarrays for each strain and oxygen availability are represented by three consecutively adjacent columns.
Table 1. Overrepresentation of Gene Ontology (GO) Biological Process in 248 Category I hypoxic genes that are up-regulated in JM43 but not in JM43ñ0 in response to hypoxia in this study
GO biological process and gene Number of gene
p-value
A B
ascospore wall assembly [GO:0030476] 10 54 2.6E-05
ADY3 DON1 DIT2 SPR3 AMA1 CDA2 SPO21 GAS4 SSP2 OSW1
autophagy [GO:0006914] 22 242 9.9E-05
VPS8 ATG14 YSW1 ATG22 POL4 GPR1 YDL133W YDL176W ADY3 CIS1 YEL023C AVT2 JHD1 BUR6 MON1 YKL070W YLR030W ATG23 HMG2 ATG16 IRC15 REV3
nucleobase, nucleoside, nucleotide and nucleic acid metabolic process [GO:0006139] 6 24 2.0E-04 MEC1 SRL3 POL2 CHL1 RAD53 REV3
regulation of Rho protein signal transduction [GO:0035023] 3 6 9.6E-04
ROM1 TUS1 FUS2
meiosis [GO:0007126] 15 165 1.3E-03
MEC1 SPO23 ADY3 DON1 MEI4 MSH4 AMA1 SPO16 REC104 CTF3 REC114 MER1 SPO21 NDJ1 MEK1
DNA damage induced protein phosphorylation [GO:0006975] 2 2 1.4E-03
TEL1 MEC1
conjugation [GO:0000746] 5 26 2.5E-03
MFA1 SPH1 PRM6 FUS2 PRM1
sporulation [GO:0030435] 11 111 2.9E-03
ADY3 DON1 DIT2 MEI4 SPR3 SPO16 CDA2 HXT14 SPO21 SSP2 OSW1
meiotic recombination [GO:0007131] 7 53 3.4E-03
MEC1 MEI4 MSH4 REC104 REC114 MER1 NDJ1
transmembrane transport [GO:0055085] 5 30 4.7E-03
YBR241C HXT15 HXT3 VPS73 HXT14
carbohydrate metabolic process [GO:0005975] 12 136 4.9E-03
SCW11 YGR287C IMP2 PGU1 CDA2 PGM3 GPD2 GAS4 HPF1 TYE7 DIP5 GDB1
ascospore formation [GO:0030437] 8 75 6.8E-03
PAU8 MEI4 AMA1 NEM1 SPO16 RIM21 SSP2 OSW1
meiotic DNA double-strand break formation [GO:0042138] 3 11 6.9E-03
MEI4 REC104 REC114
glycine metabolic process [GO:0006544] 2 4 8.0E-03
GCV1 GCV2
positive regulation of glycolysis [GO:0045821] 2 4 8.0E-03
TYE7 GCR1
NADH oxidation [GO:0006116] 3 12 9.0E-03
ADH5 NDE2 GPD2
sexual reproduction [GO:0019953] 4 23 9.8E-03
MFA1 PRM6 FUS2 PRM1
GO Biological Process number is shown in brackets and Category I hypoxic genes in a given GO Biological Process are listed.
'A' denotes number of genes from Category I hypoxic genes in a given GO Biological Process while 'B' indicates number of genes in the Process from the total 6603 genes in GO data base. The GO Biological Process enrichment p-value was calculated by hypergeometric distribution analysis.
Table 2. Overrepresentation of Gene Ontology (GO) Biological Process in 275 Category IV aerobic genes that are down-regulated in JM43 but not in JM43ñ0 in response to hypoxia in this study
GO biological process and gene Number of gene
p-value
A B
Cellular respiration [GO:0045333] 18 50 4.38E-13
EHD3 MRPL35 RML2 TIM13 MRP4 MRPL49 MRPL15 MRPL4 YML6 YMR166C MRPL44 YNR040W MDM32 ISM1 ALD6 CAR1 COX10 RTC6
Translation [GO:0006412] 63 755 2.62E-08
MRPL16 MRPL36 RIM2 MRPL32 SLM5 IMG1 MTF2 MRPL11 RSM10 MRPL1 RSM24 MRPL7 MHR1 MRPL35 MRPS28 BCS1 MRPL28 AIM8 RSM28 TIM9 RML2 RSM18 RMD9 RSM23 YGR054W MRP13 MRPS35 RSM27 MRP4 RRF1 FYV4 MRPL6 MAM33 MRPL49 RSM26 RSM22 MRP49 MST1 MEF1 MRPL15 MRPL4 YML6 RPM2 MRPS8 YMR166C MRPL24 MRPL44 MSK1 YNL122C NAM9 MRPS18 ATP23 MRPL50 YNR040W PET123 AIM42 ISM1 MSY1 MRP51 COX10 MRPL40 RTC6 TOM5
Aerobic respiration [GO:0009060] 17 88 8.86E-08
COR1 MBA1 DLD1 MRPL1 RSM24 BCS1 RIP1 QCR6 RMD9 SUA5 COX4 COX13 SHY1 MRPS35 MAM33 PPA2 QCR2
Methionine biosynthetic process [GO:0009086] 9 40 2.90E-05
MIS1 MET8 STR3 MET3 ECM17 MET14 MHT1 MET17 MET2
Oxidation reduction [GO:0055114] 26 274 6.39E-05
MIS1 MET8 DLD1 RIP1 MXR1 TPA1 QCR6 OLE1 COX4 COX13 ERV1 CTT1 CBP2 COX6 ECM17 HAP4 SDH1 COX8 DUS4 HMG1 RPM2 NDI1 IDH1 COX5A SPS19 ALD6
Ribosome biogenesis [GO:0042254] 50 724 0.000182
RBG1 YBL054W HMT1 MIS1 ENP1 GFD2 PRM7 NOP6 ARX1 ATC1 IZH1 TPA1 UTP7 FTR1 CGR1 SUA5 YGR054W YGR079W SLX9 SMI1 SDA1 YGR283C YHR127W IMP3 NMD3 RIX1 YIL096C SQT1 UTP18 NUC1 UTP11 SRP40 SOF1 PAM18 CWC24 FPR4 TRM9 RRB1 YNL022C AAH1 NOP13 AIM38 YOR021C RKI1 SLP1 LRC5 RRS1 VTS1 YPL108W IDI1
Phosphorus metabolic process [GO:0006793] 7 35 0.000496
QCR6 TIM13 HAP4 AIM30 RPM2 COX5A MDM32
Sulfate assimilation [GO:0000103] 4 12 0.001118
MET8 MET3 ECM17 MET14
Mitochondrial electron transport, cytochrome c to oxygen [GO:0006123] 4 13 0.001562 COX4 COX6 COX8 COX5A
Methionine metabolic process [GO:0006555] 4 14 0.002116
MET3 MET14 SAM1 MET17
Mitochondrial protein processing during import [GO:0006627] 3 7 0.002208
MAS2 OCT1 MAS1
Cysteine biosynthetic process [GO:0019344] 4 15 0.002792
MET3 ECM17 MET14 MET17
Mitochondrion organization and biogenesis [GO:0007005] 7 47 0.003028
BCS1 DNM1 RPM2 ATP11 TIM23 MDM38 MDM32
Cofactor metabolic process [GO:0051186] 5 25 0.003232
EHD3 HAP4 AIM38 ALD6 RTC6
GO Biological Process number is shown in brackets and Category I hypoxic genes in a given GO Biological Process are listed.
'A' denotes number of genes from Category I hypoxic genes in a given GO Biological Process while 'B' indicates number of genes in the Process from the total 6603 genes in GO data base. The GO Biological Process enrichment p-value was calculated by hypergeometric distribution analysis.
Table 3. Enrichment of putative transcription factors involved in regulation of hypoxic genes identified in this study
Category Transcription factor Number of genes
p-value
in cluster in genome
Category I hypoxic genes up-regulated in JM43 but not in JM43ρ0 (n=248) Sok2p
Aft1p Rpn4p Msn2p Rox1p Upc2p Mot3p Sut1p
64 56 49 48 35 13 12 8
999 708 814 511 346 208 131 68
9.1E-06 5.9E-08 5.8E-04 3.7E-09 1.2E-07 5.2E-02 4.4E-03 4.6E-03 Category II hypoxic genes up-regulated in both JM43 and JM43ρ0 (n=109)
Upc2p Sok2p Rox1p Ecm22p
Rap1p Sut1p Mot3p Mga2p
46 44 36 33 30 20 14 4
208 999 346 269 1191
68 131
27
< 1.0E-10 1.7E-10
< 1.0E-10
< 1.0E-10 9.5E-03
< 1.0E-10 4.0E-08 1.1E-03 Category III hypoxic genes up-regulated in JM43ρ0 but not in JM43 (n=110)
Sok2p Yap1p Rap1p Pdr1p Phd1p Fhl1p Rox1p Upc2p Mot3p
41 37 30 25 24 23 14 10 7
999 1551 1191 528 450 844 346 208 131
1.1E-08 1.0E-02 1.1E-02 1.6E-06 3.3E-07 1.1E-02 1.9E-03 2.6E-03 6.5E-03 A web-based computational tool in the YEASTRACT database (www. yeastract.com; Teixeira et al., 2006) was used for identi- fication of putative transcription factors involved in hypoxic genes identified in this study. Enrichment of a transcription factor in a given Category relative to the whole yeast genome was calculated by hypergeometric distribution analysis and magnitude of the enrichment is indicated by the p-value.
ration-proficient and respiration-deficient cells. In 300 aero- bic genes (Category VI), GO biological processes involved in sporulation and meiosis are enriched in response to hypo- xia, implying that the hypoxia-induced reduction of some genes involved in sporulation and meiosis is independent of respiration (data not shown).
Computational promoter analyses of hypoxic genes identified in this study using YEASTRACT
Recent studies on transcriptional response to oxygen availability in yeast have implicated several transcription factors as key mediators during hypoxic signaling [3, 8, 17-20, 22-23, 25, 31]. These transcription factors include Rox1p, Upc2p, Mot3p, Sut1p, Mga2p, Yap1p, and Msn2p.
In order to examine their roles in transcriptional network underlying the induction of hypoxic genes, we have clus- tered hypoxic genes identified in this study based on their regulatory associations with the known transcription factors (e.g., Rox1p, Upc2p, Mot3p, Sut1p, Mga2p, Yap1p, and Msn2p) using the YEASTRACT database (www.yeastract.
com) [28]. Currently, this database contains a repository of more than 48,333 regulatory associations between tran- scription factors and target genes in yeast. Because the YEASTRACT transcriptional regulatory information is based on experimental evidence from published results, this bio- informatics tool may provide substantial insights into tran- scription regulatory network for a group of co-regulated genes. As shown in Table 3, YEASTRACT computational
Table 4. YEASTRACT documented targets of Rox1p in hypoxic genes identified in this study
Category Rox1p-target gene
Category I hypoxic genes up-regulated in JM43 but not in JM43ρ0 (n=248) AAC3
GIP2 PRM6 YMR252c
ADH5 GPG1 SPI1 YNL200c
ADH7 GPM2 SUT1 YNR014w
CYC7 GSY1 USV1 YOL083w
DCS2 HMG2 YAL068c YPR015c
DIP5 HPF1 YFR012w
EKI1 HXT15 YGR066c
ERG28 LAC1 YGR287c
GDB1 MCH5 YIL169c
GID8 PRM1 YIL176c
Category II hypoxic genes up-regulated in both JM43 and JM43ρ0 (n=109) ANB1
GUP2 PAU5 TSA2
ARE1 GYP6 PAU7 UPC2
COX5b HAP1 PRM4 YEL047c
CSR1 HEM13 RNR3 YIL169c
DAN1 HEM14 SCM4 YLL064c
ERG26 HES1 SPO19 YML083c
ERG3 IRC23 SUR2
EUG1 NCP1 TIR1
FET4 NRG2 TIR2
FRT2 PAU4 TIR3
Category III hypoxic genes up-regulated in JM43ρ0 but not in JM43 (n=110)
COT1
ROX1
CYB5 VID24
ERG11 YDL038c
ERG25 YGR035c
ERG6
ERG7
ERG9
FIT2
FIT3
LAP4 analysis has confirmed that Rox1p, Upc2p, and Mot3p are
transcriptional regulators enriched in all Categories I-III hy- poxic genes relative to the whole genome. In addition, we here identified Sok2 as a predominant transcription factor for all Categories I-III hypoxic genes. Because Sok2 has been implicated in the cyclic AMP (cAMP)-dependent protein kin- ase (PKA) signal transduction pathway (Ref), our results suggest a possible involvement of PKA signaling in hypoxic gene induction.
From Table 3, Rox1p, Upc2, Sok2p, Aft1p, Rpn4p, and Sut1p were identified as documented transcription factors for Category I hypoxic genes induced only in JM43. Msn2p, which is activated under stress conditions, is also suggested to be regulating Category I hypoxic genes. In contrast, Msn2p was not identified as a potential regulator for Categories II and III hypoxic genes in which are up-regu- lated in JM43ρ0. This finding is further supported by the fact that JM43ρ0 experiences lower levels of oxidative stress rela- tive to JM43 [11]. For Category II hypoxic genes induced in both JM43 and JM43ρ0, Upc2p and Rox1p were identified as major documented regulators and are associated with 42.2% and 33.0% of the hypoxic gene in this cluster, re- spectively. Furthermore, Sok2p, Ecm22p, Rap1p, and Sut1p were also identified as the putative regulators of Category II. For Category III hypoxic genes induced exclusively in JM43ρ0, the YEASTRACT computational clustering indicated that Sok2p, Yap1, Rap1p, Phd1p, Fhl1p, Rox1p, Upc2p, and Mot3p are mediating transcriptional regulation.
In addition, for Category I-III hypoxic genes, we have ex- amined YEASTRACT documented targets of Rox1p, a major
regulator of hypoxic genes (Table 4). Many of these genes (ERG3, ERG6, ERG7, ERG9, ERG11, ERG25, ERG26, ERG28, HES1, and HMG2) are involved in lipid, ergosterol, and ster- ol biosynthesis. Genes implicated in stress response and cell wall synthesis, such as DAN1, FRT2, PAU4, PAU5, PAU7, PAU8, PAU14, PAU18, TIR1, TIR2, and TIR3, were also iden- tified as documented targets of Rox1p. Interestingly, Rox1p has implicated in the induction of several Category III hy- poxic genes up-regulated only in anoxic JM43ρ0 including COT1, CYB5, and several ERG genes. The presence of Rox1p targets in Category III hypoxic genes by YEASTRACT com- putational analysis suggests that Rox1p stabilization/activa- tion under hypoxia can be independent of respiration.
In summary, the present study we have examined whole genomic responses to hypoxia in yeast using DNA micro- arrays. In both respiration-proficient and respiration-defi- cient yeast cells, we have identified transcriptional changes in many genes that cover a substantial portion of yeast whole genome. We have categorized these oxygen-regulated hypoxic and aerobic genes with respect to dependence on respiration, i.e., the mitochondrial respiratory chain, for their expression pattern under hypoxia. Each category of hypoxic and aerobic genes are listed and further analyzed for gene ontology. In addition, we provided a computational pro- moter analysis for hypoxic genes identified in the study. We found that the majority of hypoxic genes and aerobic genes need the mitochondrial respiratory chain for their expression under hypoxia. However, we also found that there are some hypoxic and aerobic genes whose expression under hypoxia is independent of the mitochondrial respiratory chain.
Together, these results indicate a key involvement of the mi- tochondrial respiratory chain in oxygen-regulated gene ex- pression and multiple mechanisms for controlling oxy- gen-regulated gene expression.
Acknowledgment
This study was supported by a grant of the Ministry of Science, ICT & Future Planning (2014R1A1A2A16055714).
References
1. Ashburner, M., Ball, C. A., Blake, J. A., Botstein, D., Butler, H., Cherry, J. M., Davis, A. P., Dolinski, K., Dwight, S. S., Eppig, J. T., Harris, M. A., Hill, D. P., Issel-Tarver, L., Kasar- skis, A., Lewis, S., Matese, J. C., Richardson, J. E., Ringwald, M., Rubin, G. M. and Sherlock, G. 2000. Gene ontology: tool for the unification of biology. The gene ontology consor- tium. Nat. Genet. 25, 25-29.
2. Bates, D. M., Bolstad, B., Dettling, M., Dudoit, S., Ellis, B., Gautier, L., Ge, Y., Gentry, J., Hornik, K., Hothorn, T., Huber, W., Iacus, S., Irizarry, R., Leisch, F., Li, C., Maechler, M., Rossini, A. J., Sawitzki, G., Smith, C., Smyth, G., Tierney, L., Yang, J. Y. and Zhang, J. 2004. Bioconductor: open soft- ware development for computational biology and bio- informatics. Genome Biol. 5, R80.
3. Becerra, M., Lombardía-Ferreira, L. J., Hauser, N. C., Hoheisel, J. D., Tizon, B. and Cerdan, M. E. 2002. The yeast transcriptosome in aerobic and hypoxic conditions: effects of hap1, rox1, rox3, and srb10 deletions. Mol. Microbiol. 43, 545-555.
4. Benjamini, Y. and Hochberg, Y. 1995. Controlling the false discovery rate: a practical and powerful approach to multi- ple testing. J. Roy. Stat. Soc. B. 57, 289-300.
5. Brunelle, J. K., Bell, E. L., Quesada, N. M., Vercauteren, K., Tiranti, V., Zeviani, M., Scarpulla, R. C. and Chandel, N.
S. 2005. Oxygen sensing requires mitochondrial ROS but not oxidative phosphorylation. Cell Metab. 1, 409-414.
6. Bunn, H. F. and Poyton, R. O. 1996. Oxygen sensing and molecular adaptation to hypoxia. Physiol. Rev. 76, 839-885.
7. Castello, P. R., Woo, D. K., Ball, K., Wojcik, J., Liu, L. and Poyton, R. O. 2008. Oxygen-regulated isoforms of cyto- chrome c oxidase have differential effects on its nitric oxide production and on hypoxic signaling. Proc. Natl. Acad. Sci.
USA 105, 8203-8208.
8. Chan, K. and Roth, M. B. 2008. Anoxia-induced suspended animation in budding yeast as an experimental paradigm for studying oxygen-regulated gene expression. Eukaryot.
Cell 7, 1795-1808.
9. Chandel, N. S., Malteppe, E., Goldwasser, E., Mathieu, C.
E., Simon, M. C. and Schumacker, P. T. 1998. Mitochondrial reactive oxygen species trigger hypoxia-induced tran- scription. Proc. Natl. Acad. Sci. USA 95, 11715-11720.
10. Chandrel, Y., Gaisne, C., Lions, C. and Verdiere, J. 1998.
The transcriptional regulator Hap1p (Cyp1p) is essential for anaerobic or heme-deficient growth of Saccharomyces cerevisiae. Genetic and molecular characterization of an ex- tragenic suppressor that encodes a WD repeat protein.
Genetics 148, 559-569.
11. Dirmeier, R., O'Brien, K. M., Engle, M., Dodd, A., Spears, E. and Poyton, R. O. 2002. Exposure of yeast cells to anoxia induces transient oxidative stress: implications for the in- duction of hypoxic genes. J. Biol. Chem. 277, 34773-34784.
12. Eisen, M. B., Spellman, P. T., Brown, P. O. and Botstein, D. 1998. Cluster analysis and display of genome-wide ex- pression patterns. Proc. Natl. Acad. Sci. USA 95, 14863-14868.
13. Elder, R. T., Loh, E. Y. and Davis, R. W. 1983. RNA from the yeast transposable element Ty1 has both ends in the direct repeats, a structure similar to retrovirus RNA. Proc.
Natl. Acad. Sci. USA 80, 2432-2436.
14. Guzy, R. D., Mack, M. M. and Schumacker, P. T. 2007.
Mitochondrial complex III is required for hypoxia-induced ROS production and gene transcription in yeast. Antioxid.
Redox. Signal. 9, 1317-1328.
15. Hochachka, P. W., Buck, L. T., Doll, C. J. and Land, S. C.
1996. Unifying theory of hypoxia tolerance: molecular/met- abolic defense and rescue mechanisms for surviving oxygen lack. Proc. Natl. Acad. Sci. USA 93, 9493-9498.
16. Irizarry, R. A., Hobbs, B., Collin, F., Beazer-Barclay, Y. D., Antonellis, K. J., Scherf, U. and Speed, T. P. 2003. Explora- tion, normalization, and summaries of high density oligonu- cleotide array probe level data. Biostatistics 4, 249-264.
17. Jiang, Y., Vasconcelles, M. J., Wretzel, S., Light, A., Gilooly, L., McDaid, K., Oh, C. S., Martin, C. E. and Goldberg, M.
2002. Mga2p processing by hypoxia and unsaturated fatty acids in Saccharomyces cerevisiae: impact on LORE-de- pendent gene expression. Eukaryotic Cell 1, 481-490.
18. Kastaniotis, A. J. and Zitomer, R. S. 2000. ROX1 mediated repression. Adv. Exptl. Med. Biol. 475, 185-195.
19. Kastaniotis, A. J., Mennella, T. A., Konrad, C., Torres, A.
M. and Zitomer, R. S. 2000. Roles of transcription factor Mot3 and chromatin in repression of the hypoxic gene ANB1 in yeast. Mol. Cell Biol. 20, 7088-7098.
20. Kundaje, A., Xin, X., Lan, C., Lianoglou, S., Zhou, M., Zhang, L. and Leslie, C. 2008. A predictive model of the oxygen and heme regulatory network in yeast. PLoS.
Comput. Biol. 4, e1000224.
21. Kwast, K. E., Burke, P. V., Staahl, B. and Poyton, R. O. 1999.
Oxygen sensing in yeast: Evidence for the involvement of the respiratory chain in regulating the transcription of a sub- set of hypoxic genes. Proc. Natl. Acad. Sci. USA 96, 5446-5451.
22. Kwast, K. E., Lai, L. C., Menda, N., Jemes, D. T., Aref, S.
and Burke, P. V. 2002. Genomic analysis of anaerobically induced genes in Saccharomyces cerevisiae: functional roles of Rox1 and other factors in mediating anoxic response. J.
Bacteriol. 184, 250-265.
23. Lai, L. C., Kosorukoff, A. L., Burke, P. V. and Kwast, K.
E. 2005. Dynamical remodeling of the transcritosome during short-term anaerobiosis in Saccharomyces cerevisae: differ- ential respone and role of Msn2 and/or Msn4 and other
초록:저산소 환경에 대한 전체 유전자 발현 반응에서 미토콘드리아 호흡계의 연루
이보영1․이종환2․변준호3*․우동균1*
(1경상대학교 약학과, 2동의대학교 생명공학과, 3경상대학교병원)
세포는 다양한 인체 질환에 관련되어 있는 저산소 환경을 인지하고 반응하며 적응한다. 저산소 상태에 적응하 기 위해서는 hypoxic 유전자의 발현을 증가시키고 aerobic 유전자의 발현을 감소시키는 유전자 발현 조절이 필요 하다. 최근 연구에서 미토콘드리아 호흡계가 이러한 유전자 발현 조절에 관여됨이 밝혀지고 있다. 본 연구에서는 호흡이 가능한 곰팡이(Saccharomyces cerevisiae)와 호흡이 불가능한 돌연변이 곰팡이를 실험대상으로 하여 미토콘 드리아 호흡계가 저산소 환경에서 유전자 발현 조절에 관여됨을 DNA microarray 기법을 이용하여 전체 유전자 를 대상으로 조사하였다. 산소 농도가 감소함에 반응하여 많은 유전자의 발현에 변화가 있었으며, 이러한 차별적 인 발현 양상을 보이는 유전자는 여러 그룹으로 분류할 수 있었다. 대부분의 hypoxic 그리고 aerobic 유전자는 저산소 상태에 적응하는 발현 양상을 위해서는 미토콘드리아 호흡계가 필요하였다. 그러나 일부 hypoxic 그리고 aerobic 유전자는 미토콘드리아 호흡계와 무관하게 저산소 상태에 적응하는 발현 양상을 보였다. 이러한 결과는 미토콘드리아 호흡계가 저산소 환경에 적응하는 유전자 발현 조절에 필요하며, 또한 여러 기전을 통하여 이러한 유전자 발현 조절에 관여함을 제시한다. 또한 microarray 실험 결과에서 도출된 산소 농도에 대해 차별적인 발현 을 보이는 유전자에 대하여 gene ontology 및 promoter 분석을 수행하였고 이러한 추가 분석 결과는 산소에 의해 조절되는 유전자와 함께 세포가 저산소 환경에 적응하는 기작을 이해하는 데 유용한 자료가 될 것으로 기대된다.
factors in galactose and glucose media. Mol. Cell Biol. 25, 4075-4091.
24. McEwen, J. E., Ko, C., Kloeckner-Gruissem, B. and Poyton, R. O. 1986. Nuclear functions required for cytochrome c oxi- dase biogenesis in Saccharomyces cerevisiae. Characterization of mutants in 34 complementation groups. J. Biol. Chem. 261, 11872-11879.
25. Pfeifer, K., Kim, K. S., Kogan, S. and Guarente, L. 1989.
Functional dissection and sequence of yeast HAP1 activator.
Cell 56, 291-301.
26. Poyton, R. O. 1999. Models for oxygen sensing in yeast: im- plications for oxygen-regulated gene expression in higher eucaryotes. Respir. Physiol. 115, 119-133.
27. Robinson, M. D., Grigull, J., Mohammad, N. and Hughes, T. R. 2002. FunSpec: a web-based cluster interpreter for yeast. BMC Bioinformatics 3, 35.
28. Teixeira, M. C., Monteiro, P., Jain, P., Tenreiro, S., Fer- nandes, A. R., Mira, N. P., Alenquer, M., Freitas, A. T.,
Oliveira, A. L. and Sa-Correia, I. 2006. The YEASTRACT database: a tool for the analysis of transcription regulatory associations in Saccharomyces cerevisiae. Nucleic Acids Res. 34, D446-D451.
29. Waterland, R. A., Basu, A., Chance, B. and Poyton, R. O.
1991. The isoforms of yeast cytochrome c oxidase subunit V alter the in vivo kinetic properties of the holoenzyme. J.
Biol. Chem. 266, 4180-4186.
30. Zhang, H., Bosch-Marce, M., Shimoda, L. A., Tan, Y. S., Baek, J. H., Wesley, J. B., Gonzalez, F. J. and Semenza, G.
L. 2008. Mitochondrial autophagy is an HIF-1-dependent adaptive metabolic response to hypoxia. J. Biol. Chem. 283, 10892-10903.
31. Zitomer, R. S., Limbach, M. P., Rodriguez-Torres, A. M., Balasubramanian, B., Deckert, J. and Snow, P. M. 1997.
Approaches to study Rox1 repression of the hypoxic genes in yeast Saccharomyces cerevisiae. Methods 11, 279-288.