Introduction
Although reactive oxygen species (ROS) are produced as a by- product of oxygen metabolism, they play a significant role in nor- mal cellular functions [1,2]. A well-organized antioxidant system maintains the physiological levels of ROS [3]. However, an imbal- ance between ROS production and antioxidant capacity causes ROS accumulation, which induces chemical modifications of DNA, protein, and lipids, leading to cellular damage, known as oxi- dative stress [1-3].
Oxidative stress is closely linked to a variety of diseases, includ- ing type 2 diabetes [1]. Type 2 diabetes is increasing globally due to the obesity pandemic and the growth of the aging population, and insulin resistance is a critical link between these two. Insulin re- sistance is known to be a critical risk factor for type 2 diabetes and other chronic diseases, such as cardiovascular diseases and cancers [4]. It is known that hyperglycemia in diabetic patients leads to se-
Can antioxidants be effective therapeutics for type 2 diabetes?
Soyoung Park, So-Young Park
Department of Physiology and Smart-aging Convergence Research Center, Yeungnam University College of Medicine, Daegu, Korea
The global obesity epidemic and the growing elderly population largely contribute to the increas- ing incidence of type 2 diabetes. Insulin resistance acts as a critical link between the present obesity pandemic and type 2 diabetes. Naturally occurring reactive oxygen species (ROS) regulate intracellular signaling and are kept in balance by the antioxidant system. However, the imbalance between ROS production and antioxidant capacity causes ROS accumulation and induces oxida- tive stress. Oxidative stress interrupts insulin-mediated intracellular signaling pathways, as sup- ported by studies involving genetic modification of antioxidant enzymes in experimental rodents.
In addition, a close association between oxidative stress and insulin resistance has been reported in numerous human studies. However, the controversial results with the use of antioxidants in type 2 diabetes raise the question of whether oxidative stress plays a critical role in insulin resis- tance. In this review article, we discuss the relevance of oxidative stress to insulin resistance based on genetically modified animal models and human trials.
Keywords: Antioxidants; Insulin resistance; Oxidative stress; Reactive oxygen species
Yeungnam Univ J Med 2021;38(2):83-94 https://doi.org/10.12701/yujm.2020.00563
Received: July 7, 2020 Revised: August 19, 2020 Accepted: August 31, 2020 Corresponding author:
So-Young Park, MD, PhD Department of Physiology, Yeungnam University College of Medicine, 170 Hyeonchung-ro, Nam-gu, Daegu 42415, Korea Tel: +82-53-640-6923 E-mail: [email protected]
rious complications by enhancing oxidative stress in the heart, kid- ney, and eyes [2]. Recently, oxidative stress has also been suggested to be a cause of insulin resistance [3,5]. Oxidative stress is in- creased in the plasma and tissue of patients and experimental ani- mals with type 2 diabetes. Genetic modulation of antioxidant en- zymes in rodents also supports the causative role of oxidative stress in insulin resistance. However, the inconsistent effects of antioxi- dant treatment on type 2 diabetes raise the question of whether ox- idative stress induces insulin resistance. Thus, we sought to identify the role of oxidative stress in the development of insulin resistance based on animal experiments and human trials.
Reactive oxygen species and antioxidant systems
ROS are defined as oxygen-containing reactive species and include superoxide anion, hydrogen peroxide, hydroxyl radical, peroxyni-
Copyright © 2021 Yeungnam University College of Medicine
This is an Open Access article distributed under the terms of the Creative Commons Attribution Non-Commercial License (http://creativecommons.org/licenses/by-nc/4.0/) which permits unrestricted non-commercial use, distribution, and reproduction in any medium, provided the original work is properly cited.
trite, hypochlorous acid, and singlet oxygen [6]. The mitochondria electron transport chain, cell membrane nicotinamide-adenine di- nucleotide phosphate (NADPH) oxidase, cytochrome p450, and xanthine oxidase are the main intracellular sites of ROS generation, and among them, mitochondria is the primary source of ROS [7].
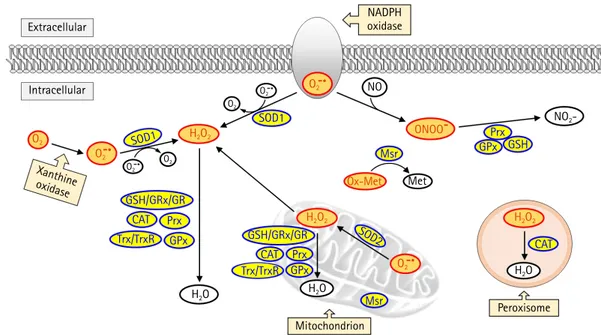
In the mitochondria, the generated superoxide anion is convert- ed into hydrogen peroxide superoxide dismutase 2 (SOD2). Sub- sequently, hydrogen peroxide is detoxified to form water in the presence of antioxidant enzymes such as glutathione peroxidase (GPx) or peroxidase or is exported to the cytoplasm (Fig. 1). Su- peroxide anions are also generated in the cell membrane and cyto- plasm by NADPH oxidase and xanthine oxidase, respectively. In the cytoplasm, superoxide dismutase 1 (SOD1) catalyzes the con- version of superoxide anion to hydrogen peroxide, which is then detoxified to form water by enzymatic or nonenzymatic antioxi- dants, including glutathione, GPx, catalase, peroxiredoxin, and thi- oredoxin. In addition, catalase is a primary antioxidant that catalyz- es hydrogen peroxide formation in the peroxisome. Oxidized me- thionine is reduced by methionine sulfoxide reductase in the cyto- plasm, mitochondria, and endoplasmic reticulum. Moreover, per- oxynitrite, produced by the reaction between nitric oxide and su- peroxide anion, and responsible for a wide array of tissue damage,
is decomposed by peroxiredoxin, glutathione, and GPx [8,9].
Even though the intracellular antioxidant system is well devel- oped to prevent ROS accumulation, ROS production can over- whelm the antioxidant capacity and induce oxidative damage to DNA, protein, and lipids.
Insulin signaling pathways
An increase in blood glucose levels after a meal induces insulin se- cretion from pancreatic β-cells, which leads to glucose uptake in skeletal muscle and adipose tissue by activating intracellular insulin signaling pathways. In the liver, insulin suppresses glycogen break- down and gluconeogenesis while increasing glucose oxidation and glycogen synthesis. Inhibition of insulin signaling pathways in these peripheral tissues results in the development of insulin resis- tance. In this review, we will focus on insulin resistance in skeletal muscle (Fig. 2).
Secreted insulin binds to insulin receptors on the plasma mem- brane and promotes autophosphorylation of tyrosine residues in the beta-subunit of the insulin receptor [10]. The activation of the insu- lin receptor immediately induces tyrosine phosphorylation of the in- sulin receptor substrate (IRS) proteins, which are initial downstream
Extracellular
NADPH oxidase
Mitochondrion
H2O H2O
H2O Met
NO
NO2-
Peroxisome GSH/GRx/GR
GSH/GRx/GR SOD1 H2O2
H2O2
Ox-Met
H2O2
O2
O2
O2
Msr
CAT
CAT Prx
Msr Trx/TrxR
SOD1
SOD2 Trx/TrxR
Prx
Prx GPx
CAT GSH
GPx
GPx Xanthine
oxidase Intracellular
O2 O2
O2
ONOO
O2 O2
Fig. 1. Intracellular reactive oxygen species (ROS) generation and the antioxidant scavenging system. ROS is produced from
mitochondria, peroxisome, nicotinamide-adenine dinucleotide phosphate (NADPH) oxidase, and xanthine oxidase. Among these sources,
the mitochondrial electron transport chain is the primary source for ROS production. Superoxide dismutase 2 (SOD2) catalyzes the
conversion of superoxide anion (O
2–) into hydrogen peroxide (H
2O
2) in the mitochondria. The H
2O
2is then detoxified in the mitochondria
or moves to the cytoplasm. Cytoplasmic superoxide anion is generated from NADPH oxidase and xanthine oxidase, and subsequently
converted into H
2O
2by superoxide dismutase 1 (SOD1). H
2O
2is detoxified by glutathione (GSH)/glutaredoxin (GRx)/glutathione reductase
(GR), catalase (CAT), peroxiredoxin (Prx), thioredoxin (Trx)/thioredoxin reductase (TrxR), and glutathione peroxidase (GPx). Oxidized
methionine (Ox-Met) is reduced by methionine sulfoxide reductase (Msr) to methionine (Met). Nitric oxide (NO) reacts with superoxide
anion to form peroxynitrite (ONOO
–), which is detoxified by Prx, GSH, and GPx.
substrates of insulin signaling [11]. Phosphorylated IRS contains binding sites for numerous signal transduction partners with Src ho- mology 2 domains, such as phosphatidylinositol 3-kinases (PI3K) [12]. Activated PI3K generates phosphatidylinositol (3,4,5)-triphos- phate (PIP
3) by catalyzing the phosphorylation of phosphatidyli- nositol 4,5-bisphosphate [13]. PIP
3induces the activation of protein kinase B (AKT), which is a key divergence point in the insulin signal- ing pathway [14]. Activation of AKT is induced via phosphorylation of threonine and serine residues by phosphatidylinositide-depen- dent protein kinase 1 and mammalian target of rapamycin complex 2 [15]. Subsequently, activated AKT phosphorylates numerous downstream substrates, including forkhead box protein O1 (FOXO1), AKT substrate of 160 kDa (AS160), and glycogen syn- thase kinase 3 (GSK3) [16]. The phosphorylation of GSK3 releases the inhibitory effect of GSK3 on glycogen synthase, leading to in- creased glycogen synthesis [17]. Furthermore, the phosphorylation of FOXO1 suppresses FOXO1-regulated expression of pyruvate de- hydrogenase kinase 4 [18]. Phosphorylated AS160 mediates the translocation of the glucose transporter type 4 (GLUT4) from the cytoplasm to the plasma membrane [19]. This reaction ultimately completes the action of insulin by increasing glucose utilization and storage, as well as promoting glucose uptake in the tissues.
Oxidative stress and insulin resistance
The insulin-mediated signaling pathway plays a crucial role in low- ering blood glucose and regulating overall glucose metabolism in
vivo. A reduction in the biological effect of insulin is called insulinresistance, in which blood glucose cannot be used effectively as an energy source due to decreased insulin responsiveness of insu- lin-sensitive tissues such as skeletal muscle, adipose tissue, and the liver. To escape this condition, β-cells produce more insulin, but this eventually leads to β-cell exhaustion [20]. A reduction in insu- lin secretion due to β-cell exhaustion increases blood glucose lev- els, resulting in the development of type 2 diabetes [20]. Although defects in insulin receptors contribute to insulin resistance, pertur- bations in intracellular insulin signaling pathways are mostly re- sponsible for insulin resistance.
Free fatty acids (FFAs) in plasma are generally supplied through lipolysis and are used as a primary energy source through β-oxida- tion in the liver, heart, and skeletal muscle during fasting and exer- cise. However, chronically elevated levels of FFAs in the plasma are one of the key triggers leading to defects in the insulin signaling pathway [21,22]. Increased utilization of FFAs leads to the accu- mulation of fat metabolites, such as fatty acyl-coenzyme A, cera-
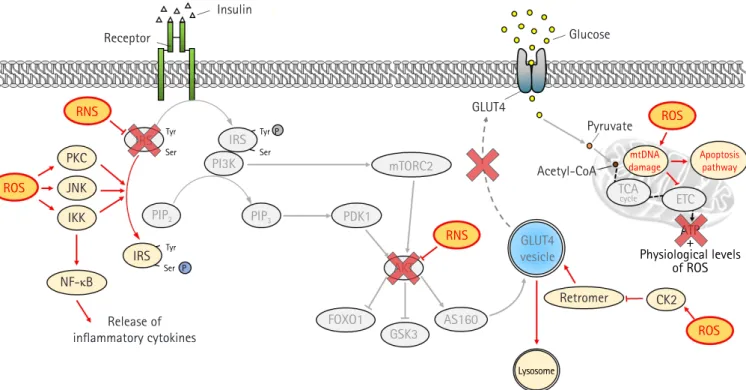
Fig. 2.Intracellular insulin signaling pathway in skeletal muscle. Binding of insulin to insulin receptors (IR) on the plasma membrane promotes tyrosine autophosphorylation at the IR, which in turn induces tyrosine phosphorylation of the IR substrate (IRS). IRS activates the downstream substrate phosphatidylinositol 3-kinases (PI3K)/protein kinase B (AKT) pathway, and the activated AKT leads to increased glucose uptake and glycogen synthesis by inducing phosphorylation of AKT substrate of 160 kDa (AS160) and glycogen synthase kinase 3 (GSK3) respectively. Activated AS160 increases glucose uptake by mediating the translocation of glucose transporter type 4 (GLUT4) from the cytoplasm to the plasma membrane. Intracellular glucose is used for adenosine triphosphate (ATP) generation and glycogen synthesis. Tyr, tyrosine; Ser, serine; PIP
2, phosphatidylinositol 4,5-bisphosphate; PIP
3, phosphatidylinositol (3,4,5)-triphosphate; PDK1, phosphatidylinositide-dependent protein kinase 1; mTORC2, mammalian target of rapamycin complex 2; FOXO1, forkhead box protein O1; GS, glycogen synthase; acetyl-CoA, acetyl coenzyme A; TCA, tricarboxylic acid cycle; ETC, electron transport chain; ROS, reactive oxygen species.
Insulin
Glucose
GLUT4
GLUT4 vesicle
Pyruvate
Glycogen
Acetyl-CoA TCA
cycle ETC
ATP+ Physiological levels
of ROS Receptor
IRS Tyr Tyr P
Ser IRS Ser
PI3K
PIP2 PIP3 PDK1
AKT mTORC2
FOXO1
GSK3
AS160
GS
mides, and diacylglycerol in the liver and skeletal muscle [23-25].
High levels of fatty acid metabolites activate serine-threonine ki- nases, including protein kinase C (PKC), c-Jun N-terminal kinase (JNK), and inhibitory κB kinase (IKK) β, leading to the suppres- sion of insulin-stimulated signaling pathways [23,26,27]. Serine phosphorylation of IRS by these serine-threonine kinases inhibits tyrosine phosphorylation of IRS by insulin, eventually reducing glucose uptake [27].
Recently, fatty acid-induced oxidative stress has drawn attention as one of the causes of insulin resistance. Increased plasma levels of FFAs enhance cellular ROS production [28]. Since mitochondria are a major source of ROS, mitochondrial overload caused by an excess of substrate has been regarded as the main cause of ROS production [29,30]. Recently, the fatty acid metabolite, ceramide, and inflammatory cytokines have also been shown to increase mi- tochondrial ROS generation [31].
Similar to fatty acid metabolites, ROS also activate PKC, IKK, and JNK, leading to inhibition of IRS tyrosine phosphorylation [28,32]
(Fig. 3). Moreover, the activation of nuclear factor-κB by IKK exacer- bates insulin resistance by increasing inflammatory cytokines [31].
ROS induce GLUT4 degradation by transporting GLUT4 to the ly- sosome instead of the plasma membrane via disruption of the ret- romer complex in a casein kinase 2-dependent manner [33]. In addi- tion, peroxynitrite produced by the accumulation of nitric oxide in- hibits the action of insulin by inducing the nitration of tyrosine resi- dues and reducing the phosphorylation of IRS-1 [34]. The activa- tion of AKT is also suppressed by peroxynitrite [35].
Increased ROS levels suppress the action of insulin by inducing mitochondrial dysfunction [36]. ROS induce mutations in the mi- tochondrial DNA, resulting in functional defects caused by altered expression of constituent proteins that are important for electron transport, such as complexes I, III, and IV [37]. These functional defects amplify oxidative stress and shut down mitochondrial en- ergy production [38]. Therefore, the vicious cycle formed be- tween ROS and mitochondria eventually leads to apoptosis.
Fig. 3.
Inhibition of the insulin signaling pathway by oxidative stress. Reactive oxygen species (ROS) interferes with insulin action by altering several substrates of the insulin signaling pathway. ROS activates serine/threonine kinases, including protein kinase C (PKC), c-Jun N-terminal kinase (JNK), and inhibitory κB kinase (IKK), which not only inhibit the activation of insulin receptor substrate (IRS) through serine phosphorylation but also induce inflammation by activating nuclear factor κB (NF-κB). In addition, ROS suppresses glucose absorption by degrading glucose transporter type 4 (GLUT4) in a casein kinase 2 (CK2)-dependent manner. Reactive nitrogen species (RNS) inhibits tyrosine phosphorylation of IRS and protein kinase B (AKT) activation by inducing nitration of tyrosine. Mitochondrial functional defects by ROS not only induce an explosive increase in oxidative stress but also suppress mitochondrial energy production, eventually leading to cell death. Tyr, tyrosine; Ser, serine; PIP
2, phosphatidylinositol 4,5-bisphosphate; PIP
3, phosphatidylinositol (3,4,5)-triphosphate;
PI3K, phosphatidylinositol 3-kinases; PDK1, phosphatidylinositide-dependent protein kinase 1; mTORC2, mammalian target of rapamycin complex 2; FOXO1, forkhead box protein O1; GSK3, glycogen synthase kinase 3; AS160, AKT substrate of 160 kDa; acetyl-CoA, acetyl coenzyme A; mtDNA, mitochondrial DNA; TCA, tricarboxylic acid cycle; ETC, electron transport chain.
Insulin Receptor
PKC ROS
RNS
RNS
ROS
mtDNA
damage Apoptosis pathway
ROS ETC mTORC2
PDK1
FOXO1 AKT
GSK3 AS160
GLUT4 vesicle PIP3
PIP2
IRS
PI3K IRS
TCAcycle
Glucose
Pyruvate
Acetyl-CoA GLUT4
Retromer CK2
Lysosome
JNK
Tyr
Tyr
Tyr P Ser
Ser P
Ser
IKK
NF-κB
IRS
Release of inflammatory cytokines
ATP+ Physiological levels
of ROS
Genetic modification of antioxidant enzymes and insulin sensitivity
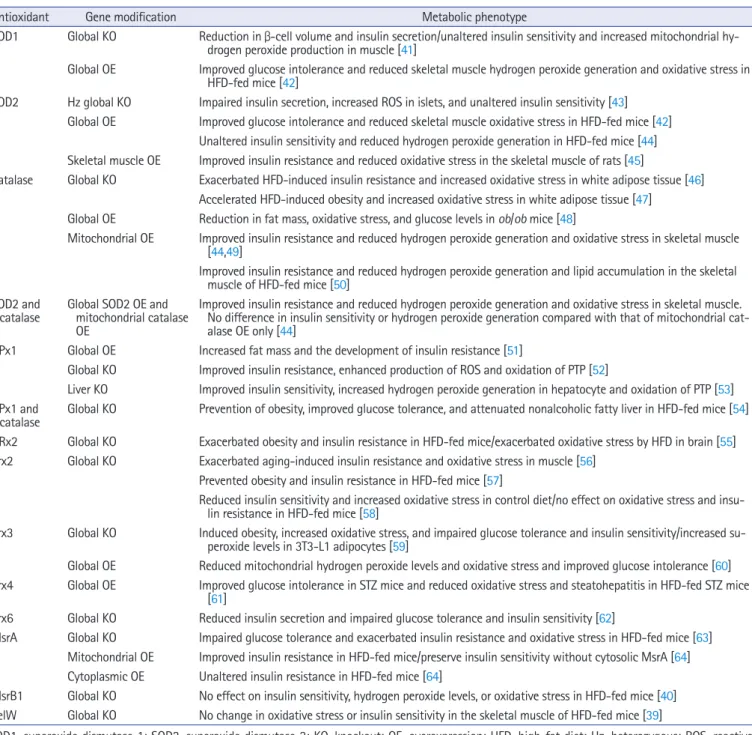
Obesity induced by a chronic high-fat diet (HFD) has been shown to increase oxidative stress accompanied by insulin resistance in in- sulin-sensitive tissues in rodents [39,40]. Generally, the genetic de- letion of antioxidant enzymes increases oxidative stress and induc- es insulin resistance and/or glucose intolerance, while overexpres-
sion of antioxidants reduces oxidative stress and improves insulin resistance and/or glucose intolerance (Table 1) [39-64].
However, although ROS levels have been altered by genetic modulation of antioxidant enzymes, some of the studies reported unaltered insulin sensitivity, especially in the case of SOD modula- tion alone (Table 1). Moreover, unexpectedly, the global knockout of GPx1 improves insulin resistance [52], whereas overexpression of GPx1 impairs insulin sensitivity [51]. Although increased ROS
Table 1. The effect of deficiency or overexpression of antioxidant enzymes on glucose metabolism and insulin sensitivity in mice
Antioxidant Gene modification Metabolic phenotype
SOD1 Global KO Reduction in β-cell volume and insulin secretion/unaltered insulin sensitivity and increased mitochondrial hy- drogen peroxide production in muscle [41]
Global OE Improved glucose intolerance and reduced skeletal muscle hydrogen peroxide generation and oxidative stress in HFD-fed mice [42]
SOD2 Hz global KO Impaired insulin secretion, increased ROS in islets, and unaltered insulin sensitivity [43]
Global OE Improved glucose intolerance and reduced skeletal muscle oxidative stress in HFD-fed mice [42]
Unaltered insulin sensitivity and reduced hydrogen peroxide generation in HFD-fed mice [44]
Skeletal muscle OE Improved insulin resistance and reduced oxidative stress in the skeletal muscle of rats [45]
Catalase Global KO Exacerbated HFD-induced insulin resistance and increased oxidative stress in white adipose tissue [46]
Accelerated HFD-induced obesity and increased oxidative stress in white adipose tissue [47]
Global OE Reduction in fat mass, oxidative stress, and glucose levels in ob/ob mice [48]
Mitochondrial OE Improved insulin resistance and reduced hydrogen peroxide generation and oxidative stress in skeletal muscle [44,49]
Improved insulin resistance and reduced hydrogen peroxide generation and lipid accumulation in the skeletal muscle of HFD-fed mice [50]
SOD2 and
catalase Global SOD2 OE and mitochondrial catalase OE
Improved insulin resistance and reduced hydrogen peroxide generation and oxidative stress in skeletal muscle.
No difference in insulin sensitivity or hydrogen peroxide generation compared with that of mitochondrial cat- alase OE only [44]
GPx1 Global OE Increased fat mass and the development of insulin resistance [51]
Global KO Improved insulin resistance, enhanced production of ROS and oxidation of PTP [52]
Liver KO Improved insulin sensitivity, increased hydrogen peroxide generation in hepatocyte and oxidation of PTP [53]
GPx1 and
catalase Global KO Prevention of obesity, improved glucose tolerance, and attenuated nonalcoholic fatty liver in HFD-fed mice [54]
GRx2 Global KO Exacerbated obesity and insulin resistance in HFD-fed mice/exacerbated oxidative stress by HFD in brain [55]
Prx2 Global KO Exacerbated aging-induced insulin resistance and oxidative stress in muscle [56]
Prevented obesity and insulin resistance in HFD-fed mice [57]
Reduced insulin sensitivity and increased oxidative stress in control diet/no effect on oxidative stress and insu- lin resistance in HFD-fed mice [58]
Prx3 Global KO Induced obesity, increased oxidative stress, and impaired glucose tolerance and insulin sensitivity/increased su- peroxide levels in 3T3-L1 adipocytes [59]
Global OE Reduced mitochondrial hydrogen peroxide levels and oxidative stress and improved glucose intolerance [60]
Prx4 Global OE Improved glucose intolerance in STZ mice and reduced oxidative stress and steatohepatitis in HFD-fed STZ mice [61]
Prx6 Global KO Reduced insulin secretion and impaired glucose tolerance and insulin sensitivity [62]
MsrA Global KO Impaired glucose tolerance and exacerbated insulin resistance and oxidative stress in HFD-fed mice [63]
Mitochondrial OE Improved insulin resistance in HFD-fed mice/preserve insulin sensitivity without cytosolic MsrA [64]
Cytoplasmic OE Unaltered insulin resistance in HFD-fed mice [64]
MsrB1 Global KO No effect on insulin sensitivity, hydrogen peroxide levels, or oxidative stress in HFD-fed mice [40]
SelW Global KO No change in oxidative stress or insulin sensitivity in the skeletal muscle of HFD-fed mice [39]
SOD1, superoxide dismutase 1; SOD2, superoxide dismutase 2; KO, knockout; OE, overexpression; HFD, high-fat diet; Hz, heterozygous; ROS, reactive oxygen species; GPx, glutathione peroxidase; PTP, protein-tyrosine phosphatase; GRx, glutaredoxin; Prx, peroxiredoxin; STZ mice, streptozotocin-injected mice; Msr, methionine sulfoxide reductase; SelW, selenoprotein W.
levels have been known to suppress insulin signaling pathways through activation of serine/ threonine kinases [65,66], paradoxi- cal activation of insulin signaling pathways by ROS through oxida- tion of protein-tyrosine phosphatase 1B has been reported in GPx1-knockout mice [52]. Therefore, increased ROS may be as- sociated with a combination of both favorable and unfavorable ef- fects on insulin sensitivity.
In addition to the results of genetically modified mouse models, the treatment of experimental animals with antioxidants, such as hemin, glutathione, vitamin C, and polyphenols, has been reported to improve insulin resistance [67-70], suggesting that a reduction in oxidative stress could be a potential therapeutic approach for type 2 diabetes.
Oxidative stress in patients with type 2 diabetes
There is a large body of evidence indicating that oxidative stress is increased in the plasma or blood cells of diabetic patients.
Compared with those in healthy glucose-tolerant individuals, the levels of biomarkers of oxidative damage to proteins [71,72], lip- ids [73-76], and DNA [74,77], such as carbonyl groups, malondialdehyde, thiobarbituric acid reactive substances, and 8-hydroxydeoxyguanosine, are increased in patients with type 2 diabetes. Moreover, these biomarker levels are positively correlat- ed with hemoglobin A1c (HbA1c) or homeostatic model assess- ment for insulin resistance (HOMA-IR) in patients with type 2 diabetes [76-79], suggesting a close link between insulin resis- tance and oxidative stress.
Oxidative stress is higher in patients with diabetes than in healthy individuals, not only in the plasma but also in insulin-sensi- tive peripheral tissues, including skeletal muscles. Higher levels of biomarkers of DNA oxidation [80] and lipid oxidation [81] have been reported in skeletal muscle tissues of diabetic patients as com- pared to healthy controls. Lipid peroxidation levels are negatively correlated with glucose disposal [81]. Moreover, in a previous study assessing nitrosative stress in diabetes, nitrites and nitrates were increased in quadriceps muscle of diabetic patients as com- pared to the control group, and nitrotyrosine levels positively cor- related with HbA1c levels [82]. However, even though the levels of oxidative stress markers are higher in patients with type 2 diabetes, some studies do not support the positive correlation between HbA1c and oxidative stress markers [83,84].
Considering the critical role of oxidative stress in the develop- ment of type 2 diabetes, the levels of oxidative stress markers are thought to increase in the prediabetic state. Consistent with this hypothesis, the plasma levels of thiobarbituric acid reactive sub-
stances have been shown to positively correlate with body mass in- dex and waist circumference in obese, nondiabetic individuals [85]. Moreover, higher levels of mitochondrial ROS have been de- tected in the skeletal muscle tissue of obese human subjects as compared with lean controls [86,87]. Higher levels of circulating FFAs might be implicated in increased ROS levels in obese sub- jects, as suggested by previous studies. Two-consecutive fat-rich meals have been shown to increase plasma malondialdehyde levels in healthy young males [88]. Additionally, in nonobese sedentary humans, overfeeding with an HFD for 28 days induced insulin re- sistance and increased muscle protein carbonylation [89]. Further- more, increased levels of carbonylated protein negatively correlated with insulin sensitivity in these overfed subjects [89].
As excess ROS are scavenged by the antioxidant system, in- creased oxidative stress in obese and type 2 diabetic subjects is fol- lowed by a reduction in antioxidant levels. Obese patients with body mass indexes above 35 kg/m
2exhibit low levels of carot- enoids and vitamin E [90]. Lower levels of vitamin E have been re- ported in plasma of patients with type 2 diabetes as compared to normal controls [91]. In the Rotterdam Study, the ferric reducing ability of plasma (FRAP) score, an index of dietary antioxidant ca- pacity, was inversely related to the insulin resistance index [92].
Moreover, increased levels of total dietary antioxidant capacity were associated with a reduced risk of type 2 diabetes in a female cohort study [93]. However, not all studies support the close rela- tionship between antioxidant levels and the risk of type 2 diabetes.
No association has been found between the serum levels of α-to- copherol or β-carotene and the risk of diabetes in middle-aged males [94]. Moreover, in a cohort study, levels of dietary antioxi- dants, including vitamin C, vitamin E, carotenoids, flavonoids and flavones, were not associated with the risk of type 2 diabetes in middle-aged male smokers [55].
Additionally, the administration of antioxidants to humans has shown controversial results. Increased dietary intake of β-carotene for 10 years have been associated with reduced risk of diabetes [95]. Vitamin C intake is associated with a reduced risk of incident diabetes in Japanese women [96]. In contrast, the administration of α-tocopherol or β-carotene does not significantly affect the oc- currence of diabetes in males [94]. Moreover, resveratrol-mediated attenuation of ROS production and oxidative damage does not af- fect HOMA-IR in patients with type 2 diabetes [97].
Based on experimental animal and human studies, oxidative
stress is closely linked to type 2 diabetes. However, the antioxidant
capacity of the serum or tissue is not consistently related to the risk
of type 2 diabetes. Additionally, the administration of antioxidants
to prediabetic and diabetic patients has produced inconsistent re-
sults. There might be several reasons for this inconsistency. A limit-
ed number of antioxidants have been assessed for antioxidant ca- pacity in serum. Additionally, it is difficult to assess the antioxidant capacity in insulin-sensitive tissues such as skeletal muscle and adi- pose tissue in humans. Serum levels of antioxidants are not always consistent with tissue levels. Furthermore, some of the currently used drugs for the treatment of type 2 diabetes have been shown to exert an antioxidant property which may conceal the therapeutic effect of vitamins and natural antioxidants in type 2 diabetes [98].
In most prospective studies, limited types of antioxidants have been used to assess the risk of type 2 diabetes. However, antioxi- dants still hold promise as potential therapeutic options for the prevention and treatment of type 2 diabetes and its complications.
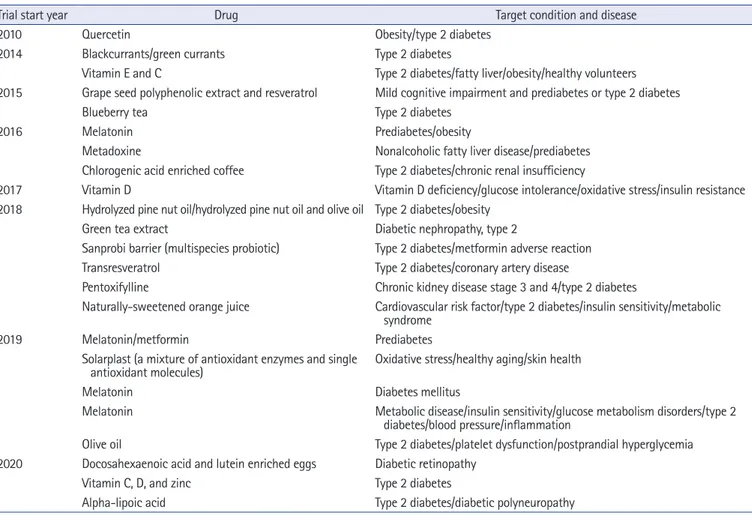
According to Clinicaltrials.gov, 23 clinical trials are recruiting or planning to recruit participants to take part in studies examining the effects of antioxidants on glucose levels or peripheral tissue compli- cations in prediabetic and type 2 diabetic patients (Table 2). Dietary and natural antioxidants from various sources and vitamins are still popular agents for clinical trials, and melatonin is emerging as a po- tential therapy for type 2 diabetes. Pharmaceuticals targeting proo- xidant and antioxidant enzymes, such as NADPH oxidase inhibi- tors, xanthine oxidase inhibitors, and SOD mimetics, are actively
being developed for the treatment of oxidative stress-related dis- eases, including type 2 diabetes [99,100].
Conclusion
Oxidative stress is elevated in obese prediabetic and type 2 diabetic experimental animals and humans. However, although experimental animal studies show promising results, the effects of antioxidant ad- ministration on type 2 diabetes in humans are still inconsistent. Nev- ertheless, clinical trials examining the therapeutic effects of dietary antioxidants and vitamins on type 2 diabetes and its complications are still ongoing. Pharmaceuticals targeting redox regulating en- zymes are actively under development, and the successful develop- ment of pharmaceuticals might help us understand the therapeutic effectiveness of antioxidants in the treatment of type 2 diabetes.
Acknowledgments
Conflicts of interest
No potential conflict of interest relevant to this article was report- ed.
Table 2. Recruiting and not yet recruiting (August 2020) clinical trials of agents with antioxidant properties targeting type 2 diabetes
Trial start year Drug Target condition and disease
2010 Quercetin Obesity/type 2 diabetes
2014 Blackcurrants/green currants Type 2 diabetes
Vitamin E and C Type 2 diabetes/fatty liver/obesity/healthy volunteers 2015 Grape seed polyphenolic extract and resveratrol Mild cognitive impairment and prediabetes or type 2 diabetes
Blueberry tea Type 2 diabetes
2016 Melatonin Prediabetes/obesity
Metadoxine Nonalcoholic fatty liver disease/prediabetes
Chlorogenic acid enriched coffee Type 2 diabetes/chronic renal insufficiency
2017 Vitamin D Vitamin D deficiency/glucose intolerance/oxidative stress/insulin resistance
2018 Hydrolyzed pine nut oil/hydrolyzed pine nut oil and olive oil Type 2 diabetes/obesity
Green tea extract Diabetic nephropathy, type 2
Sanprobi barrier (multispecies probiotic) Type 2 diabetes/metformin adverse reaction
Transresveratrol Type 2 diabetes/coronary artery disease
Pentoxifylline Chronic kidney disease stage 3 and 4/type 2 diabetes
Naturally-sweetened orange juice Cardiovascular risk factor/type 2 diabetes/insulin sensitivity/metabolic syndrome
2019 Melatonin/metformin Prediabetes
Solarplast (a mixture of antioxidant enzymes and single
antioxidant molecules) Oxidative stress/healthy aging/skin health
Melatonin Diabetes mellitus
Melatonin Metabolic disease/insulin sensitivity/glucose metabolism disorders/type 2 diabetes/blood pressure/inflammation
Olive oil Type 2 diabetes/platelet dysfunction/postprandial hyperglycemia
2020 Docosahexaenoic acid and lutein enriched eggs Diabetic retinopathy
Vitamin C, D, and zinc Type 2 diabetes
Alpha-lipoic acid Type 2 diabetes/diabetic polyneuropathy