Korean J Intern Med 2021;36(Suppl 1):S264-S272 https://doi.org/10.3904/kjim.2020.116
1Department of Internal Medicine, Inje University Seoul Paik Hospital, Seoul; 2Department of Rheumatology, Keimyung University Dongsan Medical Center, Daegu; 3Department of Preventive Medicine, Korea University College of Medicine, Seoul;
4Department of Internal Medicine, Hanyang University College of Medicine, Seoul; 5Department of Rheumatology, Hanyang University Hospital for Rheumatic Diseases, Seoul, Korea
Background/Aims: We investigated the distribution of serum uric acid (SUA) lev- els and estimated the prevalence of hyperuricemia and hypouricemia in the Kore- an population.
Methods: This cross-sectional study used data from the Korean Genome and Epi- demiology Study and included 172,970 participants (58,981 men and 113,989 wom- en) aged 40 to 79 years. Hypouricemia and hyperuricemia were defined as SUA level ≤ 2.0 mg/dL and > 7 mg/dL, respectively. The prevalence of hyperuricemia and hypouricemia was evaluated by age and sex.
Results: The mean SUA levels were significantly higher in men than in women (5.71
± 1.27 mg/dL vs. 4.21 ± 0.96 mg/dL, p < 0.001). The mean SUA levels and prevalence of hyperuricemia increased with age in women but not in men. The overall preva- lence of hyperuricemia and that in men and women was 50.82, 133.25, and 8.17 per 1,000 persons, respectively; the overall prevalence of hypouricemia and that in men and women was 4.16, 1.10, and 5.75 per 1,000 persons, respectively. The prev- alence of hypouricemia in men was similar across all age groups; however, that in women was the highest in the age group of 40 to 49 years and the lowest in the age group of 50 to 59 years.
Conclusions: The distribution of SUA levels and prevalence of hyperuricemia and hypouricemia differed according to age and sex. Age and sex should be considered in studies on uric acid-related diseases.
Keywords: Hyperuricemia; Hypouricemia; Population; Prevalence; Uric acid
Distribution of serum uric acid levels and prevalence of hyper- and hypouricemia in a Korean general population of 172,970
Bon San Koo1,*, Hye-Jin Jeong2,*, Chang-Nam Son2, Sang-Hyon Kim2, Hyun Jung Kim3, Gheun-Ho Kim4, and Jae-Bum Jun5
INTRODUCTION
Uric acid is the final product of endogenous and ex- ogenous purine nucleotide breakdown in the human body [1,2]. Approximately 70% of serum uric acid (SUA)
is excreted by the kidneys, while the remaining amount is excreted by the intestinal tract [3]. High SUA level, known as hyperuricemia, is an important risk factor for various systemic diseases, including gout, hypertension, type 2 diabetes, chronic kidney disease, and cardiovas- Received : March 26, 2020
Revised :April 30, 2020 Accepted : May 6, 2020 Correspondence to Jae-Bum Jun, M.D.
Department of Rheumatology, Hanyang University Hospital for Rheumatic Diseases, 222-1, Wangsimni-ro, Seongdong-gu, Seoul 04763, Korea
Tel: +82-2-2290-9244 Fax: +82-2-2298-8231
E-mail: [email protected] https://orcid.org/0000-0002- 0208-0505
*These authors contributed equally to this work.
cular disease [4]. In addition, low SUA level tends to be detrimental to the human body. Hypouricemia may be associated with the development of renal dysfunction [5] and neurodegenerative diseases, such as Parkinson’s disease and Alzheimer’s disease [6,7]. Since the SUA lev- el outside the normal range of values is associated with diseases, maintaining a balanced SUA level may aid in preventing the onset of associated diseases.
Many studies have reported that the distribution of SUA levels can vary depending on age, sex, and environ- mental factors [8-11]. However, no previous study has evaluated the distribution of SUA levels among Koreans using a large-scale population-based design. We investi- gated the distribution of SUA levels according to age and sex in the Korean population, including the prevalence of hyper- and hypouricemia.
METHODS
Study populationThe Korean Genome and Epidemiology Study (KoGES) is a consortium project consisting of six prospective co- hort studies categorized as population-based and gen- eral environmental model studies [12]. The data used in this study were from the health examinees (HEXA) study, which is a cohort study set up to investigate the genetic and environmental etiology of common complex dis- eases, such as type 2 diabetes mellitus, hypertension, metabolic syndrome, and cardiovascular diseases [12].
As specimens were prepared and stored using standard protocols for validation of biomarkers, the bias of the laboratory was controlled by the measuring instrument.
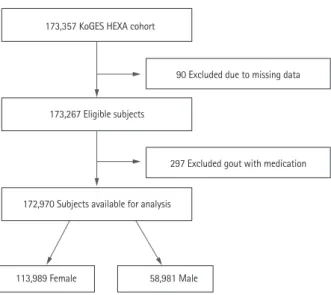
The data collected during 2004 to 2013 were extract- ed for this study [12]. The KoGES_HEXA study includes community-dwellers and participants recruited from the national health examinee registry, that is, men and women aged ≥ 40 years at baseline. A total of 173,357 participants (age range, 40 to 79 years) were included in this cohort (Fig. 1). We collected information on age, sex, body mass index, alcohol, smoking, hypertension, diabetes mellitus, myocardial infarction, cardiovascu- lar event, thyroid disease, and malignancy. For chronic kidney disease (CKD), the definitions of Modification of Diet in Renal Disease estimating glomerular filtration rate (MDRD-eGFR) < 60 mL/min/1.73 m2 and CKD-Ep-
idemiology Collaboration (CKD-EPI) < 60 mL/min/1.73 m2 were used. Individuals with missing data on age, sex, and SUA level were excluded. Participants being treat- ed for gout during the study period were also exclud- ed. A total of 90 participants with missing data and 297 participants on gout medication were excluded. The study protocol was approved by the Institutional Review Boards of the Hanyang University Hospital (IRB No.
HYUH 2016-01-024). Informed consent was waived by the board.
Definition of hyperuricemia and hypouricemia Hyperuricemia was defined as SUA level > 7.0 mg/dL in men and women based on previous studies [13-15]. We used this definition to determine the prevalence of hy- peruricemia in the present study. Additionally, we in- cluded the definition of hyperuricemia as SUA level >
7.0 mg/dL in men and SUA level > 6.0 mg/dL in women from other studies [16,17]. Hypouricemia was defined as SUA level ≤ 2.0 mg/dL, according to previous stud- ies [10,11,18]. The prevalence of hyperuricemia and hy- pouricemia in all participants was calculated for two definitions. Moreover, we examined the prevalence of hyperuricemia and hypouricemia excluding CKD-EPI patients because CKD has a significant effect on SUA levels from the definition of SUA level > 7.0 mg/dL.
Figure 1. Flowchart for participant eligibility. KoGES, Korean Genome and Epidemiology Study; HEXA, health examinees.
173,357 KoGES HEXA cohort
173,267 Eligible subjects
172,970 Subjects available for analysis
113,989 Female 58,981 Male
90 Excluded due to missing data
297 Excluded gout with medication
Statistical analysis
All data were summarized as mean ± standard deviation or count (percentage). The frequency of an SUA lev- el was the proportion of participants with that specif- ic SUA level in the total sample. Age- and sex-specific prevalence of hyperuricemia and hypouricemia was cal- culated. The chi-square trend test was used to assess the difference in prevalence of hyperuricemia and hypouri- cemia according to age. Confidence intervals for crude and standardized prevalence rates were calculated using the Wilson score method and gamma distribution. A p values < 0.05 were considered statistically significant.
All statistical analyses were performed using IBM SPSS statistical software version 23 for Windows (IBM Corp., Armond, NY, USA) and R version 3.4.3 (The R Project for Statistical Computing, Vienna, Austria).
RESULTS
The flow chart capturing participant eligibility is shown in Fig. 1. A total of 172,970 participants (58,981 men and 113,989 women) were included in this study. Demo- graphic and clinical characteristics of the participants are shown in Table 1. The mean age of men and women was 53.97 ± 8.81 and 52.63 ± 8.09 years, respectively (p <
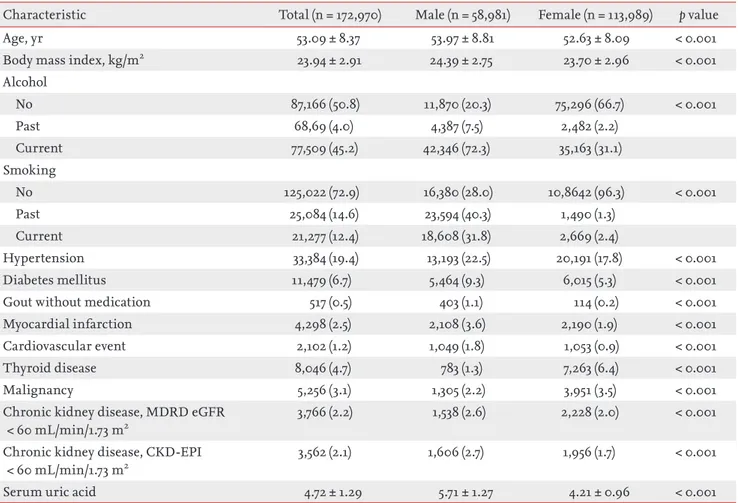
0.001). Most of the variables had significantly higher val- ues in men than in women (p < 0.001); however, thyroid disease and malignancy rates were higher in women than in men (p < 0.001). The mean SUA level was signifi- cantly higher in men than in women (5.71 ± 1.27 mg/dL vs. 4.21 ± 0.96 mg/dL, p < 0.001).
Table 1. Clinical characteristics of the participants
Characteristic Total (n = 172,970) Male (n = 58,981) Female (n = 113,989) p value
Age, yr 53.09 ± 8.37 53.97 ± 8.81 52.63 ± 8.09 < 0.001
Body mass index, kg/m2 23.94 ± 2.91 24.39 ± 2.75 23.70 ± 2.96 < 0.001
Alcohol
No 87,166 (50.8) 11,870 (20.3) 75,296 (66.7) < 0.001
Past 68,69 (4.0) 4,387 (7.5) 2,482 (2.2)
Current 77,509 (45.2) 42,346 (72.3) 35,163 (31.1)
Smoking
No 125,022 (72.9) 16,380 (28.0) 10,8642 (96.3) < 0.001
Past 25,084 (14.6) 23,594 (40.3) 1,490 (1.3)
Current 21,277 (12.4) 18,608 (31.8) 2,669 (2.4)
Hypertension 33,384 (19.4) 13,193 (22.5) 20,191 (17.8) < 0.001
Diabetes mellitus 11,479 (6.7) 5,464 (9.3) 6,015 (5.3) < 0.001
Gout without medication 517 (0.5) 403 (1.1) 114 (0.2) < 0.001
Myocardial infarction 4,298 (2.5) 2,108 (3.6) 2,190 (1.9) < 0.001
Cardiovascular event 2,102 (1.2) 1,049 (1.8) 1,053 (0.9) < 0.001
Thyroid disease 8,046 (4.7) 783 (1.3) 7,263 (6.4) < 0.001
Malignancy 5,256 (3.1) 1,305 (2.2) 3,951 (3.5) < 0.001
Chronic kidney disease, MDRD eGFR
< 60 mL/min/1.73 m2
3,766 (2.2) 1,538 (2.6) 2,228 (2.0) < 0.001
Chronic kidney disease, CKD-EPI
< 60 mL/min/1.73 m2
3,562 (2.1) 1,606 (2.7) 1,956 (1.7) < 0.001
Serum uric acid 4.72 ± 1.29 5.71 ± 1.27 4.21 ± 0.96 < 0.001
Values are presented as mean ± standard deviation or number (%).
MDRD, Modification of Diet in Renal Disease; eGFR, estimated glomerular filtration rate; CKD-EPI, chronic kidney disease epidemiology collaboration.
Distribution of SUA levels
Histograms of SUA levels are shown in Fig. 2A and 2B. The range of SUA levels was wider in men than in women. Overall, women had a lower average SUA level than men, regardless of age (Fig. 2C). Concurrently, for women, the average SUA level tended to increase with age, while for men it peaked around the age of 40 years, decreasing gradually until the age of 60 years before it increased again around the age of 70 years.
Prevalence of hyperuricemia
The overall prevalence of hyperuricemia (SUA > 7.0 mg/
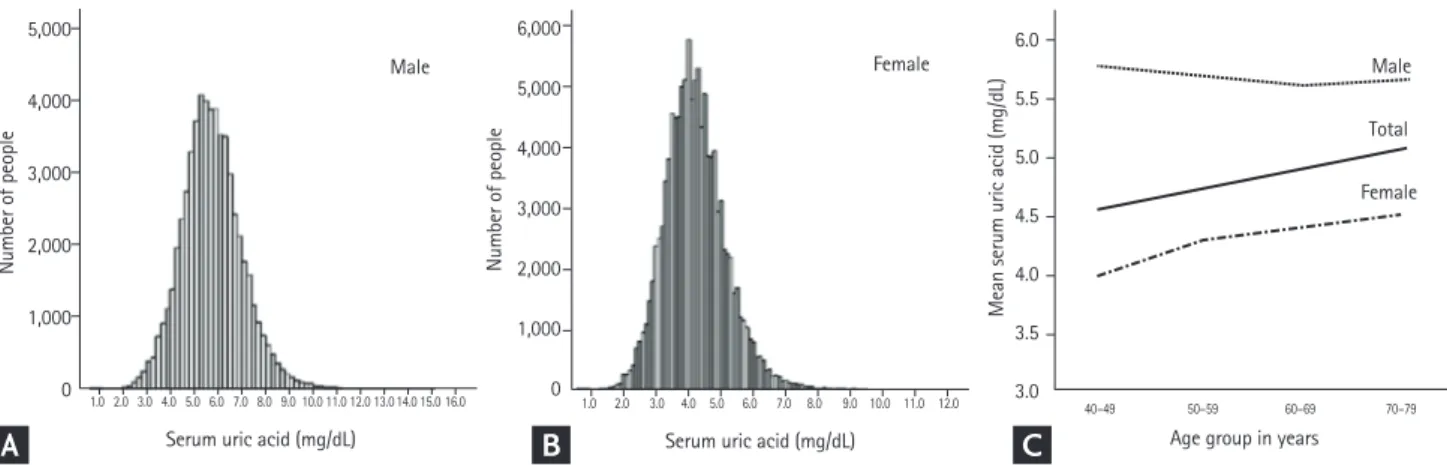
dL) was 50.82 per 1,000 persons (95% confidence interval [CI], 49.79 to 51.86); in men, it was 133.25 per 1,000 per- sons (95% CI, 130.53 to 136.01), and in women, it was 8.17 per 1,000 persons (95% CI, 7.66 to 8.71) (Table 1 and Fig.
3A). The overall prevalence of hyperuricemia increased with age. However, stratified by sex, the prevalence tend- ed to gradually increase in women, while among men, it decreased between the age of 40 years and 60 years and then, gradually increased above the age of 70 years (Fig.
3A). Therefore, the pattern of serial prevalence differed between men and women (p < 0.001).
Based on a different definition of hyperuricemia (SUA
> 7.0 mg/dL in men and SUA > 6.0 mg/dL in women), the overall prevalence was 69.35 per 1,000 persons (95%
CI, 68.16 to 70.55), which was slightly higher than that reported based on the definition using SUA > 7.0 mg/
dL. Meanwhile, the prevalence in women was 4.44 times higher using this definition than that reported with a cut-off of SUA > 7.0 mg/dL (36.28 per 1,000 persons, 95%
CI, 35.21 to 37.39).
Prevalence of hypouricemia
The overall prevalence of hypouricemia was 4.16 per 1,000 persons (95% CI, 3.87 to 4.48); in men, it was 1.10 per 1,000 persons (95% CI, 0.86 to 1.40), and in women, it was 5.75 per 1,000 persons (95% CI, 5.32 to 6.20) (Table 2 and Fig. 3B). The overall prevalence of hypouricemia de- creased among the participants aged 40 to 60 years and increased among participants aged > 70 years. Among men, the prevalence of hypouricemia was similar across all age groups, while among women, it peaked among the participants aged 40 to 49 years and was lowest among participants aged 50 to 59 years (Fig. 3B). There- fore, age-based prevalence of hypouricemia differed be- tween men and women (p = 0.044).
Prevalence of hyper- and hypouricemia excluding CKD patients
We investigated the prevalence of hyper- and hypouri- cemia, excluding CKD patients based on CKD-EPI cal- culation (Table 3). In the revised sample, the prevalence of hyperuricemia was lower in both men and women when CKD patients were excluded (133.25 and 8.17 per 1,000 persons, respectively) than when CKD patients were included in the analysis (Table 2). Moreover, al- though the prevalence in this revised sample increased with age, and the rate of increase was lower than that in a sample including CKD patients. There was no signifi- cant change in the prevalence of hypouricemia with age after inclusion of CKD patients in the analysis.
Figure 2. Distribution of the serum uric acid level in men (A) and women (B) and the mean serum uric acid level stratified by age and sex (C).
Serum uric acid (mg/dL)
Male Male
Total Female
Female
1.0 2.0 3.0 4.0 5.0 6.0 7.0 8.0 9.0 10.0 11.0 12.0 13.014.0 15.0 16.0
Number of people Number of people Mean serum uric acid (mg/dL)
5,000
4,000
3,000
2,000
1,000
0
6,000
5,000
4,000
3,000
2,000
1,000
0
6.0
5.5
5.0
4.5
4.0
3.5
3.0
Serum uric acid (mg/dL) Age group in years
1.0 2.0 3.0 4.0 5.0 6.0 7.0 8.0 9.0 10.0 11.0 12.0 40–49 50–59 60–69 70–79
A B C
DISCUSSION
We evaluated the distribution of SUA levels and preva- lence of hypouricemia and hyperuricemia in the Korean population. SUA levels followed different distribution patterns according to age and sex. The prevalence of hy- peruricemia was approximately 16 times higher in men than in women, while the prevalence of hypouricemia was approximately five times higher in women than in men.
In this study, the mean SUA level for men and women was 5.71 ± 1.27 and 4.21 ± 0.96 mg/dL, respectively, and both of these values were slightly lower than the values reported in a recent study based on a sample of 5,548 Koreans (5.83 and 4.36 mg/dL in men and women, re- spectively) [16]. Concurrently, SUA levels reported in this study were lower than those reported in recent large- scale studies in Japan (6.0 ± 1.4 and 4.5 ± 1.1 mg/dL in men and women, respectively) [19] and China (6.23 ± 1.38
and 4.38 ± 1.11 mg/dL in men and women, respectively) [20]. A study based in the United States reported that the mean SUA level was 4.4 mg/dL in white women; 4.9 mg/
dL in black women; 5.8 mg/dL in white men; and 6.0 mg/
dL in black men [21]. Therefore, the average SUA level may differ according to sex, race, and place of residence.
Consequently, the criteria for uric acid-related diseases, including hyperuricemia or hypouricemia, may differ according to these factors.
There have been several studies on hyperuricemia (defined as SUA level ≥ 7.0 mg/dL in men and SUA lev- el ≥ 6.0 mg/dL in women) in Korea. Among them, sin- gle-center studies using health screening data reported the prevalence of hyperuricemia in men and women as 14.3% and 2.2%, respectively, in a sample of 6,461 partic- ipants [22] and 15% and 4.1%, respectively, in a sample of 2,297 participants [23]. Meanwhile, national surveillance data-based estimates were 17.0% and 5.9%, respectively (5,548 participants) [16]. The discrepancies between these Figure 3. Prevalence of hyperuricemia (A) and hypouricemia (B) stratified by age and sex.
0.1 0.8
0.5
0.1 0.4 0.3
0.1 0.5
0.3
0.2 0.6
0.4
Prevalence (%)
Total Male Female
5.1
13.3
0.8 16
12
8
4
0
Prevalence (%)
40–49 50–59 60–69 70–79
13.7
0.3 4.6
13.1
0.8 4.7
13
1.6 6.2
14.6
2.8 8.5 16
12
8
4
0
Prevalence (%)
Total Male Female
0.4
0.1
0.6 0.8
0.6
0.4
0.2
0
Prevalence (%)
40–49 50–59 60–69 70–79
1 0.8 0.6 0.4 0.2 0
A
B
studies and the present study findings might be ow- ing to the differences in sample composition, estimate methodology, and timeframe of the study. We believe that the present estimates based on data from 172,970 participants are a robust representation of the distribu- tion of SUA levels in the Korean population.
Zhu et al. [8] investigated the prevalence of hyperuri- cemia and gout using the National Health and Nutrition Examination Survey 2007 to 2008. Although these data originated a decade ago, the prevalence of hyperurice- mia was much higher in that report than in this study (overall 26.6%). The authors suggested that the preva- lence of hyperuricemia increased with age and that this increase was associated with a Western diet and lifestyle, as well as complications, such as obesity and hyperten- sion, and the use of drugs, such as diuretics and aspirin.
In our study, the prevalence of hyperuricemia was highest among men and women in their 70s; however, the pattern of age-dependent prevalence was different between men and women. The prevalence in women
tended to increase gradually, but the prevalence among men decreased until the age of 60 years before it in- creased again over the age of 70 years. These results are comparable to the results reported by Kim et al. [16], as well as those from studies in the Chinese and Japanese populations [24,25]. Considering these findings, it is un- likely that these sex-based differences are due to nutri- tion, lifestyle, obesity, or medication. The reasons for the increased prevalence of hyperuricemia among mid- dle-aged men are unclear. Future laboratory research elucidating the biological and sex- and age-specific fac- tors determining SUA levels is warranted.
A few previous studies have reported the prevalence of hypouricemia, although there is no conclusive evidence on the relationship between hypouricemia and neuro- logical disease [26,27]. Son et al. [18] have reported that the overall prevalence of hypouricemia was 1.39%, which differed between inpatients and outpatients treated at a single center (4.14% vs. 0.53%). This evidence indirectly suggests a relationship between hypouricemia and co- Table 2. Prevalence of hyperuricemia (serum uric acid > 7.0 mg/dL) and hypouricemia (serum uric acid ≤ 2.0 mg/dL) in the Ko- rean population
Classification Total population
in cohort
No. of classified participants in cohort
Prevalence per 1,000 persons (95% CI) Hyperuricemia
Overall 172,970 8,790 50.82 (49.79–51.86)
Male 58,981 7,859 133.25 (130.53–136.01)
Female 113,989 931 8.17 (7.66–8.71)
Age, yr
40–49 63,651 2,911 45.73 (44.14–47.38)
50–59 66,618 3,150 47.28 (45.70–48.92)
60–69 39,090 2,422 61.96 (59.61–64.39)
70–79 3,611 307 85.02 (76.36–94.56)
Hypouricemia
Overall 172,970 720 4.16 (3.87–4.48)
Male 58,981 65 1.10 (0.86–1.40)
Female 113,989 655 5.75 (5.32–6.20)
Age, yr
40–49 63,651 350 5.50 (4.95–6.10)
50–59 66,618 227 3.41 (2.99–3.88)
60–69 39,090 127 3.25 (2.73–3.86)
70–79 3,611 16 4.43 (2.73–7.19)
CI, confidence interval.
morbidity. Meanwhile, Kuwabara et al. [11] showed that the prevalence of hypouricemia in patients undergoing an annual health check-up was 0.19% and 0.58% in two evaluated centers.
Considering the relatively high prevalence of CKD among older adults [28,29] and the association between CKD and SUA levels [30], CKD might be a risk factor for hyperuricemia in older age. In the present study, the relative decrease in the prevalence of hyperuricemia among older adults after excluding patients with CKD supports the hypothesis that CKD is associated with hy- peruricemia. In addition, Park et al. [29] suggested that CKD prevalence in Korea (8.2%) was lower than that in the United States (13.1%) and China (10.8%). CKD prev- alence might be an important factor underpinning the differences in the prevalence of hyperuricemia between countries.
Wakasugi et al. [10] conducted a population-based cross-sectional study examining the association be- tween hypouricemia and kidney function. They report-
ed that the prevalence of hypouricemia was 0.2% and 0.4% in men and women, respectively. In our study, the prevalence of hypouricemia was 1.10 per 1,000 persons in men and 5.57 per 1,000 persons in women. These sex- based differences in prevalence might be related to hor- monal differences between men and women [31]. In ad- dition, the prevalence in men was comparable across age groups, while the prevalence in women was the highest in the 40s age group. Previous studies have suggested that menopause may affect SUA levels; however, the ex- act mechanism has not been elucidated [10,32].
This study has several limitations. First, the cohort used in this study included participants aged 40 years or more, as the KoGES was established to investigate the genetic and environmental etiology of common com- plex diseases, such as type 2 diabetes mellitus, hyperten- sion, obesity, metabolic syndrome, osteoporosis, cardio- vascular disease, and cancer with long-term follow-up, and the causes of death among Koreans. Second, as the SUA level was only measured once, it was not possible Table 3. Prevalence for hyperuricemia (serum uric acid > 7.0 mg/dL) and hypouricemia (serum uric acid ≤ 2.0 mg/dL) exclud- ing chronic kidney disease (CKD-EPI < 60 mL/min/1.73 m2) in the Korean population
Classification Total population in cohort
No. of classified participants in cohort
Prevalence per 1000 persons (95% CI) Hyperuricemia
Overall 169,408 7,744 45.71 (44.73–46.72)
Male 57,375 7,115 124.01 (121.34–126.73)
Female 112,033 629 5.61 (5.19–6.07)
Age, yr
40–49 63,417 2,816 44.40 (42.83–46.04)
50–59 65,800 2,884 43.83 (42.29–45.42)
60–69 37,081 1,876 50.59 (48.41–52.87)
70–79 3,110 168 54.02 (46.61– 62.53)
Hypouricemia
Overall 169,408 707 4.17 (3.88–4.49)
Male 57,375 61 1.06 (0.83–1.37)
Female 112,033 646 5.77 (5.34–6.23)
Age, yr
40–49 63,417 350 5.52 (4.97–6.13)
50–59 65,800 223 3.39 (2.97–3.86)
60–69 37,081 120 3.24 (2.71–3.87)
70–79 3,110 14 4.50 (2.68–7.54)
CKD-EPI, chronic kidney disease epidemiology collaboration; CI, confidence interval.
to check whether hypouricemia or hyperuricemia was transient or persistent, which should be confirmed in a follow-up study. Third, this study did not control for medication use which might have affected the results, as certain medications can increase or decrease SUA levels.
Although patients treated for gout during the study pe- riod were excluded from analysis, the possibility that the data may be distorted due to medication-related effects cannot be eliminated. Fourth, changes in environmen- tal factors might affect the epidemiology of SUA levels during follow-up. Finally, this cohort is likely to be af- fected by chronic diseases, which might have impacted our findings. However, an examination of a relationship between chronic diseases and SUA levels was beyond the scope of this study.
In conclusion, this study reported the distribution of SUA levels and prevalence of hyper- and hypouricemia according to sex and age based on a large nationwide health examinee cohort. We found that the distribu- tion of the SUA level differed according to age and sex.
Therefore, prior to the study of diseases associated with SUA levels, it is necessary to establish a normal range of SUA levels according to age and sex.
Conflict of interest
No potential conflict of interest relevant to this article was reported.
Acknowledgments
This study was conducted with bioresources from the National Biobank of Korea, the Centers for Disease Con- trol and Prevention, Republic of Korea (KBP-2016-011).
This work was supported by the 2018 Inje University re- search grant.
REFERENCES
1. Choi HK, Mount DB, Reginato AM; American College of Physicians; American Physiological Society. Pathogenesis of gout. Ann Intern Med 2005;143:499-516.
2. Richette P, Bardin T. Gout. Lancet 2010;375:318-328.
3. Bellomo G. Uric acid and chronic kidney disease: a time to act? World J Nephrol 2013;2:17-25.
4. Rock KL, Kataoka H, Lai JJ. Uric acid as a danger signal in gout and its comorbidities. Nat Rev Rheumatol 2013;9:13- 23.
5. Kanda E, Muneyuki T, Kanno Y, Suwa K, Nakajima K. Uric acid level has a U-shaped association with loss of kidney function in healthy people: a prospective cohort study.
PLoS One 2015;10:e0118031.
6. Chen H, Mosley TH, Alonso A, Huang X. Plasma urate and Parkinson’s disease in the Atherosclerosis Risk in Communities (ARIC) study. Am J Epidemiol 2009;169:1064-1069.
7. Kim TS, Pae CU, Yoon SJ, et al. Decreased plasma antiox- idants in patients with Alzheimer’s disease. Int J Geriatr Psychiatry 2006;21:344-348.
8. Zhu Y, Pandya BJ, Choi HK. Prevalence of gout and hy- peruricemia in the US general population: the National Health and Nutrition Examination Survey 2007-2008.
Arthritis Rheum 2011;63:3136-3141.
9. Maynard JW, McAdams-DeMarco MA, Law A, et al. Racial differences in gout incidence in a population-based co- hort: Atherosclerosis Risk in Communities Study. Am J Epidemiol 2014;179:576-583.
10. Wakasugi M, Kazama JJ, Narita I, et al. Association be- tween hypouricemia and reduced kidney function: a cross-sectional population-based study in Japan. Am J Nephrol 2015;41:138-146.
11. Kuwabara M, Niwa K, Ohtahara A, et al. Prevalence and complications of hypouricemia in a general population:
a large-scale cross-sectional study in Japan. PLoS One 2017;12:e0176055.
12. Kim Y, Han BG; KoGES group. Cohort profile: the Korean Genome and Epidemiology Study (KoGES) consortium.
Int J Epidemiol 2017;46:e20.
13. Kuwabara M, Kuwabara R, Niwa K, et al. Different risk for hypertension, diabetes, dyslipidemia, and hyperuricemia according to level of body mass index in Japanese and American subjects. Nutrients 2018;10:1011.
14. Mellen PB, Bleyer AJ, Erlinger TP, et al. Serum uric acid
KEY MESSAGE
1. The distribution of serum uric acid levels dif- fered according to age and sex.
2. The prevalence of hyperuricemia was 133.25 per 1,000 persons in men and 8.17 per 1,000 per- sons in women.
3. The prevalence of hypouricemia was 1.10 per 1,000 persons in men and 5.75 per 1,000 persons in women.
predicts incident hypertension in a biethnic cohort: the atherosclerosis risk in communities study. Hypertension 2006;48:1037-1042.
15. Yamanaka H; Japanese Society of Gout and Nucleic Acid Metabolism. Japanese guideline for the management of hyperuricemia and gout: second edition. Nucleosides Nucleotides Nucleic Acids 2011;30:1018-1029.
16. Kim Y, Kang J, Kim GT. Prevalence of hyperuricemia and its associated factors in the general Korean population:
an analysis of a population-based nationally representa- tive sample. Clin Rheumatol 2018;37:2529-2538.
17. Nagahama K, Inoue T, Iseki K, et al. Hyperuricemia as a predictor of hypertension in a screened cohort in Okina- wa, Japan. Hypertens Res 2004;27:835-841.
18. Son CN, Kim JM, Kim SH, et al. Prevalence and possible causes of hypouricemia at a tertiary care hospital. Korean J Intern Med 2016;31:971-976.
19. Kawasoe S, Kubozono T, Yoshifuku S, et al. Uric acid level and prevalence of atrial fibrillation in a Japanese general population of 285,882. Circ J 2016;80:2453-2459.
20. Lin X, Zhao C, Qin A, et al. Association between serum uric acid and bone health in general population: a large and multicentre study. Oncotarget 2015;6:35395-35403.
21. Zhang C, Meng Z, Li X, et al. No associations exists be- tween red blood cell distribution width and serum uric acid in both sexes. Medicine (Baltimore) 2018;97:e12707.
22. Kim EH, Jeon K, Park KW, et al. The prevalence of gout among hyperuricemic population. J Korean Rheum As- soc 2004;11:7-13.
23. Hong SJ, Kim YS, Kim HS. Prevalence and clinical fea- tures of hyperuricemia in Gwangju and Jeonnam territo- ries. J Rheum Dis 2012;19:138-146.
24. Yang J, Liu Z, Zhang C, et al. The prevalence of hyper- uricemia and its correlates in an inland Chinese adult population, urban and rural of Jinan. Rheumatol Int 2013;33:1511-1517.
25. Akizuki S. Serum uric acid levels among thirty-four thou- sand people in Japan. Ann Rheum Dis 1982;41:272-274.
26. Latourte A, Bardin T, Richette P. Uric acid and cognitive decline: a double-edge sword? Curr Opin Rheumatol 2018;30:183-187.
27. Tana C, Ticinesi A, Prati B, Nouvenne A, Meschi T. Uric acid and cognitive function in older individuals. Nutri- ents 2018;10:975.
28. Ji E, Kim YS. Prevalence of chronic kidney disease de- fined by using CKD-EPI equation and albumin-to-cre- atinine ratio in the Korean adult population. Korean J Intern Med 2016;31:1120-1130.
29. Park JI, Baek H, Jung HH. Prevalence of chronic kidney disease in Korea: the Korean National Health and Nutri- tional Examination Survey 2011-2013. J Korean Med Sci 2016;31:915-923.
30. Johnson RJ, Nakagawa T, Jalal D, Sanchez-Lozada LG, Kang DH, Ritz E. Uric acid and chronic kidney dis- ease: which is chasing which? Nephrol Dial Transplant 2013;28:2221-2228.
31. Mumford SL, Dasharathy SS, Pollack AZ, et al. Serum uric acid in relation to endogenous reproductive hormones during the menstrual cycle: findings from the BioCycle study. Hum Reprod 2013;28:1853-1862.
32. Wingrove CS, Walton C, Stevenson JC. The effect of menopause on serum uric acid levels in non-obese healthy women. Metabolism 1998;47:435-438.