• 검색 결과가 없습니다.

Reduced risk for chronic kidney disease after recovery from metabolic syndrome: A nationwide population-based study

N/A
N/A
Protected

Academic year: 2021

Share "Reduced risk for chronic kidney disease after recovery from metabolic syndrome: A nationwide population-based study"

Copied!
12
0
0

로드 중.... (전체 텍스트 보기)

전체 글

(1)

Reduced risk for chronic kidney disease after recovery from metabolic syndrome: A nationwide population- based study

Sehoon Park 1,2 , Soojin Lee 3,4 , Yaerim Kim 5 , Yeonhee Lee 3,4 , Min Woo Kang 3,4 , Kyungdo Han 6 , Hajeong Lee 3 , Jung Pyo Lee 4,7,8 , Kwon Wook Joo 3,4,7 , Chun Soo Lim 4,7,8 , Yon Su Kim 1,3,4,7 , Dong Ki Kim 3,4,7

1 Department of Biomedical Sciences, Seoul National University College of Medicine, Seoul, Republic of Korea

2 Department of Internal Medicine, Armed Forces Capital Hospital, Seongnam, Republic of Korea

3 Department of Internal Medicine, Seoul National University Hospital, Seoul, Republic of Korea

4 Department of Internal Medicine, Seoul National University College of Medicine, Seoul, Republic of Korea

5 Department of Internal Medicine, Keimyung University School of Medicine, Daegu, Republic of Korea

6 Department of Medical Statistics, College of Medicine, The Catholic University of Korea, Seoul, Republic of Korea

7 Kidney Research Institute, Seoul National University College of Medicine, Seoul, Republic of Korea

8 Department of Internal Medicine, SMG-SNU Boramae Medical Center, Seoul, Republic of Korea

Background: Metabolic syndrome (MetS) is linked to various chronic comorbidities, including chronic kidney disease (CKD).

However, few large studies have addressed whether recovery from MetS is associated with reduction in the risks of such comorbidities.

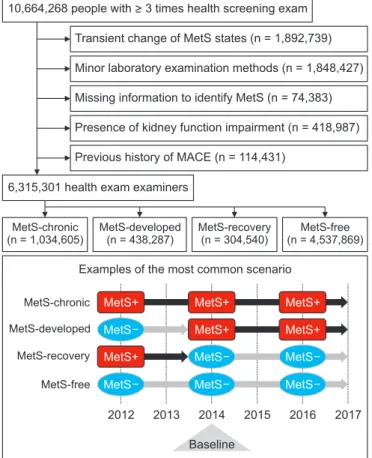
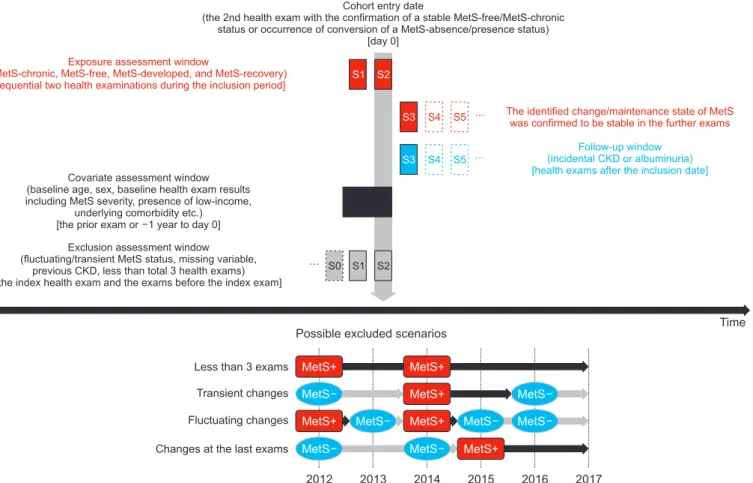
Methods: This nationwide population-based study in Korea screened 10,664,268 people who received national health screening ≥ 3 times between 2012 and 2016. Those with a history of major cardiovascular events or preexisting CKD were excluded. We classified study groups into four, according to the course of MetS state, as defined by the harmonizing criteria. The main study outcome was incidental CKD (estimated glomerular filtration rate < 60 mL/min/1.73 m 2 which was persistent until the last health exams). The study outcomes were investigated using multivariable logistic regression analysis, which was adjusted for clinical variables and the previous severity of MetS.

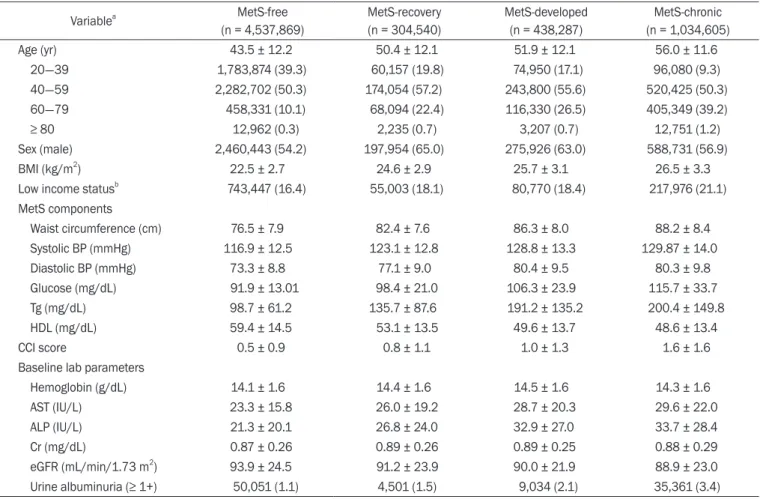
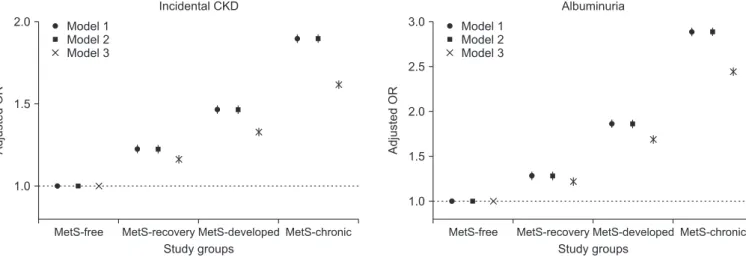
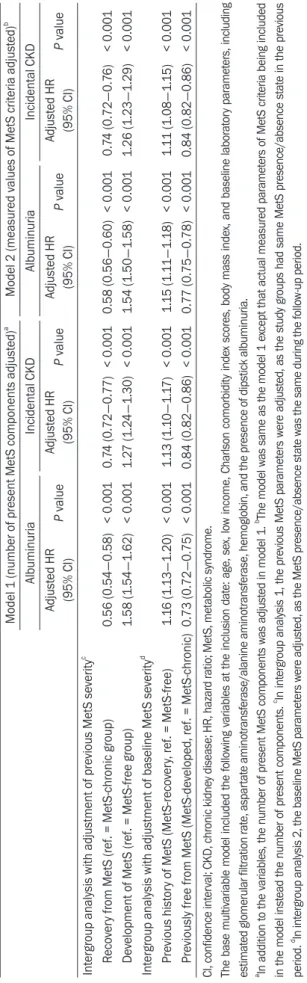
Results: Four study groups included 6,315,301 subjects: 4,537,869 people without MetS, 1,034,605 with chronic MetS, 438,287 who developed MetS, and 304,540 who recovered from preexisting MetS. Those who developed MetS demonstrated higher risk of CKD (adjusted odds ratio [OR], 1.26 [1.23-1.29]) than did those who did not develop MetS. In contrast, MetS- recovery was associated with decreased risk of CKD (adjusted OR, 0.84 [0.82-0.86]) than that in people with chronic MetS.

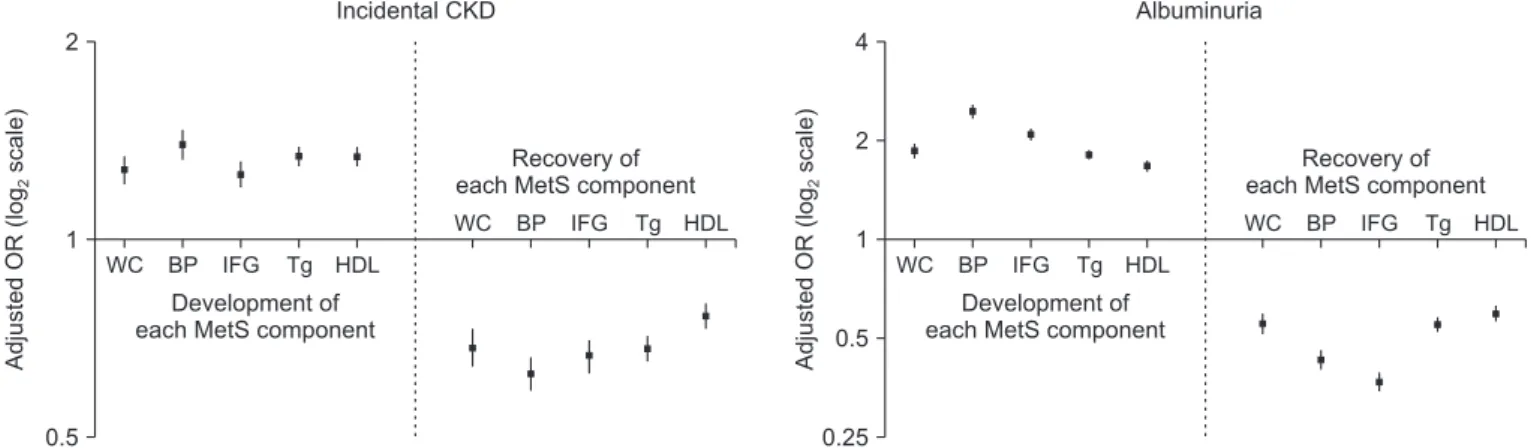
Among the MetS components, change in hypertension was associated with the largest difference in CKD risk.

Conclusion: Reducing or preventing MetS may reduce the burden of CKD on a population-scale. Clinicians should consider the clinical importance of altering MetS status for risk of CKD.

Keywords: Chronic kidney diseases, Diabetes mellitus, Dyslipidemia, Hypertension, Metabolic syndrome, Obesity Kidney Res Clin Pract 2020;39(2):180-191

pISSN: 2211-9132 • eISSN: 2211-9140 https://doi.org/10.23876/j.krcp.20.016

KIDNEY RESEARCH

AND CLINICAL PRACTICE

Received January 27, 2020; Revised March 13, 2020; Accepted March 15, 2020 Edited by Dong-Ryeol Ryu, Ewha Womans University, Seoul, Republic of Korea Correspondence: Dong Ki Kim

Department of Internal Medicine, Seoul National University Hospital, 101 Daehak-ro, Jongno-gu, Seoul 03080, Republic of Korea.

E-mail: dkkim73@gmail.com.

Copyright © 2020 by The Korean Society of Nephrology

CC

This is an open-access article distributed under the terms of the Creative Commons Attribution Non-Commercial License (http://creativecommons.org/

licenses/by-nc-nd/4.0/), which permits unrestricted non-commercial use, distribution, and reproduction in any medium, provided the original work is properly

cited.

(2)

Introduction

Metabolic syndrome (MetS) and its components are important risk factors for cardiovascular disease and dia- betes mellitus [1-5]. These MetS-related diseases have a large burden on society. Therefore, screening for and managing MetS are of utmost importance [6-8]. With the aging population and the increasing prevalence of obe- sity globally, both of which are closely associated with MetS development, the importance of MetS treatment becomes even more significant [9-11].

A significant association between MetS and chronic kidney disease (CKD), another global health problem, is present [12]. Diabetes mellitus and hypertension are the most common etiologies of CKD, both of which are also components of MetS. Therefore, there is increased risk of consequent CKD when MetS is present [13-15]. MetS it- self, independent of its individual components, may also be an important predictor of CKD [12,15,16]. However, it remains unclear whether recovery from preexisting MetS is related to decreased risk of CKD. This dynamic relationship has been rarely demonstrated in large-scale cohorts, although some studies have suggested its possi- bility [17]. The guidelines in treatment of CKD, however, recommend focusing on management of its metabolic risk factors [18-23]. In addition, a nationwide study comparing the incidence of CKD according to changes in individual components of MetS is needed in order to es- tablish a health policy that targets the globally increasing burden of CKD-related health issues [24,25]. However, such national data, including repetitive evaluations of people’s MetS and kidney function, are rare.

In this study, we asked whether recovery from pre- existing MetS lessens the risk of CKD. Simultaneously, we sought to provide evidence for public metabolic risk management for CKD prevention by studying the asso- ciation between CKD risk increments and the develop- ment of MetS. We reviewed more than 6 million people in a national health screening program to understand the relationship between MetS and CKD.

Methods Ethical approval

The study was conducted in accordance with the Dec-

laration of Helsinki. The Institutional Review Board (IRB) of Seoul National University Hospital (IRB no. E-1801- 027-913) approved this study. The National Health Insur- ance Service (NHIS) approved the use of the NHID (no.

NHIS-2017-1-346). Informed consent was waived be- cause anonymous data were provided by the NHIS.

Data resources

The study setting was described in our previous study [17]. The National Health Insurance Database (NHID) is a public data resource provided by the National Health Insurance System (NHIS) of the Republic of Korea [26]. It includes national health screening results, socio-demo- graphic variables, and claims. National health screening programs are provided by NHIS. The details of the ex- aminations have been previously described [27]. In brief, this free health screening is provided biennially for office workers/non-workplace subscribers, and annually for non-office workers. Dependent subscribers older than 40 years can also receive the exam biennially. Approxi- mately 15 million people are the target population for the health screening every year. The total examination rate has remained consistently > 70% since 2011. All of the parameters that are included in MetS, including serum creatinine and urinalysis albumin values, are measured at every national health screening.

Extracted data from the NHID

The following health information was collected from

the examinations: date, age, sex, waist circumference,

body mass index (BMI), systolic/diastolic blood pressure,

fasting glucose, serum triglycerides (Tg), high-density

lipoprotein (HDL) cholesterol, serum creatinine (by

the Jaffe’s kinetic methods), baseline urine albumin (by

dipstick method), hemoglobin, alanine aminotransfer-

ase (ALT), and aspartate aminotransferase (AST). Other

information regarding comorbidities was reviewed in

the claims database. The Charlson comorbidity index

(CCI) score was calculated to represent the comorbidity

burden by reviewing the applied International Classifica-

tion of Diseases, 10th Revision diagnostic codes [28]. An

individual was considered to have a comorbidity when

the respective diagnostic codes were present more than

two times before the inclusion date within one year. The

(3)

income status was determined by the required insurance fee. People in the lowest quartile of the fee or with free insurance were considered to have low-income status.

Study population

National health screening examinations conducted be- tween 2012 and 2016 were included in the study. We in- cluded individuals who underwent health examinations

≥ 3 times during the period, as we intended to identify dynamic, but not transient, changes in MetS status (Fig.

1). The graphical description of the time windows to de-

fine study population, collect variables, and identify out- comes is shown in Fig. 2. The exclusion criteria were peo- ple with: 1) missing information regarding MetS status;

2) a previous history of overt CKD [identified by baseline estimated glomerular filtration rate (eGFR) calculated by the Modification of Diet in Renal Disease (MDRD) equa- tion < 60 mL/min/1.73 m 2 , presence of CKD related di- agnostic codes or a history of renal replacement therapy in the claims database]; 3) a history of significant cardio/

cerebro-vascular events, including myocardial infarction, coronary revascularization and acute ischemic stroke; 4) health screenings with other methods than the Jaffe’s ki- netic method for serum creatinine measurement; and 5) people with changes in MetS status on the last exam (and those with transient/fluctuating changes) who had no follow-up were excluded because the persistence of the change was not certain.

Definition of MetS

At each health screening, the MetS statuses were identi- fied using the widely used harmonizing criteria that were published by Alberti et al [29]. Briefly, the presence of MetS was determined when ≥ 3 of the 5 following compo- nents of MetS were present: elevated waist circumference (≥ 90 cm for male, ≥ 80 cm for female in Asians), elevated Tg (≥ 150 mg/dL) or use of relevant medications, reduced HDL cholesterol (< 40 mg/dL for male, 50 mg/dL for female) or use of relevant medications, high blood pres- sure (systolic ≥ 130 and/or diastolic ≥ 80 mmHg), and elevated fasting glucose (≥ 100 mg/dL) or use of relevant medications. This definition may include those who had different severities of MetS (regarding the number of MetS components, or the degree of the parameters). Such severities were further adjusted in the analysis described below.

Study groups according to dynamic MetS statuses

We defined four study groups to reflect the examinees’

dynamic MetS statuses. The most common scenario is shown in Fig. 1. The “MetS-free group” consisted of those who did not have MetS during the entire study period.

The “MetS-chronic group” included those who had MetS identified at every health screening. The “MetS-devel- oped group” consisted of those who developed MetS dur-

10,664,268 people with > 3 times health screening exam

Transient change of MetS states (n = 1,892,739)

Minor laboratory examination methods (n = 1,848,427)

Missing information to identify MetS (n = 74,383)

Presence of kidney function impairment (n = 418,987)

Previous history of MACE (n = 114,431)

6,315,301 health exam examiners

MetS-chronic (n = 1,034,605)

MetS-free (n = 4,537,869) MetS-recovery

(n = 304,540) MetS-developed

(n = 438,287)

Examples of the most common scenario

2012 2013 2014 2015 2016 2017 MetS

MetS-chronic

MetS-free MetS-recovery MetS-developed

MetS MetS

MetS MetS

MetS MetS+

MetS+

MetS+

MetS+ MetS+

MetS+

Baseline

Figure 1. Study population criteria and representative scenar- ios. The diagram shows the process of study population selection.

Below is the most common scenario of the study groups among five national health examinations included in the study. The black squares (MetS+) indicate the MetS-present state, while the gray rounds (MetS-) indicate the MetS-absence state. The majority of the study subjects received three health examinations biennially.

Therefore, the inclusion date (indicated with the triangle) was the second health examination for them. The detailed method to define each subgroup is described in the main text.

MACE, major adverse cardiovascular event; MetS, metabolic syn-

drome.

(4)

ing the health screenings that was not present earlier and was persistent until the last health screening. The “MetS- recovery group” included examinees who had MetS that recovered by the time of the last health screening.

In the MetS-developed and MetS-recovery groups, the inclusion date was that when MetS developed or recov- ered. On the other hand, the inclusion date in the MetS- free and MetS-chronic groups was the second examina- tion date. Many study subjects underwent a total of three health screenings biennially. Therefore, the above defi- nitions secured a similar follow-up duration among the study groups, and the persistence of their MetS statuses for at least one more health exam until the last one.

Study outcomes

The primary outcome was incidental CKD that was identified during the health examinations after the in- clusion date. Incidental CKD was defined by an eGFR

< 60 mL/min/1.73 m 2 at the follow-up health examina- tion. The eGFR values were calculated using the MDRD equation. Incidental CKD was not considered to have occurred when the outcome was identified transiently, or was not present at the final examination. The second- ary outcome was the presence of albuminuria during the follow-up period. Similar to the CKD outcome, transient albuminuria was not considered an outcome event.

Possible excluded scenarios

2012 2013 2014 2015 2016 2017

MetS Less than 3 exams

Changes at the last exams Fluctuating changes Transient changes

MetS MetS

MetS MetS+

MetS+

MetS+

Cohort entry date

(the 2nd health exam with the confirmation of a stable MetS-free/MetS-chronic status or occurrence of conversion of a MetS-absence/presence status)

[day 0]

The identified change/maintenance state of MetS was confirmed to be stable in the further exams

Follow-up window (incidental CKD or albuminuria) [health exams after the inclusion date]

Covariate assessment window (baseline age, sex, baseline health exam results including MetS severity, presence of low-income,

underlying comorbidity etc.) [the prior exam or 1 year to day 0]

Exclusion assessment window (fluctuating/transient MetS status, missing variable,

previous CKD, less than total 3 health exams) [the index health exam and the exams before the index exam]

S1

S3 S4 S5

S0 S1 S2

S3 S4 S5

S2 Exposure assessment window

(MetS-chronic, MetS-free, MetS-developed, and MetS-recovery) [sequential two health examinations during the inclusion period]

Time

MetS MetS MetS+ MetS

MetS+

MetS+

Figure 2. Possible exclusion scenarios. Above, the figure demonstrates the graphical description for the time-windows when information was collected. In the MetS-developed and MetS-recovery groups, the inclusion date was the date of the health examination when MetS de- veloped or recovered. For the MetS-free and MetS-chronic groups, the date of confirmation of consistency, or the second examination date, was the inclusion date. The outcomes were assessed during later exams. Below, the figure demonstrates several possible scenarios of exclu- sion, as follows: 1) those who had fewer than three health examinations; 2) those with transient changes in their MetS statuses; 3) cases with fluctuating changes; 4) cases with alterations in MetS statuses at the last exam were excluded, because designating the baseline at the time of change would not secure the persistency of the change during the follow-up period.

CKD, chronic kidney disease; MetS, metabolic syndrome.

(5)

Intergroup analysis reflecting the severity of MetS

After demonstrating the risk of study outcomes with the MetS-free group as a reference group, we performed an additional intergroup analysis (similar to that in our pre- vious study) [17].

First, we compared people with the same previous MetS presence/absence state (e.g., MetS-free vs. MetS- developed and MetS-chronic vs. MetS-recovery group) to show the possible benefits and adverse outcomes associ- ated with a change in one’s baseline MetS status. People with mild metabolic profiles were more likely to attain or maintain a MetS-free status. Therefore, the previous MetS severity was additionally adjusted in these cases.

The MetS severity was determined by the following two methods: the number of present MetS components, and

the actually measured MetS parameters [15].

Next, we investigated whether prior history of MetS was associated with different CKD risk. Therefore, people with the same MetS presence/absence state during the follow-up period but an opposite history of MetS before inclusion were compared (e.g., MetS-free vs. MetS-recov- ery and MetS-chronic vs. MetS-developed group). In this analysis, the MetS severity at the inclusion examination was additionally adjusted, as the baseline MetS severity itself could be an essential confounder for one’s progno- sis.

Analysis regarding each MetS component

Additional analysis was conducted with MetS-free/

developed groups and MetS-chronic/recovery groups to

Table 1. Baseline characteristics of the study groups according to dynamic metabolic syndrome status

Variable a MetS-free

(n = 4,537,869)

MetS-recovery (n = 304,540)

MetS-developed (n = 438,287)

MetS-chronic (n = 1,034,605)

Age (yr) 43.5 ± 12.2 50.4 ± 12.1 51.9 ± 12.1 56.0 ± 11.6

20-39 1,783,874 (39.3) 60,157 (19.8) 74,950 (17.1) 96,080 (9.3)

40-59 2,282,702 (50.3) 174,054 (57.2) 243,800 (55.6) 520,425 (50.3)

60-79 458,331 (10.1) 68,094 (22.4) 116,330 (26.5) 405,349 (39.2)

≥ 80 12,962 (0.3) 2,235 (0.7) 3,207 (0.7) 12,751 (1.2)

Sex (male) 2,460,443 (54.2) 197,954 (65.0) 275,926 (63.0) 588,731 (56.9)

BMI (kg/m 2 ) 22.5 ± 2.7 24.6 ± 2.9 25.7 ± 3.1 26.5 ± 3.3

Low income status b 743,447 (16.4) 55,003 (18.1) 80,770 (18.4) 217,976 (21.1)

MetS components

Waist circumference (cm) 76.5 ± 7.9 82.4 ± 7.6 86.3 ± 8.0 88.2 ± 8.4

Systolic BP (mmHg) 116.9 ± 12.5 123.1 ± 12.8 128.8 ± 13.3 129.87 ± 14.0

Diastolic BP (mmHg) 73.3 ± 8.8 77.1 ± 9.0 80.4 ± 9.5 80.3 ± 9.8

Glucose (mg/dL) 91.9 ± 13.01 98.4 ± 21.0 106.3 ± 23.9 115.7 ± 33.7

Tg (mg/dL) 98.7 ± 61.2 135.7 ± 87.6 191.2 ± 135.2 200.4 ± 149.8

HDL (mg/dL) 59.4 ± 14.5 53.1 ± 13.5 49.6 ± 13.7 48.6 ± 13.4

CCI score 0.5 ± 0.9 0.8 ± 1.1 1.0 ± 1.3 1.6 ± 1.6

Baseline lab parameters

Hemoglobin (g/dL) 14.1 ± 1.6 14.4 ± 1.6 14.5 ± 1.6 14.3 ± 1.6

AST (IU/L) 23.3 ± 15.8 26.0 ± 19.2 28.7 ± 20.3 29.6 ± 22.0

ALP (IU/L) 21.3 ± 20.1 26.8 ± 24.0 32.9 ± 27.0 33.7 ± 28.4

Cr (mg/dL) 0.87 ± 0.26 0.89 ± 0.26 0.89 ± 0.25 0.88 ± 0.29

eGFR (mL/min/1.73 m 2 ) 93.9 ± 24.5 91.2 ± 23.9 90.0 ± 21.9 88.9 ± 23.0

Urine albuminuria (≥ 1+) 50,051 (1.1) 4,501 (1.5) 9,034 (2.1) 35,361 (3.4) Data are presented as mean ± standard deviation or number (%).

ALT, alanine aminotransferase; AST, aspartate aminotransferase; BMI, body mass index; BP, blood pressure; CCI, Charlson comorbidity index; Cr, creatinine; eGFR, estimated glomerular filtration rate; HDL, high-density lipoprotein; MetS, metabolic syndrome; Tg, triglyceride.

a All variables investigated in this table were statistically significantly different (P < 0.001) between the study groups. b Individuals included in the lowest quartile

(regarding required insurance fees or receiving free insurance) were categorized as the low-income group.

(6)

determine which MetS components are most important with regard to CKD risk. In this analysis, we compared the adverse outcome risk of people with the reversal or development of the MetS component in the group was compared to that of those with maintained stable MetS states and the according criteria. In defining the study subgroups, we only considered the alteration or main- tenance of the component that persisted until the last health examination.

Statistical analysis

Categorical variables are presented as numbers (per- centages). Continuous variables are reported as means (± standard deviations). Logistic regression analysis was used to investigate the significance of the associations between the studied groups and CKD risk. The baseline multivariable model included the following variables (as recorded at the time of study inclusion): age, sex, low- income status, CCI, BMI, baseline laboratory parameters (including eGFR, AST/ALT, hemoglobin), and the pres- ence of dipstick albuminuria. The severity of MetS was determined by the number and actual values of the MetS components. These components were additionally ad- justed when comparisons were made between the sub- groups and the presence/absence of MetS before and af- ter the inclusion. SAS software version 9.4 (SAS Institute Inc., Cary, NC, USA) was used for the above statistical

analyses. Statistical significance was determined using two-tailed P values < 0.05.

Results

Study population

We identified 10,664,268 health examinees who under- went ≥ 3 national health screenings in the NHID. After excluding those with transient MetS status, overt kid- ney function impairment (eGFR < 60 mL/min/1.73 m 2 ), or previous major coronary vascular events, 6,315,301 individuals were included. The included number of examinees and the median follow-up duration of each study group were as follows: 4,537,869 for the MetS-free group with 2.64 (2.12-3.30) years; 1,034,605 for the MetS- chronic group with 2.58 (2.13-3.09) years; 438,287 for the MetS-developed group with 2.35 (2.01-2.84) years; and 304,540 for the MetS-recovery group with 2.46 (2.05-3.09) years of follow-up duration.

Baseline characteristics

There were significant differences identified accord- ing to the examinees’ dynamic MetS statuses (Table 1).

The overall differences were most prominent between the MetS-chronic group and the MetS-free group. The MetS-chronic group was the oldest (on average) among

MetS-free MetS-recovery MetS-developed MetS-chronic 2.0

1.5

1.0

Adjusted OR

Study groups Model 1

Model 2 Model 3

Incidental CKD

MetS-free MetS-recovery MetS-developed MetS-chronic 3.0

2.5

2.0

1.5

1.0

Adjusted OR

Study groups Model 1

Model 2 Model 3

Albuminuria

Figure 3. Risk of incidental chronic kidney disease (CKD) and albuminuria in the study groups. The y-axes indicate the adjusted odds ratios, and the x-axes indicate the study groups. The vertical lines indicate the confidence intervals. Model 1 was adjusted for age, sex, base- line estimated glomerular filtration rate, aspartate aminotransferase/alanine aminotransferase, hemoglobin and the presence of dipstick albuminuria. In model 2, the presence of low-income status was added to the multivariable model 1. In model 3, the baseline Charlson co- morbidity index scores and body mass index were added to multivariable model 2.

MetS, metabolic syndrome; OR, odds ratio.

(7)

all groups, while the MetS-free group was the youngest.

The MetS-recovery group included the largest propor- tion of male examinees. The MetS-developed group and the MetS-recovery group had relatively similar baseline values. However, there was a notable difference between these two groups with regard to BMI. With regard to the MetS component parameters, the MetS-free and MetS- recovery groups evidently had better characteristics than did those with MetS during the follow-up period. How- ever, the MetS-recovery group still had worse MetS pa- rameters than did the MetS-free group.

Incidental CKD risk according to MetS recovery or development

The number of cases of incidental CKD were 44,867 (4.3%), 11,141 (2.5%), 5,723 (1.9%) and 45,029 (1.0%) in the MetS-chronic, MetS-developed, MetS-recovery, and MetS-free groups, respectively. There was persistent al- buminuria (until the final exam) in 41,297 (4.0%), 10,470 (2.4%), 4,803 (1.6%), and 52,757 (1.2%) individuals in the MetS-chronic, MetS-developed, MetS-recovery, and MetS-free groups, respectively. In our regression analysis, the risk of incidental CKD was the highest in the MetS- chronic group, followed in order by the MetS-developed, MetS-recovery, and MetS-free groups (Fig. 3). The risk of albuminuria followed the same order. The associations remained valid in our multivariable analysis, which was adjusted for socio-clinical variables (including income status), BMI and comorbidity burden (represented by CCI). In the intergroup analysis, which adjusted for previous MetS severity (Table 2), people who recovered from previous MetS showed a significantly lower risk of incidental CKD, even after adjustment for the previous MetS severity. The adjusted odds for incidental CKD was approximately 0.7-fold of those who maintained their chronic MetS status. The odds of the presence of albu- minuria were nearly half. In contrast, those who newly developed MetS showed a significantly increased risk of consequent CKD. The size of the association was even greater with the albuminuria outcome. Conversely, the MetS recovery group still showed a higher risk of inci- dental CKD or albuminuria than did the MetS-free group.

However, the size of the risk difference was relatively small. The MetS-developed group had a lower risk of in- cidental CKD or albuminuria than did the MetS chronic

Ta ble 2. Compa rison of a dv er se stu dy ou tcomes be tw een the study gr ou ps with a djustmen t f or se verity of b aselin e or pr eviou s Me tS Mo de l 1 (nu mber o f pre se nt Me tS co m po ne nts adju st ed) a Mo de l 2 (me asu red valu es o f Me tS crit eria adju st ed) b Albuminu ria Incide ntal CKD Albu minu ria Incide ntal CKD Adju st ed H R (95% CI) P v alu e Adju st ed H R (95% CI) P v alu e Adju st ed HR (95% CI) P v alu e Adju st ed HR (95% CI) P v alu e Int ergr ou p analysis with ad ju stme nt of pr evio us Me tS se verity c R eco ve ry fr om Me tS (re f. = Me tS-chr onic gr ou p) 0.56 (0.54 - 0.58) < 0.00 1 0.7 4 (0.72 - 0.7 7) < 0.00 1 0.58 (0.56 - 0.60) < 0.00 1 0.7 4 (0.72 - 0.7 6) < 0.00 1 De ve lo pme nt of Me tS (re f. = Me tS-fre e gr ou p) 1.58 (1 .54 - 1.62) < 0.00 1 1.2 7 (1 .2 4- 1.30) < 0.00 1 1.54 (1 .50 - 1.58) < 0.00 1 1.26 (1 .23 - 1.29) < 0.00 1 Int ergr ou p analysis with adju stme nt of base line Me tS se ve rity d Pre viou s hist or y o f Me tS (Me tS-re co ve ry , ref. = Me tS-fre e) 1.1 6 ( 1.1 3- 1.20) < 0.00 1 1.1 3 ( 1.1 0- 1. 17 ) < 0.00 1 1.1 5 ( 1.1 1- 1. 18 ) < 0.00 1 1. 11 (1 .08 - 1.1 5) < 0.00 1 Pre viou sly fre e fr om Me tS (Me tS-de ve lope d, re f. = Me tS-chr onic) 0.73 (0.72 - 0.75) < 0.00 1 0.8 4 (0.82 - 0.86) < 0.00 1 0.7 7 (0.75 - 0.78) < 0.00 1 0.8 4 (0.82 - 0.86) < 0.00 1 CI, co nf ide nce int er val; CKD, chr onic kidne y dise ase ; H R, hazar d ratio ; Me tS, me tabo lic synd ro me . The base multi vari able model i ncluded the f ollo wi ng v ari ables at the i nclusi on dat e: age, se x, lo w i ncome, Charlson comorbi di ty i nde x scores, body mass i nde x, and baseli ne laborat or y parame ter s, i nclu di ng estimat ed glo me ru lar f iltratio n rat e, aspar tat e amino transf erase /alanine amino transf erase , he moglobin, and the pre se nce of dipstick albu minu ria. a In addition t o the var iable s, the nu mbe r o f pre se nt Me tS co m pone nts w as adju st ed in mo de l 1 . b The mo de l w as same as the mo de l 1 ex ce pt that actu al me asu re d parame te rs o f Me tS crit eria be ing inclu de d in the mo de l inst ead the nu mbe r o f pre se nt com po ne nts. c In int ergr ou p analysis 1 , the pr eviou s Me tS parame te rs w ere ad ju st ed, as the stu dy gr ou ps had same Me tS pre se nce /abse nce stat e in the pr eviou s pe rio d. d In int ergr ou p analysis 2, the base line Me tS parame te rs w ere adju st ed , as the Me tS pre se nce /abse nce stat e w as the same d uring the fo llo w-u p pe rio d.

(8)

group, despite both groups having MetS during the fol- low-up period.

MetS components and risk of incidental CKD

We investigated which components were associated with the largest change in risk of incidental CKD (Fig.

4). The newly fulfilled high blood pressure criterion for MetS was associated with the highest risk elevation of CKD and albuminuria. The other components showed relatively similar association sizes. However, the develop- ment of impaired fasting glucose was associated with the second largest increased risk of albuminuria. Regarding recovery, the association sizes were similar for each MetS component regarding incidental CKD outcomes. With regard to albuminuria outcomes, recovery from previous impaired fasting glucose was associated with the largest risk reduction. Furthermore, the associations and their sizes remained similar in our intergroup analysis, which was additionally adjusted for the previous metabolic pa- rameters (Table 3).

Discussion

In this nationwide population-based study of more than 6 million people without baseline kidney dysfunc-

tion, approximately 5% of individuals recovered from preexisting MetS and a similar portion newly developed MetS. Recovery from MetS was significantly associated with decreased risk of incidental CKD. In contrast, peo- ple who developed MetS had a higher CKD risk than did those who did not develop MetS. However, individuals who newly developed MetS still had a lower risk of inci- dental CKD than did those with chronic MetS. Among all MetS criteria, high blood pressure development was the component that was associated with the most substantial CKD risk increase.

The main strength of the present study is that we dem- onstrated that MetS status alteration was significantly associated with a change in CKD risk. To our knowledge, this is the first time that this finding has been reported in a large-scale nationwide study. MetS has been a sig- nificant medical problem, because it is one of the most important risk factors for cardiovascular events (which are the most common causes of death worldwide). A sig- nificant association between MetS and incidental CKD has also been previously reported, which was indepen- dent of individual MetS components, such as established diabetes or hypertension [12,15,16]. However, whether decreased CKD risk is observed in those who recovered from preexisting MetS has only been rarely reported in large cohorts. The evidence is finally shown in the current

WC BP IFG Tg HDL 2

1

0.5 Adjusted OR (log scale) 2

Development of each MetS component

Incidental CKD Albuminuria

Recovery of each MetS component WC BP IFG Tg HDL

WC BP IFG Tg HDL 4

2

1

0.5

0.25 Adjusted OR (log scale) 2

Development of each MetS component

Recovery of each MetS component WC BP IFG Tg HDL

Figure 4. Changes in metabolic syndrome (MetS) components and their associations with the risks of the study outcomes. Com- parisons were performed between the MetS-recovery vs. MetS-chronic groups and between the MetS-developed vs. MetS-free groups. We analyzed whether the change in each component, which persisted until the last health exam, had a different risk on the study outcomes compared to those who maintained states. The y-axes indicate the adjusted odds ratios (ORs) in log 2 scale. The vertical lines indicate the confidence intervals. Multivariable analysis was adjusted with the following variables at the inclusion date: age, sex, low-income status, body mass index, and baseline laboratory parameters (including estimated glomerular filtration rate, aspartate aminotransferase/alanine amino- transferase, hemoglobin), and the presence of dipstick albuminuria.

BP, blood pressure; CKD, chronic kidney disease; HDL, high-density lipoprotein; IFG, impaired fasting glucose; Tg, triglycerides; WC, waist cir-

cumference.

(9)

study. The unique database of national health screenings with repetitive assessments of MetS and kidney function enabled us to define the dynamic MetS statuses and re- nal outcomes. Our population-based results suggest that emerging CKD-related health problems might be amelio- rated through the prevention or reversal of MetS [24,25].

MetS is a cluster of traditional cardiovascular risk fac- tors, including the most common causes of CKD. There- fore, a direct cause-effect relationship with MetS and CKD, beyond the effects of individual components, is debatable. However, previous studies have suggested

that MetS is independently associated with CKD, and that the components of MetS are interrelated [12,15,16].

Additional studies are needed to determine whether a synergistic or additive effect of MetS components for pro- gressive kidney function decline exists. Nevertheless, our study suggests that repetitive assessments for MetS are important to predict an individual’s consequent risk of incidental CKD in a population.

Another notable finding in the study was that those who recovered from preexisting MetS still had a higher risk of CKD than did those in the MetS-free group. This Table 3. Comparison of adverse study outcomes between the study groups according to changes in MetS components

Model 1 a Model 2 b

Adjusted HR (95% CI) P value Adjusted HR (95% CI) P value Incidental CKD

Developed components (in MetS-developed vs. MetS-free)

Central obesity 1.23 (1.17-1.29) <0.001 1.24 (1.18-1.31) <0.001

High blood pressure 1.36 (1.29-1.44) <0.001 1.37 (1.29-1.44) <0.001

Impaired fasting glucose 1.20 (1.15-1.26) <0.001 1.25 (1.19-1.31) <0.001

Dyslipidemia, Tg 1.30 (1.25-1.34) <0.001 1.27 (1.22-1.31) <0.001

Dyslipidemia, HDL 1.29 (1.25-1.34) <0.001 1.28 (1.24-1.33) <0.001

Recovered components (in MetS-recovery vs. MetS-chronic)

Central obesity 0.73 (0.69-0.78) <0.001 0.71 (0.67-0.76) <0.001

High blood pressure 0.65 (0.61-0.69) <0.001 0.65 (0.61-0.69) <0.001

Impaired fasting glucose 0.71 (0.67-0.75) <0.001 0.73 (0.68-0.770) <0.001

Dyslipidemia, Tg 0.71 (0.68-0.74) <0.001 0.71 (0.68-0.74) <0.001

Dyslipidemia, HDL 0.81 (0.77-0.84) <0.001 0.78 (0.75-0.82) <0.001

Albuminuria

Developed components (in MetS-developed vs. MetS-free)

Central obesity 1.73 (1.65-1.83) <0.001 1.72 (1.63-1.81) <0.001

High blood pressure 2.34 (2.22-2.46) <0.001 2.24 (2.13-2.36) <0.001

Impaired fasting glucose 1.98 (1.89-2.07) <0.001 2.03 (1.94-2.13) <0.001

Dyslipidemia, Tg 1.68 (1.62-1.74) <0.001 1.62 (1.56-1.68) <0.001

Dyslipidemia, HDL 1.54 (1.49-1.60) <0.001 1.49 (1.43-1.55) <0.001

Recovered components (in MetS-recovery vs. MetS-chronic)

Central obesity 0.60 (0.56-0.65) <0.001 0.60 (0.56-0.64) <0.001

High blood pressure 0.46 (0.43-0.49) <0.001 0.47 (0.44-0.50) <0.001

Impaired fasting glucose 0.39 (0.36-0.42) <0.001 0.44 (0.41-0.47) <0.001

Dyslipidemia, Tg 0.59 (0.56-0.62) <0.001 0.60 (0.57-0.63) <0.001

Dyslipidemia, HDL 0.49 (0.45-0.53) <0.001 0.65 (0.62-0.69) <0.001

CI, confidence interval; CKD, chronic kidney disease; HDL, high-density lipoprotein; HR, hazard ratio; MetS, metabolic syndrome; Tg, triglycerides.

The base multivariable model included the following variables at the inclusion date: age, sex, low income, Charlson comorbidity index scores, body mass index, and baseline laboratory parameters, including estimated glomerular filtration rate, aspartate aminotransferase/alanine aminotransferase, hemoglobin, and the presence of dipstick albuminuria.

a In addition to the variables included in the base model, the number of present MetS components in the health exam just before the inclusion was adjusted in the

model 1. b The model was same as the model 1 except for the actual measured parameters of MetS criteria being included in the model instead of the number of

present components.

(10)

relationship was true even after adjustment for previous metabolic profiles. This finding could be understood by the chronic changes that are induced by previous MetS, which may not be fully reversible in a few years [30]. Our finding that the MetS-developed group still had a lower risk of CKD than did the MetS-chronic group also sup- ports our hypothesis, because the burden of MetS might have already accumulated in people with chronic MetS.

Overall, this finding suggests the clinical relevance of chronic MetS or a previous history of MetS, implying health providers should pay close attention to such his- tory.

The development of high blood pressure was related to the highest risk increase of CKD among MetS com- ponents. Clinicians may closely monitor one’s elevated blood pressure when considering CKD risks. However, the other metabolic factors should not be overlooked, because all of its components were significantly related to the risk of CKD. For instance, impaired fasting glucose was associated with consequent albuminuria, which is simply understood based on the pathophysiologic conse- quences of diabetic nephropathy [31].

Our study has several limitations. First, given its ret- rospective nature, changes in MetS status may have been affected by other coexisting medical conditions.

Although we attempted to adjusted the effects of differ- ences in important characteristics (e.g. BMI, comorbidity burden, and metabolic parameters), unincluded con- founders might have been present. In addition, whether an intervention to reduce or prevent MetS would actually lead to improved CKD burden in a population could not have been directly proved herein. This study provides epidemiologic evidence of MetS and its relationship with CKD. Still, further interventional or etiologic studies are warranted in the future. A second limitation is the rela- tively short follow-up duration of this study, particularly when assessing chronic outcomes such as CKD. A longer follow-up may have allowed us to determine whether the prolonged MetS-recovery state could attain a similar risk of CKD as did the MetS-free group. Conversely, our study suggested that only a few years of follow-up was neces- sary to observe significant changes in CKD risk according to MetS. A third limitation of this study is that the serum creatinine values were not measured using the current- standard IDMS-traceable method. In addition, an inter- center variance might have been present. Fourth, the

included kidney function measurement was mostly per- formed biennially or annually. These measurements may have caused inclusion of transient renal function changes as CKD. Nevertheless, an annual or biennial examina- tion would reflect the actual practice pattern, since our subjects were relatively healthy people who underwent general health screenings. Finally, although this study in- cluded overt diabetes or hypertension as components of MetS, the direct proportions of established hypertension or diabetes were not presented. Therefore, it was difficult to compare this study with other previous studies that fo- cused on early MetS [32-34].

In conclusion, a population’s recovery from MetS was significantly associated with reduced risk of CKD. People who develop MetS should be evaluated for incidental CKD. A public intervention to reduce or prevent MetS may help to reduce CKD-related health burden.

Conflicts of interest

All authors have no conflicts of interest to declare.

Funding

This work was supported by a grant from the Korea Healthcare Technology R&D Project, Ministry of Health and Welfare, Republic of Korea (HI17C0530). The funders had no role in study design, data collection and analy- sis, decision to publish, or manuscript preparation. This study used the database from the NHIS of Korea. The ap- proach was approved by the organization (NHIS-2017-1- 346).

Authors’ contributions

Sehoon Park, Hajeong Lee, Kwon Wook Joo, and Dong Ki Kim contributed to the conception and design of the study. Sehoon Park, Soojin Lee, Yaerim Kim, Yeonhee Lee, Min Woo Kang, Kyungdo Han, Jung Pyo Lee, Kwon Wook Joo, Chun Soo Lim, Yon Su Kim, and Dong Ki Kim provided statistical expertise and interpreted the data.

Sehoon Park and Kyungdo Han performed the main sta-

tistical analysis, assisted by Soojin Lee. Hajeong Lee, Jung

Pyo Lee, Kwon Wook Joo, Chun Soo Lim, and Yon Su Kim,

and Dong Ki Kim offered advisement regarding the data

interpretation. Dong Ki Kim obtained funding and super-

(11)

vised the overall project. All of the authors contributed to the manuscript. All of the authors reviewed the manu- script and approved the final version to be published.

References

[1] Sundström J, Risérus U, Byberg L, Zethelius B, Lithell H, Lind L. Clinical value of the metabolic syndrome for long term prediction of total and cardiovascular mortal- ity: prospective, population based cohort study. BMJ 2006;332:878-882.

[2] Jeppesen J, Hansen TW, Rasmussen S, Ibsen H, Torp- Pedersen C, Madsbad S. Insulin resistance, the metabolic syndrome, and risk of incident cardiovascular disease: a population-based study. J Am Coll Cardiol 2007;49:2112- 2119.

[3] Gami AS, Witt BJ, Howard DE, et al. Metabolic syndrome and risk of incident cardiovascular events and death: a sys- tematic review and meta-analysis of longitudinal studies. J Am Coll Cardiol 2007;49:403-414.

[4] Lakka HM, Laaksonen DE, Lakka TA, et al. The metabolic syndrome and total and cardiovascular disease mortality in middle-aged men. JAMA 2002;288:2709-2716.

[5] Wannamethee SG, Shaper AG, Lennon L, Morris RW. Meta- bolic syndrome vs Framingham Risk Score for prediction of coronary heart disease, stroke, and type 2 diabetes mel- litus. Arch Intern Med 2005;165:2644-2650.

[6] Nakao YM, Miyamoto Y, Ueshima K, et al. Effectiveness of nationwide screening and lifestyle intervention for ab- dominal obesity and cardiometabolic risks in Japan: the metabolic syndrome and comprehensive lifestyle interven- tion study on nationwide database in Japan (MetS ACTION- J study). PLoS One 2018;13:e0190862.

[7] Ensenyat A, Espigares-Tribo G, Machado L, et al. Metabolic risk management, physical exercise and lifestyle coun- selling in low-active adults: controlled randomized trial (BELLUGAT). BMC Public Health 2017;17:257.

[8] Yang HK, Han K, Kwon HS, et al. Obesity, metabolic health, and mortality in adults: a nationwide population-based study in Korea. Sci Rep 2016;6:30329.

[9] Ng M, Fleming T, Robinson M, et al. Global, regional, and national prevalence of overweight and obesity in children and adults during 1980-2013: a systematic analysis for the Global Burden of Disease Study 2013. Lancet 2014;384:766- 781.

[10] Roth GA, Forouzanfar MH, Moran AE, et al. Demographic

and epidemiologic drivers of global cardiovascular mortal- ity. N Engl J Med 2015;372:1333-1341.

[11] Lee SE, Han K, Kang YM, et al. Trends in the prevalence of metabolic syndrome and its components in South Korea:

findings from the Korean National Health Insurance Ser- vice Database (2009-2013). PLoS One 2018;13:e0194490.

[12] Locatelli F, Pozzoni P, Del Vecchio L. Renal manifestations in the metabolic syndrome. J Am Soc Nephrol 2006;17(4 Suppl 2):S81-S85.

[13] Ejerblad E, Fored CM, Lindblad P, Fryzek J, McLaughlin JK, Nyrén O. Obesity and risk for chronic renal failure. J Am Soc Nephrol 2006;17:1695-1702.

[14] Perneger TV, Klag MJ, Feldman HI, Whelton PK. Projec- tions of hypertension-related renal disease in middle-aged residents of the United States. JAMA 1993;269:1272-1277.

[15] Chen J, Muntner P, Hamm LL, et al. The metabolic syn- drome and chronic kidney disease in U.S. adults. Ann In- tern Med 2004;140:167-174.

[16] Chang Y, Ryu S, Choi Y, et al. Metabolically healthy obe- sity and development of chronic kidney disease: a cohort study. Ann Intern Med 2016;164:305-312.

[17] Park S, Lee S, Kim Y, et al. Altered risk for cardiovascular events with changes in the metabolic syndrome status: a nationwide population-based study of approximately 10 million persons. Ann Intern Med 2019 Nov 26 [Epub]. DOI:

10.7326/M19-0563.

[18] Chang AR, Chen Y, Still C, et al. Bariatric surgery is associ- ated with improvement in kidney outcomes. Kidney Int 2016;90:164-171.

[19] Athyros VG, Karagiannis A, Ganotakis ES, et al. Associa- tion between the changes in renal function and serum uric acid levels during multifactorial intervention and clini- cal outcome in patients with metabolic syndrome. A post hoc analysis of the ATTEMPT study. Curr Med Res Opin 2011;27:1659-1668.

[20] Carville S, Wonderling D, Stevens P. Early identification and management of chronic kidney disease in adults: summary of updated NICE guidance. BMJ 2014;349:g4507.

[21] James MT, Hemmelgarn BR, Tonelli M. Early recognition and prevention of chronic kidney disease. Lancet 2010;

375:1296-1309.

[22] Jain N, Reilly RF. Effects of dietary interventions on inci- dence and progression of CKD. Nat Rev Nephrol 2014;10:

712-724.

[23] Wang Y, Chen X, Song Y, Caballero B, Cheskin LJ. Associa-

tion between obesity and kidney disease: a systematic re-

(12)

view and meta-analysis. Kidney Int 2008;73:19-33.

[24] Jha V, Garcia-Garcia G, Iseki K, et al. Chronic kidney dis- ease: global dimension and perspectives. Lancet 2013;382:

260-272.

[25] Meguid El Nahas A, Bello AK. Chronic kidney disease: the global challenge. Lancet 2005;365:331-340.

[26] Seong SC, Kim YY, Khang YH, et al. Data resource profile:

the National Health Information Database of the National Health Insurance Service in South Korea. Int J Epidemiol 2017;46:799-800.

[27] Seong SC, Kim YY, Park SK, et al. Cohort profile: the Na- tional Health Insurance Service-National Health Screening Cohort (NHIS-HEALS) in Korea. BMJ Open 2017;7:e016640.

[28] Sundararajan V, Henderson T, Perry C, Muggivan A, Quan H, Ghali WA. New ICD-10 version of the Charlson comor- bidity index predicted in-hospital mortality. J Clin Epide- miol 2004;57:1288-1294.

[29] Alberti KG, Eckel RH, Grundy SM, et al. Harmonizing the metabolic syndrome: a joint interim statement of the Inter- national Diabetes Federation Task Force on Epidemiology and Prevention; National Heart, Lung, and Blood Institute;

American Heart Association; World Heart Federation; In-

ternational Atherosclerosis Society; and International Asso- ciation for the Study of Obesity. Circulation 2009;120:1640- 1645.

[30] Brown BG, Zhao XQ, Sacco DE, Albers JJ. Lipid lowering and plaque regression. New insights into prevention of plaque disruption and clinical events in coronary dis- ease. Circulation 1993;87:1781-1791.

[31] Marcantoni C, Ortalda V, Lupo A, Maschio G. Progression of renal failure in diabetic nephropathy. Nephrol Dial Transplant 1998;13 Suppl 8:16-19.

[32] Kurella M, Lo JC, Chertow GM. Metabolic syndrome and the risk for chronic kidney disease among nondiabetic adults. J Am Soc Nephrol 2005;16:2134-2140.

[33] Emanuelsson F, Marott S, Tybjærg-Hansen A, Nordestgaard BG, Benn M. Impact of glucose level on micro- and mac- rovascular disease in the general population: a Mendelian randomization study. Diabetes Care 2020;43:894-902.

[34] Ryu S, Chang Y, Woo HY, et al. Time-dependent association

between metabolic syndrome and risk of CKD in Korean

men without hypertension or diabetes. Am J Kidney Dis

2009;53:59-69.

수치

Figure 1. Study population criteria and representative scenar- scenar-ios. The diagram shows the process of study population selection
Figure 2. Possible exclusion scenarios. Above, the figure demonstrates the graphical description for the time-windows when information  was collected
Table 1. Baseline characteristics of the study groups according to dynamic metabolic syndrome status
Figure 3. Risk of incidental chronic kidney disease (CKD) and albuminuria in the study groups
+3

참조

관련 문서

Correlation between Results ofthe Multiple Allergosorbent Test-Chemiluminescent Assay(MAST-CLA) and Clinical Severity of Chronic Urticaria. A study of food allergy

Objective: The purpose of this study is to use it as a basis for the health care guidelines for the muscle mass and cardiovascular disease of Korean population by

In the present study, 10 study stations were established, and seasonal changes for various ecological aspects of the community such as species composition, number of

Serum uric acid levels and risk for vascular disease in patients with metabolic syndrome... Prevalence if the metabolic syndrome in a Turkish

This study was conducted to analyze the effects of obesity on the core stability and metabolic syndrome risk factors of middle - aged women.. The effect

One notable and important finding of the present study was that the physical function of frail older adults at baseline, with number of medications, was

To identify causal variants among EGFR SNPs associated with the risk of glioma in a Korean population, a logistic regression analysis under an additive model adjusted for age

Age at diagnosis after 30 years, baseline serum creatinine levels, and cyst infection are the independent risk factors for kidney failure, as found in this