Journal of the Korea Institute of Building Construction, Vol. 12, No. 4
http://dx.doi.org/10.5345/JKIBC.2012.12.4.377 www.jkibc.org
Evaluation of Impact Resistance of Steel Fiber and Organic Fiber Reinforced Concrete and Mortar
Kim, Gyu-Yong
1Hwang, Heon-Kyu
2*Nam, Jeong-Soo
1Kim, Hong-Seop
1Park, Jong-Ho
3Kim, Jeong-Jin
41)Department of Architectural Engineering, Chungnam University, Yuseong-Gu, Daejeon, 305-764, Korea
1Division of Building Works, Hyundai Amco, Seocho-Gu, Seoul, 140-846, Korea
2Building Material, Sampyo Engineering & Construction, Gwangju-Si, Gyeonggi, 464-080, Korea
3Building Material, Lotte Engineering & Construction, Yongsan-Gu, Seoul, 140-846, Korea
4Abstract
In this study, the Impact resistance of steel fiber and organic fiber reinforced concrete and mortar was evaluated and the improvement in toughness resulting from an increase in compressive strength and mixing fiber for impact resistance on performance was examined. The types of fiber were steel fiber, PP and PVA, and these were mixed in at 0.1, 0.5 and 1.0 vol.%, respectively. Impact resistance is evaluated with an apparatus for testing impact resistance performance by high-speed projectile crash by gas-pressure. For the experimental conditions, Specimen size was 100×100×20, 30mm (width×height×thickness). Projectile diameter was 7 and 10 mm and impact speed is 350m/s. After impact test, destruction grade, penetration depth, spalling thickness and crater area were evaluated. Through this evaluation, it was found that as compressive strength is increased, penetration is suppressed. In addition, as the mixing ratio of fiber is increased, the spalling thickness and crater area are suppressed. Organic fibers have lower density than the steel fiber, and population number per unit area is bigger. As a result, the improvement of impact resistance is more significant thanks to dispersion and degraded attachment performance.
Keywords : impact resistance performance, projectile, destruction grade, penetration depth, spalling thickness, crater area
1. Introduction
As brittle failure resulting from earthquake, impact and other factors is a frequent occurrence in cement-based composite materials like mortar and concrete, studies have been conducted to improve toughness through the mixing of fiber.
Fiber is used for reduction in shrinkage, shotcrete, and as a material for repair and reinforcement.
Steel fiber is mainly used due to its excellent toughness. However, though when steel fiber is
Received : December 6, 2011 Revision received : June 12, 2012 Accepted : June 18, 2012
* Corresponding author : Hwang, Heon-Kyu
[Tel: 82-10-5343-1032, E-mail: [email protected]]
ⓒ2012 The Korea Institute of Building Construction, All rights reserved.
mixed, the toughness is more greatly improved than when organic fiber is mixed, under a mix proportion condition, steel fiber has high intensity per unit area, and the volume of steel fiber to be mixed will decrease compared to the organic fiber.
For this reason, the specific surface area of steel fiber is believed to decrease, which leads to rather low attachment performance compared to organic fiber. In Korea, previous research on the impact resistance performance of cement-based composite materials was mainly done under low-speed impact conditions, including static and drop tests.
Recently, a few studies have been conducted under
high-speed impact conditions[1,2]; however, there
are still some restrictions on the evaluation
method and model development. In other countries,
Evaluation of Impact Resistance of Steel Fiber and Organic Fiber Reinforced Concrete and Mortar
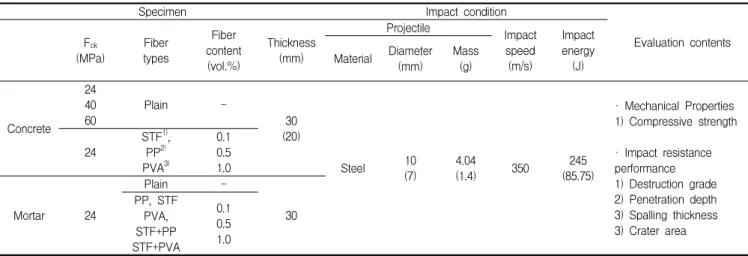
Table 1. Design of experiment
Specimen Impact condition
Evaluation contents F
ck(MPa) Fiber
types
Fiber content
(vol.%)
Thickness (mm)
Projectile Impact
speed (m/s)
Impact energy Material Diameter (J)
(mm) Mass
(g)
Concrete 24 40
60 Plain -
30 (20)
Steel 10
(7) 4.04
(1.4) 350 245
(85.75)
· Mechanical Properties 1) Compressive strength
· Impact resistance performance 1) Destruction grade 2) Penetration depth 3) Spalling thickness 3) Crater area 24 STF
1),
PP
2)PVA
3)0.1 0.5 1.0
Mortar 24
Plain -
PP, STF 30 PVA, STF+PP STF+PVA
0.1 0.5 1.0
1) STF : Steel fiber, 2) PP : Polypropylene, 3) PVA : Polyvinyl alcohol ( ) : Additional experiment condition of concrete considering gravel
cement-based composite materials were tested using an apparatus through a high-speed projectile crash to evaluate the impact resistance performance when given a direct impact[3,4], on which basis an analysis model was developed and tested[5,6]
Hence, this study aims to review the effect of the compressive strength of and fiber mix proportion in mortar and concrete on impact resistance performance under a high-speed crash condition, using an apparatus for testing impact resistance performance by high-speed projectile crash. In addition, considering the thickness of concrete and the crash energy of the high-speed projectile, data on the evaluation of impact resistance performance is collected to be utilized in the future as fundamental data for impact resistance performance design of fiber reinforced cement composite.
2. Experiment plan and method
2.1 Experiment plan
Table 1 shows the experiment plan for this study. Three plain specimens were made at W/B
57, 38 and 29%, respectively, to evaluate the impact of compressive strength on penetration depth. In addition, to evaluate the influence of fiber mix on spalling thickness and crater area, the concrete specimens were made at W/B 57% by adding steel fiber, PP and PVA to be 0.1, 0.5 and 1.0 vol%, respectively. Mortar specimens were made under the same condition as the fiber-reinforced concrete specimens, and specimens were also made by adding the same proportion of steel fiber+PP and steel fiber+PVA, respectively, as the single mix condition. The projectile crash test was performed under the test condition of specimen 30 mm thickness, projectile 10 mm diameter, and crash speed 350m/s. Another test was conducted under the condition of specimen 20 mm thickness, projectile 7 mm diameter and crash speed 350 m/s, in consideration of the effect of aggregate.
The compressive strength was evaluated as the
mechanical property, and the impact resistance
performance was evaluated by inspecting the
surface of the specimens including destruction
grade, penetration depth, spalling thickness and
crater area.
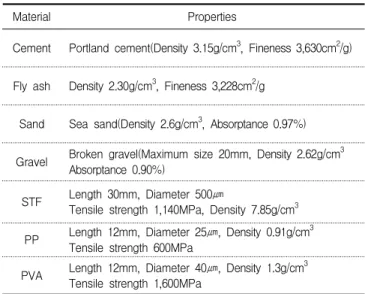
As shown in Table 2, the materials used in this study are Portland cement manufactured by S company (density of 3.15g/cm 3 ), and fly ash (density of 2.30g/cm 3 ) used as an admixture. Sea sand was used as fine aggregate and broken gravel (maximum size of 20mm) was used as coarse aggregate. The types of fiber were steel fiber, PP and PVA.
Table 2. Properties of material
Material Properties
Cement Portland cement(Density 3.15g/cm
3, Fineness 3,630cm
2/g)
Fly ash Density 2.30g/cm
3, Fineness 3,228cm
2/g
Sand Sea sand(Density 2.6g/cm
3, Absorptance 0.97%)
Gravel Broken gravel(Maximum size 20mm, Density 2.62g/cm
3Absorptance 0.90%)
STF Length 30mm, Diameter 500㎛
Tensile strength 1,140MPa, Density 7.85g/cm
3PP Length 12mm, Diameter 25㎛, Density 0.91g/cm
3Tensile strength 600MPa
PVA Length 12mm, Diameter 40㎛, Density 1.3g/cm
3Tensile strength 1,600MPa
2.3 Experiment method
2.3.1 Concrete and mortar mixing method
The mix proportion of concrete and mortar is as indicated in Table 3. The air content was controlled by 1.1~1.2% from 4% to prevent deterioration to the fiber attachment by air content. When the fiber mixed concrete is applied to the actual members, the decrease in air content would not cause any significant differences, since the members would be affected little by freezing-thawing. The fiber was mixed using a 100L-volume forced pan-type mixer to spread fiber evenly and satisfy the target flowability.
F
ck(MPa) W/B (%) S/a
(%)
Unit weight(kg/m
3)
W C FA S G
Concrete
24 57 49 185 276 49 864 906
40 38 47 170 380 67 796 905
60 29 45 162 475 84 728 896
Mortar 24 57 100 240 358 63 1535 -
40rpm 40rpm 40rpm
Aggregate + Binder
+ Fiber
Dry mixing Water + (Admixture)
Mortar Gravel +
Finish
None fiber (30s) Fiber (60s)
None fiber (90s) Fiber (180∼400s)
Enough mix
Figure 1. Concrete and mortar mixing method
2.3.2 Test specimen manufacture
A cylindrical test specimen with dimensions of 100x200mm was manufactured to test compressive strength. An angular specimen with dimensions of 100x100x400mm was manufactured and then water cured for 28 days. As shown in Figure 2, the specimen was cut to 20 and 30 mm thick.
Figure 2. Specimen for evaluation of impact resistance performance
2.3.3 Compressive strength test
The compressive strength was measured using a
UTM after grinding the specimen at a certain age
Evaluation of Impact Resistance of Steel Fiber and Organic Fiber Reinforced Concrete and Mortar
in compliance with the Test Method of Concrete Compressive Strength stipulated in KS F 2405.
2.3.4 Performance evaluation of impact resistance Figure 3 illustrates the apparatus for testing using a high-velocity projectile that ejects compressed gas at a given time to operate the projectile carrier. The velocity of the projectile was measured using a speed measuring sensor that is attached immediately before the test specimen chamber. The carrier was manufactured for the projectile to be separated from the carrier in the chamber to give an impact to the specimen. For the performance evaluation, nitrogen gas was used to provide the velocity of 350m/s.
<Carrier, Projectile>
<Specimen> <Separation plate>
Figure 3. Apparatus for testing impact resistance performance by high velocity impact of projectile
The conventional evaluation method was set only for evaluation at a low velocity range, and it is difficult to set a standardized evaluation method since the test apparatus and condition for an evaluation at a high velocity range are different for each researcher. Referring to the previous
literature[2,3,5], the performance evaluation was implemented as indicated in Table 4 and Figure 4.
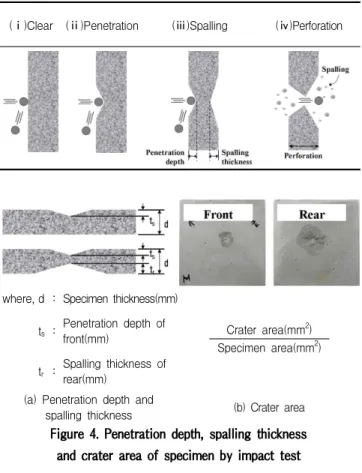
At the 1 st step of the evaluation, the destruction grade was estimated through inspection of the surface shape after a crash test. At the 2 nd step of the evaluation, penetration depth and spalling thickness and crater area were evaluated on the specimens found to have front and rear destruction.
Table 4. Destruction grade of specimen by impact test (ⅰ)Clear (ⅱ)Penetration (ⅲ)Spalling (ⅳ)Perforation
where, d : Specimen thickness(mm) t
s: Penetration depth of
front(mm) Crater area(mm
2)
Specimen area(mm
2) t
r: Spalling thickness of rear(mm)
(a) Penetration depth and
spalling thickness (b) Crater area Figure 4. Penetration depth, spalling thickness and crater area of specimen by impact test
3. Experiment results and considerations
3.1 Mechanical properties
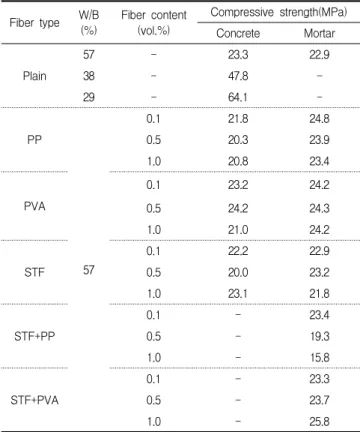
Table 5 indicates the compressive strength of
concrete and mortar at 28 days. The compressive
strength showed by plain concrete at W/B 38 and
29% was 27.8MPa and 64.1MPa, respectively. The
compressive strength of plain concrete and
being between 15 and 24MPa. The more fiber was mixed, the lower the compressive strength due to the mixing of heterogeneous material in concrete, but there were no significant differences that could affect the research.
Table 5. Compressive strength of concrete and mortar Fiber type W/B
(%) Fiber content (vol.%)
Compressive strength(MPa) Concrete Mortar
Plain
57 - 23.3 22.9
38 - 47.8 -
29 - 64.1 -
PP
57
0.1 21.8 24.8
0.5 20.3 23.9
1.0 20.8 23.4
PVA
0.1 23.2 24.2
0.5 24.2 24.3
1.0 21.0 24.2
STF
0.1 22.2 22.9
0.5 20.0 23.2
1.0 23.1 21.8
STF+PP
0.1 - 23.4
0.5 - 19.3
1.0 - 15.8
STF+PVA
0.1 - 23.3
0.5 - 23.7
1.0 - 25.8
3.2 Impact resistance performance
3.2.1 Destruction grade estimation through inspection of the surface shape
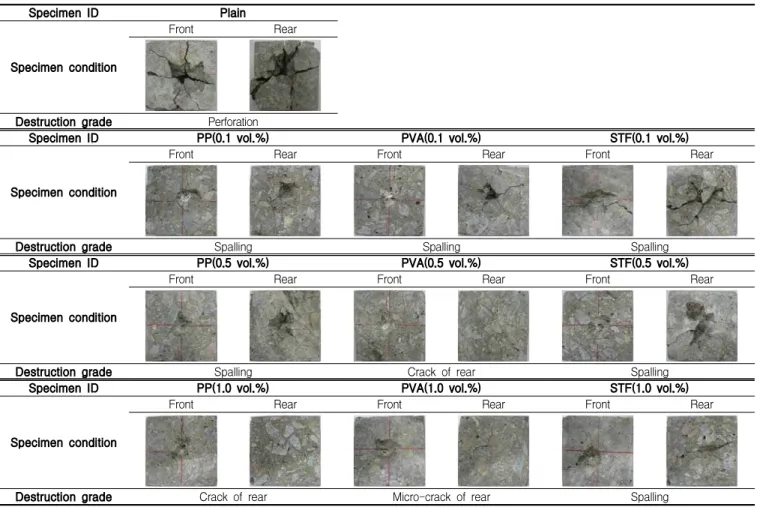
Tables 6 and 7 are the surface shape and destruction grade of the concrete and mortar specimens after the test. Perforation was found both on the plain concrete and mortar specimens. On the other hand, penetration and spalling were found on the front and rear, respectively, of the fiber-mixed specimens. The larger the volume of fiber mixed, the less rear spalling was found.
Figure 5 illustrates the penetration depth by compressive strength after the crash test.
Perforations were found on the concrete with compressive strength of 24MPa and 40MPa under the test condition of the specimen 30mm thickness, the projectile 10mm diameter and crash velocity of 350m/s, while penetration and spalling were found on the front and rear, respectively, of the concrete with a compressive strength of 60MPa. Penetration and spalling were found on the front and rear of all the specimens under the test condition of specimen 20 mm thickness, projectile 7 mm diameter and the crash velocity of 350m/s. The penetration depth by the high-velocity projectile was decreased as the compressive strength was increased, and there was no effect found by the fiber mixing.
0 10 20 30 40
0 20 40 60 80
Compressive stength(MPa)
P e n e tr a tio n d e p th (m m )
24
Specimen thickness : 30mm Impact speed : 350m/s
Projectile diameter ■ : 10mm □ : 7mm Perforation
Figure 5. Penetration depth by compressive strength(concrete)
3.2.3 Rear spalling control by fiber type and content
Figures 6 and 7 illustrate spalling thickness and
crater area by fiber type and content. The fiber
mix proportion was increased to be 0.1, 0.5 and
1.0 vol.%, and the spalling thickness and crater
area were decreased accordingly. In addition, the
specimen with steel fiber 1.0 vol.% showed
penetration on the front and spalling on the rear
while the specimen mixed PVA fiber at 0.5vol% did
Evaluation of Impact Resistance of Steel Fiber and Organic Fiber Reinforced Concrete and Mortar
Table 6. Destruction grade of Concrete
Specimen ID Plain
Specimen condition
Front Rear
Destruction grade Perforation
Specimen ID PP(0.1 vol.%) PVA(0.1 vol.%) STF(0.1 vol.%)
Specimen condition
Front Rear Front Rear Front Rear
Destruction grade Spalling Spalling Spalling
Specimen ID PP(0.5 vol.%) PVA(0.5 vol.%) STF(0.5 vol.%)
Specimen condition
Front Rear Front Rear Front Rear
Destruction grade Spalling Crack of rear Spalling
Specimen ID PP(1.0 vol.%) PVA(1.0 vol.%) STF(1.0 vol.%)
Specimen condition
Front Rear Front Rear Front Rear
Destruction grade Crack of rear Micro-crack of rear Spalling
not show any spalling on the rear. Moreover, in the comparison of spalling thickness and crater area by fiber type at each mix proportion, the spalling thickness and the crater area was decreased in the order of PVA>PP>steel fiber.
In the research findings, when PVA, an organic fiber, was added at 1.0 vol.%, the rear spalling control was shown to be the highest. It is believed that provided that flowability is not affected, the higher the volume of fiber added, the more the spalling thickness and the crater area are decreased.
3.2.4 Rear spalling control by fiber hybrid condition Figures 8 and 9 illustrate the spalling thickness and the crater area under the fiber hybrid condition. When the steel fiber was mixed with PP
or PVA, the spalling thickness and the crater area were further decreased, improving the rear saplling control, compared to when single fiber was mixed.
This is believed to be due to the fact that when the population number of organic fiber was increased, it affected the rear spalling control, and finally improved the rear spalling control.
3.2.5 Impact resistance performance of steel fiber and organic fiber
The analysis of the spalling thickness and the
crater area by fiber type and content under single
fiber condition or fiber hybrid condition showed
that the spalling thickness and the crater area
were more significantly decreased when organic
fiber was mixed together than when steel fiber was
Specimen condition
Front Rear Front Rear Front Rear
Destruction grade Perforation Spalling Spalling
Specimen ID STF(0.1 vol.%) STF+PP(0.1 vol.%) STF+PVA(0.1 vol.%)
Specimen condition
Front Rear Front Rear Front Rear
Destruction grade Spalling Spalling Spalling
Specimen ID PP(0.5 vol.%) PVA(0.5 vol.%) STF(0.5 vol.%)
Specimen condition
Front Rear Front Rear Front Rear
Destruction grade Crack of rear Crack of rear Spalling
Specimen ID STF+PP(0.5 vol.%) STF+PVA(0.5 vol.%)
Specimen condition
Front Rear Front Rear
Destruction grade Spalling Spalling
Specimen ID PP(1.0 vol.%) PVA(1.0 vol.%) STF(1.0 vol.%)
Specimen condition
Front Rear Front Rear Front Rear
Destruction grade Crack of rear Micro-crack of rear Spalling
Specimen ID STF+PP(1.0 vol.%) STF+PVA(1.0 vol.%)
Specimen condition
Front Rear Front Rear
Destruction grade Spalling Penetration
mixed only. Under a mix proportion, the population number of organic fiber per unit area was more than that of steel fiber due to its low density, which is considered to improve the distribution in the matrix as well as the attachment performance.
In addition, as illustrated in Figure 10, as the
crash impact tends to be delivered to the rear
radially, the rear spalling shape was identical to
the crash impact direction in the plain specimens
and organic fiber mixed specimens. However, it was
shown that the steel fiber mixed specimens were
significantly affected by the fiber arrangement.
Evaluation of Impact Resistance of Steel Fiber and Organic Fiber Reinforced Concrete and Mortar
0 10 20 30 40
0 0.1 0.5 1.0 0.1 0.5 1.0 0.1 0.5 1.0 Fiber types and contents(vol.%)
S p a lli n g t h ic k n e s s (m m )
Plain PP PVA STF
Impact Speed : 350m/s
Perforation
□ : Specimen thickness : 20mm Projectile diameter : 7mm , ▲ : Specimen thickness : 30mm Projectile diameter : 10mm