ORIGINAL ARTICLE
Study on the Synoptic Meteorological Characteristics of Windstorms Occurring on the Korean Peninsula
Jong-Kil Park
1), Woo-Sik Jung
2), Eun-Byul Kim
3)*, Bo-Ram Lee
2)1)
Dept. of Environmental Engineering, Atmospheric Environment Information Research Center, Inje University, Gimhae 621-749, Korea
2)
Dept. of Atmospheric Environment Information Engineering, Atmospheric Environment Information Research Center, Inje University, Gimhae 621-749, Korea,
3)
Atmospheric Environment Information Research Center, Inje University, Gimhae 621-749, Korea
Abstract
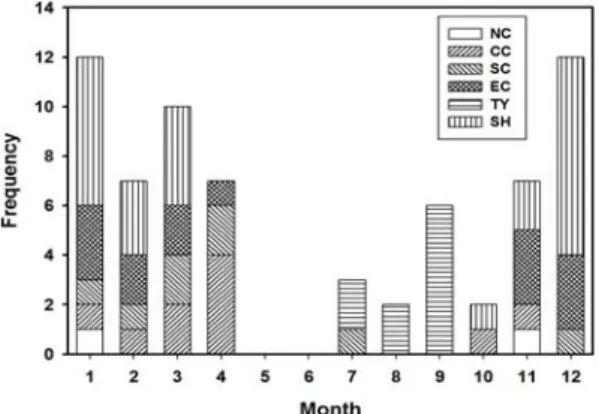
Although most natural disaster related studies conducted in Korea recently have been related to typhoons or severe rainstorms, the occurrence frequency of disasters due to windstorms or rainstorms is also high. To reduce the strong wind damage caused by strong windstorms due to climate change, basic studies of strong winds are necessary. Therefore, in this study, the types and representative cases of windstorms that were observed to have been higher than 14 m/s, which is the criterion for strong-wind warnings from the Korea Meteorological Administration, were selected from among those windstorm cases that occurred on the Korean Peninsula for 10 years to conduct a statistical analysis of them and determine their synoptic meteorological characteristics. The cases of windstorms occurring on the Korean Peninsula were divided into six weather patterns according to the locations of the anticyclones/cyclones. Among these types, the SH type, which occurs when Siberian Highs expand into the Korean Peninsula, showed the highest occurrence frequency, accounting for at least the majority of the entire occurrence frequency of windstorms together with that of the EC type, which occurs when cyclones develop on the East Sea, and there was no clear yearly trend of the occurrence frequencies of windstorms. The monthly occurrence frequencies of windstorms were formed mainly by typhoons in the summer and the Siberian Highs in the winter, and the months with the highest windstorm occurrence frequencies were December and January, in which mainly the SH and EC type windstorms occurred. March showed the next highest occurrence frequency with10 times, and SH windstorms occurred the most frequently in March, followed by the CC, SC, and EC types of windstorms, in order of precedence. Therefore, attention to these types of windstorms is required. Countermeasures against storm and flood damage in Korea targeting the summer should be re-reviewed together with pre-disaster prevention plans, because cases of storm and flood damage due to windstorms occur more frequently than those due to typhoons, and they occur throughout the year.
Key words : Windstorm, Climate change, Wind damage, Weather pattern, Synoptic meteorological characteristics 1) 1. Introduction
Recently, extreme weather due to climate change, such as typhoons, localized torrential downpours, and
droughts, has been continuously increasing throughout the world and the scales of the resultant damage have been growing to the extent that the damage due to weather disasters has amounted to several trillion
Received 22 August, 2014; Revised 15 October, 2014;
Accepted 20 October, 2014
*
Corresponding author : Eun-Byul Kim, Atmospheric Environment Information Research Center, Inje University, Gimhae 621-749, Korea Phone: +82-55-321-3252
E-mail: [email protected]
ⓒ The Korean Environmental Sciences Society. All rights reserved.
This is an Open-Access article distributed under the terms of the Creative Commons Attribution Non-Commercial License (http://
creativecommons.org/licenses/by-nc/3.0) which permits unrestricted
non-commercial use, distribution, and reproduction in any medium,
provided the original work is properly cited.
won in Korea since the beginning of the 2000s (Park et al., 2005, 2007). This is attributable to increases in sea surface temperatures due to climate change not only in the tropical oceans, but also in the seas around the Korean Peninsula, resulting in increases in the scales of typhoons or windstorms as well as in the occurrence frequency of very strong winds (Berz and Conrad, 1993; KMA, 2005).
In reviewing the studies related to strong wind damage, it was found that the amount of strong wind damage that occurred on the Korean Peninsula in April and October 2005 was approximately 9.3 billion won, accounting for approximately 0.9% of the entire amount of damage on the Korean Peninsula during the same year (Hong, 2007). In 2012, when many typhoons in particular attacked the Korean Peninsula and the entire amount of damage due to natural disasters was 1.89 trillion won, the amount of damage due to strong winds was approximately 26.71 billion won, corresponding to 2.5% of the entire amount of damage, and the number of died victims was 33(NEMA, 2013). This indicates that the human and property damage caused by strong wind is not small.
In the case of foreign countries, due to increases in windstorms following climate change, disaster prediction models are being studied to reduce wind damage due to windstorms, and the results are reflected in the insurance industry. The series of winter windstorms that hit Western Europe at the end of the 1980s and at the beginning of the 1990s caused damage exceeding several billion dollars and caused huge economic losses to the insurance industry (Berz and Conrad, 1993). This series of windstorm events greatly affected not only the Netherlands, but also British society, resulting in changes in building codes as well as attracting people’s attention to studies about preventing windstorm disasters that may occur in the future, characteristics analysis, and disaster prediction modeling (Clark, 1986; Mitchell et al.,
1989; Re, 1993; Dorland et al., 1999).
However, most natural disaster related studies that have been conducted in Korea thus far are related to typhoons or severe rainstorms, and most of the strong wind damage related studies analyzed strong wind damage cases due to typhoons (Park et al., 2008; Lee et al., 2009; Jung et al., 2010).
The level of perception of the risk of typhoons or heavy rain is relatively high, because the government or local governments extensively publicize natural disasters, such as typhoon, flood, and Asian dust before the disasters occur. However, although strong wind was third in the rankings of the amounts of damage as of 2012 and strong wind damage is still occurring, concrete measures to reduce this damage have not been sufficiently prepared. This is because the level of perception of the risk of strong wind is lower compared to that of the other disasters (Hong, 2007; Song and Kim, 2013). Therefore, the awareness of the risk of strong wind should be enhanced, and measures to reduce strong wind damage should be presented through studies of the characteristics of the damage caused by strong winds and the types of strong winds that occur.
The studies of the pressure patterns that cause strong
winds or windstorms include a study conducted by
Ha(1998) that divided the severe weather phenomena
that cause strong winds that become problems when
buildings’ wind resistant designs into typhoons, winds
due to cyclogenesis, frontal winds, and seasonal winds,
and stated that strong winds occur as seasonal winds
caused by west high east low type pressure distributions
resulting from cyclone paths or accompanying fronts
without presenting any statistical data or concrete
cases of strong winds as grounds for that statement. A
study conducted by Kim et al.(2006, 2009) that
reported that the annual average number of days of
strong winds increased two times compared to the
20-year average value, that strong winds were caused
by typhoons the most frequently, that strong winds
were mainly caused by west high east low type pressure distributions or the expansion of Siberian air mass, and that the major regions affected by strong winds showed great differences according to their geographical locations through analyses of the strong wind damage that had occurred on the Korean Peninsula and the characteristics of the occurrences.
Although this study is limited by the fact that the classification of the strong winds does not cover the entire Korean Peninsula because the strong winds were analyzed using hourly wind data from Mokpo, Gunsan, Yeosu, and Wando, where strong winds mainly occur, this study presented the necessity of the construction of measures to respond to strong winds by considering the characteristics of strong winds by region, because buildings are greatly affected by strong winds. Therefore, in future studies of strong winds, windstorm cases occurring on the Korean Peninsula over a long period of time should be selected, the characteristics of the strong winds should be presented through synoptic analyses, and the strong wind types should be classified.
Therefore, in the present study, basic data will be provided that can minimize the windstorm damage that has increased along with climate change and will enable the diagnosis and prediction of windstorms in advance by determining the statistical characteristics of the occurrence of the windstorms that affect the Korean Peninsula and classify the types of weather patterns that cause the windstorms to grasp their synoptic meteorological characteristics.
2. Material and Methods
2.1. Data
The weather data used to select the windstorm cases that occurred on the Korean Peninsula were hourly data from a total of 544 surface weather observatories comprised of 467 Automatic Weather Stations (AWS) throughout the country and 77
observing points of Automated Surface Observing Systems (ASOS). This data was collected for 10 years, from 2001 through 2010. The data used to classify the types of windstorm cases were from printed weather charts issued by the Japan Meteorological Agency and weather charts provided by KMA.
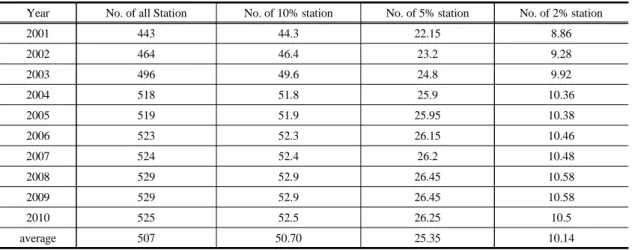
2.2. Windstorm case and type analysis method For the objective classification of the occurrence of windstorm, Dreveton et al. (1998) acknowledged the occurrence of windstorms when 100 km/h (27.8 m/s) or higher wind speeds were identified through measurement at more than 5% of the entire number of observatories. In the case of Korea, the numbers of weather stations from which the data for the study period were obtained are shown in Table 1. As can be seen in Table 1, 507 points were operated per year on average. Therefore, 10% of all of the observatories was 50.7 points, 5% (as with the previous study) was 25 points, and 2% was 10 points.
Although no criteria for the occurrence of a windstorm is currently available in Korea, criteria for strong winds and wind waves have been prepared so that windstorms may be identified on the basis of strong winds. Strong-wind warnings are issued when 14m/s or higher wind speeds or 20m/s higher instantaneous wind speeds are expected on the land and wind wave warnings are issued when 14m/s or higher wind speeds are maintained for three hours or longer on the sea(KMA, 2014).
When the occurrence of windstorms was defined
as cases where 14m/s or higher winds have blown for
at least two hours, the cases where strong winds
appeared at 5% of all of the observatories occurred
three times during the study period, on August 31,
2002, September 12, 2002, and July 10, 2006, which
are too few for the study. Cases where windstorms
appeared at 10 observatories (which is 2% of all of
the observatories) or more occurred on 97 days,
Year No. of all Station No. of 10% station No. of 5% station No. of 2% station
2001 443 44.3 22.15 8.86
2002 464 46.4 23.2 9.28
2003 496 49.6 24.8 9.92
2004 518 51.8 25.9 10.36
2005 519 51.9 25.95 10.38
2006 523 52.3 26.15 10.46
2007 524 52.4 26.2 10.48
2008 529 52.9 26.45 10.58
2009 529 52.9 26.45 10.58
2010 525 52.5 26.25 10.5
average 507 50.70 25.35 10.14
Table 1. Annual number of weather stations at each case in Korea (2001-2010)
which is a suitable number for the classification of types, and the horizontal scales of these cases satisfied the minimum scale. Currently, AWSs installed in Korea are located at intervals of approximately 13.3km and ASOSs are located at intervals of approximately 36 km (KMA, 2014).
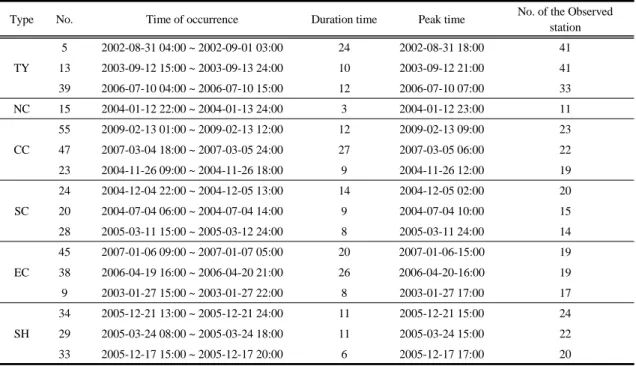
Therefore, in the present study, cases where 14m/s or higher strong winds have blown for two hours or longer at 10 or more points were defined as windstorm occurrence days or windstorm days, and each case where windstorms persisted for 2~3 days was regarded as one occurrence. The results of the examination of windstorm days under the foregoing definition are shown in Table 2. A total of 66 cases were found.
Since damage can be minimized by identifying pressure patterns that cause windstorms in advance and utilizing the results in forecasting, the windstorms that occurred on the Korean Peninsula during the study period were selected as windstorms and the windstorm types were presented based on the regions where the center of the cyclone or anticyclone that caused the strong winds was located, as used by Lamb (1972) (Table 2).
The windstorms were divided into six weather type according to the weather patterns on the
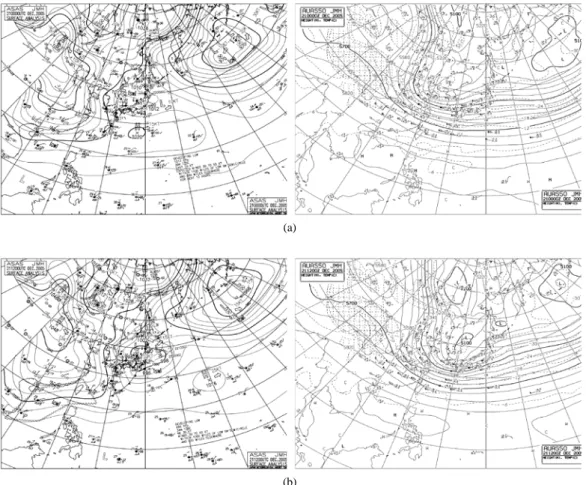
windstorm occurrence days, the locations of the centers of the windstorms, and the moving paths of the windstorms. The criteria for classification were as follows. The first type was cases where Siberian Highs accompanied by strong winds expanded to the Korean Peninsula, and this type was named the Siberian High type (SH). The second type was cases where cyclones centered on China moved to the Korean Peninsula while causing strong winds, and this type was divided into four sub-types according to the locations of the cyclones.
The cases where windstorms occurred while cyclones developed in northern China moved to the Korean Peninsula were named the Northern China Low type (NC), the cases where windstorms occurred while cyclones developed in central China moved to the Korean Peninsula were named the Central China Low type (CC), the cases where windstorms occurred while cyclones located in the southern part of China or southern China moved to the Korean Peninsula were named the Southern China Low type (SC), and the cases where cyclones developed on the East Sea moved to the Korean Peninsula and caused strong winds were named the Eastern Coast Low type (EC).
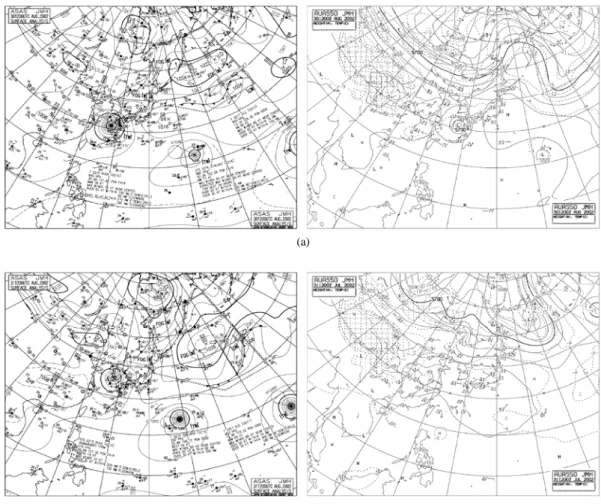
Finally, the cases where strong winds occurred
when a typhoon affected the Korean Peninsula were
No. Time of occurrence Type No. Time of occurrence Type 1 2001-01-07 06:00 ~ 2001-01-07 08:00 SC 35 2006-02-07 09:00 ~ 2006-02-07 18:00 SH 2 2001-03-04 20:00 ~ 2001-03-04 21:00 EC 36 2006-03-12 13:00 ~ 2006-03-12 19:00 SH 3 2002-01-07 13:00 ~ 2002-01-08 02:00 EC 37 2006-03-28 14:00 ~ 2006-03-28 19:00 EC 4 2002-07-05 11:00 ~ 2002-07-05 21:00 TY 38 2006-04-19 16:00 ~ 2006-04-20 21:00 EC 5 2002-08-31 04:00 ~ 2002-09-01 03:00 TY 39 2006-07-10 04:00 ~ 2006-07-10 15:00 TY 6 2002-12-25 09:00 ~ 2002-12-25 12:00 SH 40 2006-09-17 16:00 ~ 2006-09-17 21:00 TY 7 2003-01-03 15:00 ~ 2003-01-03 17:00 SH 41 2006-10-23 09:00 ~ 2006-10-23 15:00 CC 8 2003-01-04 14:00 ~ 2003-01-05 02:00 SH 42 2006-11-06 19:00 ~ 2006-11-07 02:00 EC 9 2003-01-27 15:00 ~ 2003-01-27 22:00 EC 43 2006-12-17 06:00 ~ 2006-12-17 15:00 SH 10 2003-01-28 17:00 2003-01-29 07:00 SH 44 2006-12-28 04:00 ~ 2006-12-28 17:00 SH 11 2003-03-03 08:00 ~ 2003-03-03 17:00 SH 45 2007-01-06 09:00 ~ 2007-01-07 05:00 EC 12 2003-04-01 06:00 ~ 2003-04-01 08:00 SC 46 2007-02-14 09:00 ~ 2007-02-14 17:00 EC 13 2003-09-12 15:00 ~ 2003-09-13 24:00 TY 47 2007-03-04 18:00 ~ 2007-03-05 24:00 CC 14 2003-11-21 13:00 ~ 2003-11-21 14:00 SH 48 2007-09-16 12:00 ~ 2007-09-16 18:00 TY 15 2004-01-12 22:00 ~ 2004-01-13 24:00 NC 49 2007-12-30 13:00 ~ 2007-12-30 19:00 EC 16 2004-02-05 01:00 ~ 2004-02-05 04:00 SH 50 2008-04-09 07:00 2008-04-09 12:00 SC 17 2004-02-22 14:00 ~ 2004-02-23 24:00 EC 51 2008-11-29 11:00 ~ 2008-11-29 16:00 EC 18 2004-04-01 24:00 ~ 2004-04-02 02:00 CC 52 2008-12-05 06:00 ~ 2008-12-05 14:00 SH 19 2004-04-27 05:00 ~ 2004-04-27 13:00 CC 53 2009-01-12 02:00 ~ 2009-01-12 04:00 SH 20 2004-07-04 06:00 ~ 2004-07-04 14:00 SC 54 2009-01-23 11:00 ~ 2009-01-23 13:00 SH 21 2004-08-19 05:00 ~ 2004-08-19 06:00 TY 55 2009-02-13 01:00 ~ 2009-02-13 12:00 CC 22 2004-09-07 05:00 ~ 2004-09-07 09:00 TY 56 2009-03-13 15:00 ~ 2009-03-13 22:00 SC 23 2004-11-26 09:00 ~ 2004-11-26 18:00 CC 57 2009-11-02 10:00 ~ 2009-11-02 11:00 SH 24 2004-12-04 22:00 ~ 2004-12-05 13:00 SC 58 2009-12-05 04:00 ~ 2009-12-05 13:00 EC 25 2005-01-31 20:00 ~ 2005-02-01 19:00 SH 59 2009-12-31 02:00 ~ 2009-12-31 07:00 SH 26 2005-02-15 17:00 ~ 2005-02-15 21:00 SC 60 2010-01-04 16:00 ~ 2010-01-04 17:00 CC 27 2005-02-19 15:00 ~ 2005-02-19 16:00 SH 61 2010-03-09 23:00 ~ 2010-03-10 04:00 SH 28 2005-03-11 15:00 ~ 2005-03-12 24:00 SC 62 2010-03-20 22:00 ~ 2010-03-21 03:00 CC 29 2005-03-24 08:00 ~ 2005-03-24 18:00 SH 63 2010-04-13 15:00 ~ 2010-04-13 18:00 CC 30 2005-09-05 21:00 ~ 2005-09-06 21:00 TY 64 2010-04-28 17:00 ~ 2010-04-28 19:00 CC 31 2005-11-28 18:00 ~ 2005-11-28 22:00 NC 65 2010-09-01 23:00 ~ 2010-09-02 07:00 TY 32 2005-12-04 15:00 ~ 2005-12-04 18:00 EC 66 2010-10-25 16:00 ~ 2010-10-26 10:00 SH 33 2005-12-17 15:00 ~ 2005-12-17 20:00 SH 67 2010-11-08 24:00 ~ 2010-11-09 03:00 EC 34 2005-12-21 13:00 ~ 2005-12-21 24:00 SH 68 2010-12-03 06:00 ~ 2010-12-03 13:00 SH
*time of occurrence by local standard time(LST)
Table 2. List of windstorm days and classification of windstorm type in Korea (2001-2010)
Weather pattern Type Occurrence frequency of storm day
‘01 ‘02 ‘03 ‘04 ‘05 ‘06 ‘07 ‘08 ‘09 ‘10 total %
Siberian High SH 0 1 4 1 5 4 0 1 4 4 24 35.3
Low pressure
NC 0 0 0 1 1 0 0 0 0 0 2 2.9
CC 0 0 0 3 0 1 1 0 1 4 10 14.7
SC 1 0 1 3 2 0 0 0 1 0 8 11.8
EC 1 1 1 1 1 3 3 1 1 1 14 20.6
Typhoon TY 0 2 1 2 1 2 1 0 0 1 10 14.7
Total 2 4 7 11 10 10 5 2 7 10 68 100
Table 3. Occurrence frequency of windstorm days according to weather patterns (2001-2010)
named the Typhoon type (TY). The SH type is similar to the Siberian High type presented by Moon (1982) and Park et al. (1991) in which strong windstorms occurred when cold Siberian Highs expanded from the northwest side of the Korean Peninsula after cyclones passed the Korean Peninsula (Lee, 2011). The NC, CC, and SC types are similar to the Low pressure patterns (III-1, III-b, III-c) presented by Park et al. (1991) respectively and the TY type is similar to the Typhoon type (type VI) presented by Park et al. (1991). However, the EC type in which cyclones develop on the East Sea is presented for the first time.
3. Results and discussion
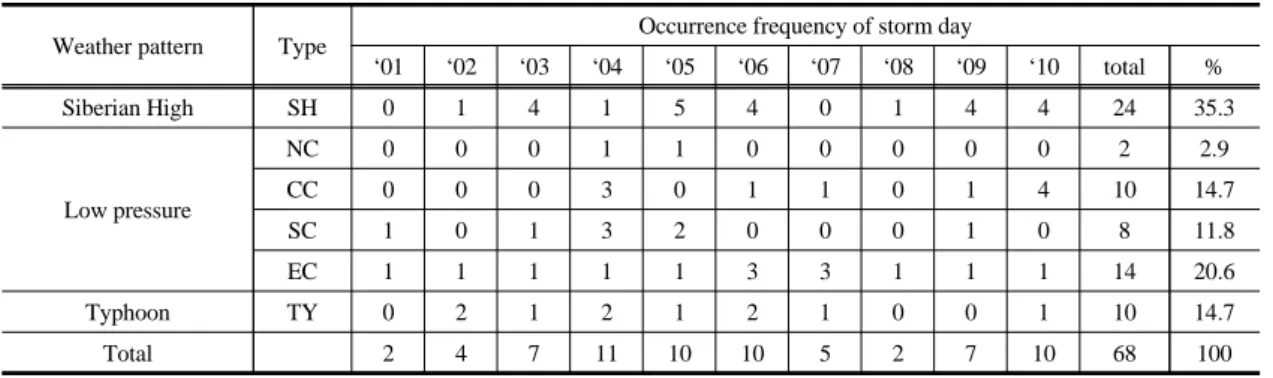
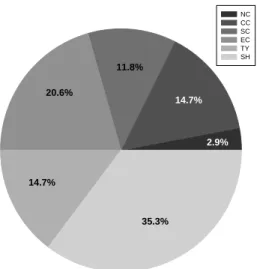
3.1. Yearly windstorm occurrence frequencies Table 3 shows the occurrence frequencies of windstorms occurring on the Korean Peninsula according to weather patterns and years. The weather patterns that showed the highest occurrence frequency was the SH type, which occurred 24 times during the period of the present study, accounting for 35.3% of the entire number of times of occurrence.
The weather patterns that showed the second highest occurrence frequency was the EC type, in which cyclones developed after moving to the East Sea, causing strong winds that occurred 14 times, accounting for 20.6% of the entire number of times
of occurrence. The CC and TY types occurred third most frequently with10 times (14.7%) each and the SC type occurred fourth most frequently with 8 times (11.8%). The weather patterns that showed the lowest frequency was the NC type, which occurred two times (2.9%) during the study period.
Therefore, among the windstorms that occurred on the Korean Peninsula during the study period, the SH type showed the highest frequency followed by the EC type. That is, at least 55.9% of the entire occurrence frequency was attributable to the SH and EC types, indicating that the majority of the windstorms that occurred in Korea was caused by the expansion of Siberian Highs and the development of cyclones in the East Sea(refer to Fig. 1). Although windstorms frequently occurred when typhoons hit the Korean Peninsula, more cases of windstorms occurred due to other weather patterns during the period of the present study. Therefore, countermeasures against storm and flood damage on the Korean Peninsula should include storm and flood damage caused by windstorms in addition to the damage caused by typhoons.
In reviewing the yearly windstorm occurrence
frequencies, 2004 had the highest occurrence frequency
with 11 times, followed by 2005 and 2006 with10 times
each, and 2001 and 2008 had the lowest windstorm
occurrence frequency with two times each. No
particular yearly characteristics could be found.
NC CC SC EC TY SH
2.9%
14.7%
11.8%
20.6%
14.7%
35.3%