Investigation of Soil and Groundwater Contaminated by Gasoline and Lubricants Around a Railroad Station in S City, Korea
Hwan Lee and Yoonjin Lee†
Department of Civil, Urban and Geosystem Engineering, Seoul National University, Gwanak 599, Gwanak-ro, Gwanak-gu, Seoul 151-742, Korea
*Department of General Education, Konyang University, 119, Daehakro, Nonsan 320-711, Korea
ABSTRACT
Objective: This research was performed to evaluate the state of oil pollution in an area surrounding a railway station that has over 100 years of business history as a railway station in S City, Korea. The amount of polluted soil was estimated, and the target area for remediation was assessed in this study to restore the oil-polluted area.
Methods: To accomplish this aim, five observation wells were installed for the sampling of groundwater, and soil was sampled at 33 points. Electric resistance studies and a trench investigation were undertaken to understand the geological conditions of the site, and the groundwater movement in this area was simulated by MODFLOW.
Physiochemical analyses were conducted to determine the quality of the groundwater and the current state of oil pollution influenced by that of the soil.
Results: The mean level of total petroleum hydrocarbons (TPHs) in this area was 1,059 mg/kg, and the area for remediation was determined to be 7,610 mg/kg. Levels of benzene, toluene, ethylbenzene, and xylene (BTEX) were determined to be under the legal standard.
Conclusion: In terms of depth, the biggest area polluted by TPH found was between 0 and 1 m from ground level, and the affected area was 5,900 m
3. TPHs were not detected in groundwater. Diesel and lubricating oil were the main causes of TPH pollution at this railway station.
Key words: TPH, BTEX, oil leak, soil, groundwater, remediation, railway station
I. Introduction
Soil is a basic part of the environment, along with water and air, and is related to other components in the ecosystem. It also has an important role in the cycling of material. Once soil is polluted, it is difficult to remediate compared to water and air;
moreover, it is difficult to determine the degree of contamination and perform monitoring because the transfer route is both complicated and invisible.
Furthermore, pollutants can travel from the soil to groundwater, thereby increasing the scope for pollution and affecting the quality of drinking water.1) Thus, in the case of soil pollution, it is important to block the source of pollution, delay the
transfer velocity, or cut off the pollution route. The first step in accomplishing this is to investigate the pollution correlation with the factors affected.2)
In Korea, the first legal management of the soil environment began with the enactment of the Soil Environment Conservation Law in 1996. Furthermore, a management system for soil pollutant measurement and monitoring has been in place at the national scale since 1987, and data from the system’s database can be used in remediation and purification studies of polluted soil. The number of sample points measured continues to expand; these are currently managed by local governments and regional offices of the Ministry of the Environment.3) Domestic remediation in Korea began with the case
†
Corresponding author: Department of General Education, Konyang University, 119, Daehakro, Nonsan 320-711, Korea, Tel: +82-41-730-5747, Fax: +82-41-730-5747, E-mail: [email protected]
Received: 8 October 2012, Revised: 19 November 2012, Accepted: 3 December 2012
of Munhyun-dong, Busan, which applied technologies, ex situ land farming, and thermal desorption in 2002. In addition, the problem of soil pollution was exposed and became a matter of soicial concernwhen U.S. Army bases were returned through the land partnership plan; it is estimated that a huge cost will be incurred in terms of the remediation of soil and groundwater on the polluted U.S. bases.4)
Petroleum is an important resource in industry and homes. As a result, many petroleum products and crude oil are discharged into the environment, bringing about huge losses in the ecological system due to both accidental and intentional leaks during the processes of production, transportation, and storage.5-7) A suitable remediation process needs to be applied to oil-polluted soil because storage fuel is mainly composed of hazardous substances.8) The remediation of soil can proceed by one of two methods: ex situ technology, which is a remediation method involving excavation, and in situ technology, which is a method involving treatment inside the target area. Both methods can be further subdivided into physiochemical, biological, and thermal approaches. Oil-separation methods that generally perform fairly well in volatile conditions are soil vapor extraction, air sparging, and bio-venting.9) Technologies for the oil separation of nonvolatile and semivolatile substances are soil washing, microbial degradation, and pyrolysis.
Pollution in railway stations is generally due to total petroleum hydrocarbons (TPHs) and heavy metals.10) TPH pollution mostly occurs as a result of the use of diesel and lubricants. Oil pollution can be linked to diesel used as a fuel in trains or to diesel leaks during the process of storage and transportation and lubricants used in the turnout system and engine.11-13) Jung et al. (2003) stated that the main sources for oil-contaminated soil on railroads are as follows: drops of fuel oil falling into the soil during refueling of the train, oil pollution in the vicinity of the railway when the train is stationary on a long-term basis, lubricant usage for the easy operation of railway turnouts, leaks from pipes in the fueling facilities, and the generation of heavy metal particles due to friction on the rails and wheels.11) Burkhardt et al. (2008) reported that railway companies cannot calculate the environmental fate of emissions exactly and have difficulty
predicting whether the concentration of emissions from railway operations will meet regulated quality standards.8) Oil pollution induced by lubricants should be classified as TPH pollution. Individual technology for the remediation of lubricants should be developed because these pollutants behave differently in soil than in other materials. General methods for the remediation of TPHs are soil flushing and chemical oxidation.14,15)
The aim of this research was to investigate a railway area of 27,500 m2 in South Korea. Samples for assessment of the target area for remediation were taken from 33 soil sample points and five groundwater observation wells. In the survey of electric resistivity, trench research was undertaken to understand the characteristics of the site, and groundwater modeling was performed based on the experimental results.
II. Materials and Methods
1. Target area investigated
The target area was a 27,500 m2 railway site that is close to a residential area on both sides and geologically in close proximity to B mountain.
Granite from the Jurassic period is distributed broadly, and the fourth period of basalt and sedimentary rock from the Cretaceous period is present on a small scale. A map showing the
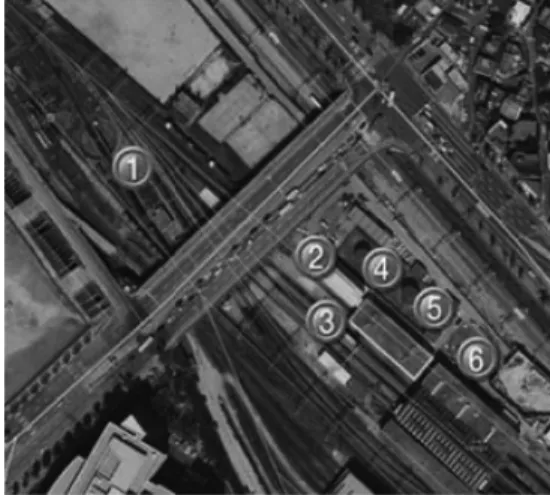
Fig. 1. Condition of the facilities around the target area.
① ground storage closed, ②electronic train tract,
③ refueling track, ④ train washing track, ⑤ oil
storage tank above the ground, ⑥ underground
diesel oil storage tank.
facilities in the target area that have a probability of oil pollution is shown in Fig. 1. These include closed ground storage (the transportation line and oil storage–related facilities are still present), the train washing track, the refueling track, above-ground oil storage tanks (storage capacity: 470,000 L, 2 units;
475,000 L, 1 unit; 3,000 L, 1 unit), an underground diesel oil storage tank (storage capacity: 920,000 L),
and an electric train track, etc. Currently, all the diesel oil storage tanks are set up above ground and the high-pressure oil transportation line to the fueling track, which is installed under the ground, is protected with grating at the side gutter. The electric train track was previously used as a facility for the inspection track.
2. Survey of site characteristics
Trench research was performed at the five sites to determine the border area of the pollution: an excavator was used to dig a 1 m wide × 3 m long
× 3 m deep trench. The coordinates in this research were measured with a precise global positioning system (GPS) (Timble ProXRS, TX, USA). Previously created drawings were revised during this work because different points were discovered with a current topographical map.
Electric resistivity was measured to evaluate the potential association between the structure of the stratum and the pollutionof the soil and groundwater.
The measurement was conducted with an AGI Sting R1 earth resistivity meter (TX, USA) with a dipole array; the dipole interval was 3 m, and the n value was 6. The side track for the investigation was installed in four places (Fig. 2).
3. Sampling methods
Information about all the conditions of the samples, such as preparation, correction, transportation, and management, were recorded on a logging sheet and appropriately managed by examining them on a daily basis. The extent of smell of soil was categorized and recorded using an organic function test in the field.
The soil was sampled with a Geoprobe 6610DT (KS, USA). Soil sampling was also sporadically performed in parts of the site that the equipment could not access. The locations of the sampling sites were marked on the map, and these were revised following consultation with an engineer regarding the location of obstacles. Some sites were covered with a concrete or a gravel layer.
Those had to be eliminated in order to carry out the sampling. Thirty-three points were selected on the map of the sampling location (Fig. 2). The soil taken was analyzed for petroleum substances such as TPHs and BTEX and for physiochemical properties such as pH, nitrate, ammonia nitrogen, oil decomposition bacteria, organic content, and
Fig. 2. Map of facilities installed for this investigation.
available phosphate, as well as heavy metals such as lead, zinc, and nickel.
Five wells were installed to collect samples to analyze the quality of the groundwater and observe the water level and hydrological characteristics of the groundwater (Fig. 2). The casing material was polyethylene. Gravel was used as filling and grouted with bentonite to protect it from pollutants. During the sampling of the five wells, the pumping rate was 0.3 L/sec; the samples were moved to the laboratory and preserved at a constant temperature of 4oC until the analysis. All the items were analyzed following the standard methods for Korean drinking water.3)
4. Analytical method
The pH was measured immediately using an electronic pH meter (Omega PHH-103). Levels of iron, lead, zinc, and nickel were measured after preprocessing with an atomic absorption spectrometer (Varian SpectrAA 800, CA, USA) according to Korean soil pollution analysis methods (Ministry of Environment in Republic of Korea).
The TPH level was analyzed using the standard Korean method for soil (Ministry of Environment in Republic of Korea). Soil (10 g) was mixed with 30 g of anhydrous sodium sulfate in a bottle, and then dichloromethane was added. Contaminants were separated by ultrasonic extraction, and the extraction filtrate was percolated through a 4 µm Adventec 5B membrane; this was measured using a gas chromatograph (HP 6890) with a flame ionization detector (FID).
Five to ten grams of soil were preserved for the analysis of BTEX using 10 mL of methanol in 30 mL glass bottles; the samples were transferred to the laboratory at a temperature between 0oC and 4oC The same amount of anhydrous sodium sulfate was included after adding 150µg of internal standard material in the bottles; the substance was mixed with shaking for 2 min and left to settle. The upper 2 mL layer was removed after centrifugation for 3 min with a relative centrifugal force of over 150;
the sample was analyzed with gas chromatography (GC)-FID using the purge and trap method.
III. Results
1. Soil character evaluation
The evaluation of electric resistivity was performed
to estimate the depth of the geological weak zone and base rock and to obtain preliminary data to assess the possibility of diffusion of pollutants in this area. A cross-sectional interpretation diagram of the electric exploration is presented in Fig. 3. Base rock was found at depth ranging from 6 to 9 m from the surface, and it was confirmed that a partly weak zone was distributed through this. In the case of line one, a zone of low resistivity was observed at a depth between 3 and 15 m in survey vertical line no.
8-9 and no. 11-16. A zone of low resistivity was present at the section between 3 m and 6 m of the substructure of survey vertical line no. 5-7 and no.
11-13. A zone of low resistivity was also found at a depth of between 6 m and 15 m in survey line no.
15-20 and in survey line no. 24 and 30 for line two.
These findings might be related with the underground facilities in line two. Low resistivity was found between 3 m and 15 m in the no. 9-13 survey vertical line, between the earth’s surface and
Fig. 3. Cross-sectional diagrams of the interpretation of
electric resistivity.
6 m in no. 15-18, between 3 m and 15 m in survery vertical line no. 22-27, and between 1 m and 15 m of survey vertical line no. 29-38 for line three. The movement or concentration of groundwater through the weak zone (green color zone) may explain the low resistivity because underground facilities were not found in the field. The geological weak zone was distributed at a depth of between 0 m and 3 m based on the resistivity tests, although there was little difference in the zone. A geological weak zone can provide a conduit for the movement of pollutants through the movement of groundwater.
The soil at this site was mostly composed of a landfill layer, which the trench investigation showed was made up of gravel, sand, and silt. A black- colored sand layer 40 cm thick was present in the subsurface between around 0 m and 2 m. However, this type of layer was not present in the soil around the oil tank. In addition, no landfill waste was found
in any part of the sampling site. The landfill layer in this site was thought to initially have been created through soil landfilling to prepare the site for the railway station. The depth of landfill and the degree of weathering were almost evenly distributed.
Blackish-brown-colored soil (Fig. 4) or gravel- mixed, sand-textured soil was prevalent in the substructure for 2 m, and silt-textured brown soil was visible under the layer. The routes for the movement of oil substances can be predicted by evaluating hydro-geological conditions in the field such as groundwater flow and the distribution of the oil substances in the stratum. While the movement of pollutants was affected by the flow of the groundwater, free phase of oil pollutants was affected by the character of the stratum under the pavement such as water distribution pipes, electric facilities, and landfill soil.15)
2. Analysis of the physiochemical character- istics of the soil and the groundwater
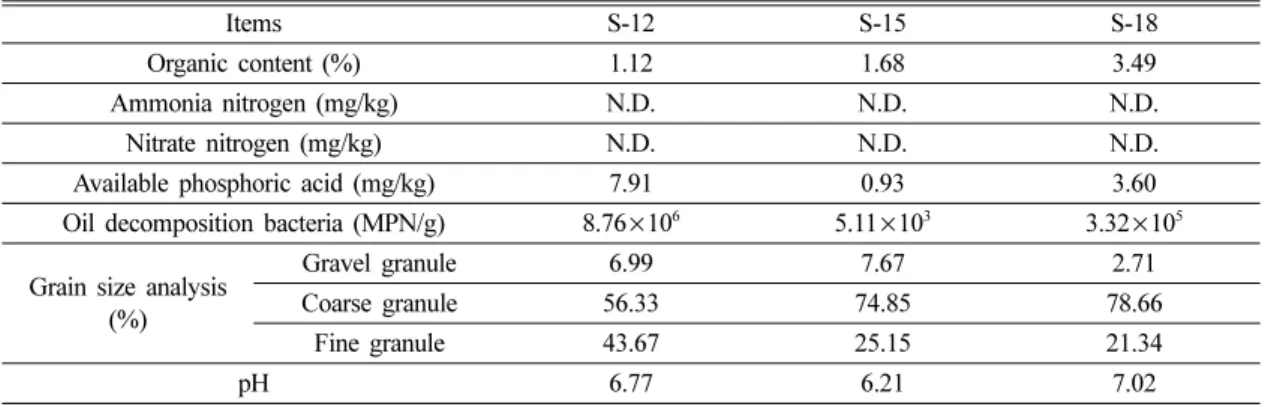
The physiochemical characteristics of the soil in this area are presented in Table 1. The organic content was 2.1%, which is similar to the mean value for soil in domestic rice paddies. There was no nigrogen present in the soil, while the available phosphoric acid was 4.45 mg/kg. Ammonia nitrogen and nitrate nitrogen were also not detected. This indicates that nitrogen and phosphorous need to be added during the operation of biological remediation process. In this case, 398.6 mg/L of nitrogen per 1 kg of soil would need to be added to generate the appropriate ratio (100:10:1) of C:N:P in this area. In addition, the TPH concentration is 6,043 mg/kg in this area; this needs to be reduced to 2,000 mg/kg.
Fig. 4. Black-colored sand layer with petroleum smell found during the trench survey.
Table 1. Physicochemical analysis results
Items S-12 S-15 S-18
Organic content (%) 1.12 1.68 3.49
Ammonia nitrogen (mg/kg) N.D. N.D. N.D.
Nitrate nitrogen (mg/kg) N.D. N.D. N.D.
Available phosphoric acid (mg/kg) 7.91 0.93 3.60
Oil decomposition bacteria (MPN/g) 8.76 ×10
65.11 ×10
33.32 ×10
5Grain size analysis
(%)
Gravel granule 6.99 7.67 2.71
Coarse granule 56.33 74.85 78.66
Fine granule 43.67 25.15 21.34
pH 6.77 6.21 7.02
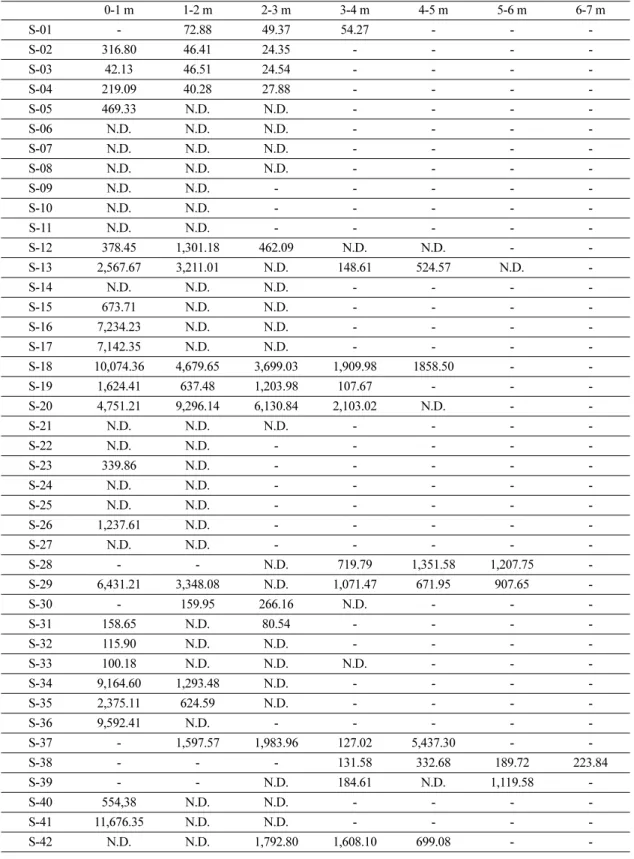
Table 2. Concentration of TPH detected at different depths in the soil (unit: mg/kg)
0-1 m 1-2 m 2-3 m 3-4 m 4-5 m 5-6 m 6-7 m
S-01 - 72.88 49.37 54.27 - - -
S-02 316.80 46.41 24.35 - - - -
S-03 42.13 46.51 24.54 - - - -
S-04 219.09 40.28 27.88 - - - -
S-05 469.33 N.D. N.D. - - - -
S-06 N.D. N.D. N.D. - - - -
S-07 N.D. N.D. N.D. - - - -
S-08 N.D. N.D. N.D. - - - -
S-09 N.D. N.D. - - - - -
S-10 N.D. N.D. - - - - -
S-11 N.D. N.D. - - - - -
S-12 378.45 1,301.18 462.09 N.D. N.D. - -
S-13 2,567.67 3,211.01 N.D. 148.61 524.57 N.D. -
S-14 N.D. N.D. N.D. - - - -
S-15 673.71 N.D. N.D. - - - -
S-16 7,234.23 N.D. N.D. - - - -
S-17 7,142.35 N.D. N.D. - - - -
S-18 10,074.36 4,679.65 3,699.03 1,909.98 1858.50 - -
S-19 1,624.41 637.48 1,203.98 107.67 - - -
S-20 4,751.21 9,296.14 6,130.84 2,103.02 N.D. - -
S-21 N.D. N.D. N.D. - - - -
S-22 N.D. N.D. - - - - -
S-23 339.86 N.D. - - - - -
S-24 N.D. N.D. - - - - -
S-25 N.D. N.D. - - - - -
S-26 1,237.61 N.D. - - - - -
S-27 N.D. N.D. - - - - -
S-28 - - N.D. 719.79 1,351.58 1,207.75 -
S-29 6,431.21 3,348.08 N.D. 1,071.47 671.95 907.65 -
S-30 - 159.95 266.16 N.D. - - -
S-31 158.65 N.D. 80.54 - - - -
S-32 115.90 N.D. N.D. - - - -
S-33 100.18 N.D. N.D. N.D. - - -
S-34 9,164.60 1,293.48 N.D. - - - -
S-35 2,375.11 624.59 N.D. - - - -
S-36 9,592.41 N.D. - - - - -
S-37 - 1,597.57 1,983.96 127.02 5,437.30 - -
S-38 - - - 131.58 332.68 189.72 223.84
S-39 - - N.D. 184.61 N.D. 1,119.58 -
S-40 554,38 N.D. N.D. - - - -
S-41 11,676.35 N.D. N.D. - - - -
S-42 N.D. N.D. 1,792.80 1,608.10 699.08 - -
The mean value of oil degradation microorganisms in this site was 3.03×10⁶MPN/g. The highest and lowest values were 8.76×10⁶ and 5.11×10³MPN/g at S-12 and S-15, respectively.
The mean value of TPHs for the 168 samples from the field was 1,059 mg/kg, and the highest value was 18,590 mg/kg, which is nine times higher than the soil pollution standard in Korea (Table 2). TPH pollution was present to a depth of 4 m in the study area TPHs were not detected between 0 and 2 m at S-42. However, levels of TPHs detected between 2–
3 m and 3–4 m were 3,073 and 18,590 mg/kg, respectively. TPHs were even detected between 6 and 7 m at S-38. At S-37, levels of TPHs of 5,434 mg/
kg were detected between 4 and 5 m. The analysis of this site confirmed that oil pollution was mostly caused by the facilities around the oil tanks, cleaning track, refueling track, entrance to the inspection track, and around the trains. The highest TPH value (18,590 mg/kg) was found at a depth between 3 and 4 m, and the lowest value (223.8 mg/kg) was detected between 6 and 7 m. The mean TPH value was shown to be highest between 0 m and 1 m.
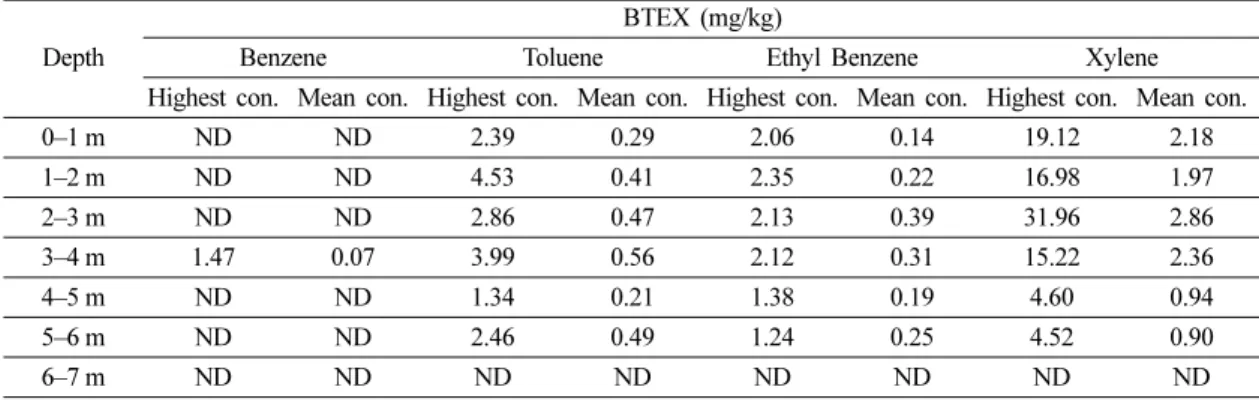
The mean value of the BTEX level did not exceed the standard (Table 3). The highest value of BTEX was 36.95 mg/kg at the section between 2 m and 3 m. At this depth, the level of xylene was highest and benzene was lowest; benzene was not detected throughout most of the site.
Fig. 5 shows the main types of petroleum detected in the polluted site at S18, S20, S34, S35, S36, and S43, which were the sites where levels of TPHs over the standard level were detected. The types of oil in this area were found to be diesel and lubricating oil.
The distributions of the various types of petroleum differed on this site. The section around the railway was mostly polluted by lubricants. And the turntable section was entirely polluted by lubrication oil.
Several places, such as the high-pressure refueling track, were polluted with fresh or weathered diesel and lubricating oil. There have been few reports of remediation of sites polluted by lubricants compared with remediation of sites polluted by diesel.16) Fresh oil substances were detected around the facilities including the high-pressure refueling spot. This means the removal character of various targets such
Table 2. Concentration of TPH detected at different depths in the soil (unit: mg/kg)
0-1 m 1-2 m 2-3 m 3-4 m 4-5 m 5-6 m 6-7 m
S-43 2,202.66 1,921.41 3,072.73 18,590.22 N.D. - -
S-44 3,986.20 N.D. N.D. - - - -
S-45 N.D. N.D. N.D. N.D. - - -
S-46 1,173.16 N.D. N.D. N.D. - - -
S-47 2,176.37 1,453.06 643.39 N.D. - - -
S-48 N.D. 411.77 N.D. N.D. - - -
S-49 N.D. 230.53 N.D. N.D. - - -
S-50 N.D. N.D. N.D. N.D. - - -
Table 3. Concentration of BTEX detected at different depth in the soil
Depth
BTEX (mg/kg)
Benzene Toluene Ethyl Benzene Xylene
Highest con. Mean con. Highest con. Mean con. Highest con. Mean con. Highest con. Mean con.
0–1 m ND ND 2.39 0.29 2.06 0.14 19.12 2.18
1–2 m ND ND 4.53 0.41 2.35 0.22 16.98 1.97
2–3 m ND ND 2.86 0.47 2.13 0.39 31.96 2.86
3–4 m 1.47 0.07 3.99 0.56 2.12 0.31 15.22 2.36
4–5 m ND ND 1.34 0.21 1.38 0.19 4.60 0.94
5–6 m ND ND 2.46 0.49 1.24 0.25 4.52 0.90
6–7 m ND ND ND ND ND ND ND ND
as diesel and lubricating oil for the treatment in this area should be comprehensively considered for the selection of remediation process in this area.
The level of groundwater was measured in the subsurface between 4.1 m and 4.5 m. The water level in these wells was relatively high. The measurement was performed during the dry season.
Groundwater is expected to flow from the northeast to the southwest. In this site, an unconfined aquifer exists because a confining bed was not found and the soil was found to be silt-sand. The values for the hydraulic conductivity of the observation wells GW-01, GW-02, GW-03, GW-04, and GW-05 were 6.02×10⁻⁶, 5.83× 10⁻⁵, 1.31×10⁻⁵, 4.19×10⁻⁵, and 1.33×10⁻⁴cm/sec, respectively. The mean value was
relatively low, 5.05×10⁻⁵cm/sec, because the soil was mostly composed of silty-sand. However, except for GW-01, the values were over 1×10⁻⁵cm/
sec, indicating that the ability of flushing fluids to apply soil flushing is not limited, as reported by Freeman and Harris (1995).17)
The flow of groundwater was simulated, as shown in Fig. 6. Groundwater travels from the northeast to the southwest side in this area. Groundwater at the southwest part of the site is influenced by the rivers located on the east side; the groundwater flow around the train station is greater in the southwest due to the influence of a small river, and flows to the east prevail at the eastern part of the station. This ground flow is related to the movement of pollutants in this area. The results are consistent with those of previous research.14) A high concentration of TPHs was associated with the flow of the groundwater in the study area.
Levels of the main heavy metals detected—zinc, nickel, cadmium, and lead—are presented in Table 4.
Detection of significant levels of heavy metals was anticipated due to the long operational history of the railway station. Heavy metals were detected over a depth of 1 m. The mean levels of zinc, nickel, cadmium, and lead were 240.38, 27.08, 2.59, and 298.78 mg/kg, respectively, at a depth between 0 and 1 m. The mean levels of zinc, nickel, cadmium, and lead were 213.88, 46.63, 2.22, and 149.44 mg/kg,
Fig. 5. Chromatogram of TPH from six spots.
Fig. 6. Prediction of groundwater flow with the simulation
of groundwater fluctuation.
respectively, at a depth between 1 and 2 m. The difference in the level of these metals in the study area did not differ greatly with depth. The concentration of metals at S-29 around the oil reservation tanks was high: 590.53, 42.10, 4.47, and 503.40 mg/kg for zinc, nickel, cadmium, and lead, respectively, between 1 and 2 m.
The metal pollution was intensively distributed in the surface area of the soil between 0 and 1 m. The highest levels of zinc were 654.20, 46.63 mg/kg between 1 and 2 m at S-24. A concentration of 830.53 mg/kg of lead, which is above the level of the standard, was detected at S-42. A high level of lead, over 400 mg/L, was detected at six points in this site. Park et al. (2011) reported that soil that is
polluted with metals and lubricants is not easy to remediate with only one process.16) They concluded that the treatment of both zinc and lubricants in soil was possible with hydrogen chloride and soil flushing with a nonionic surfactant. This indicates that a combination of remediation processes should be considered at the study site due to the presence of multiple sources of pollution, which include metals, diesel, and lubricants. The existence of heavy metals was not always consistent with the detection of TPHs.
The water quality of the groundwater was evaluated for the five wells, and the results are shown in Table 5.
The groundwater is not used for drinking purposes at this site. TPHs and BTEX were not detected in
Table 4. Analysis results of heavy metal in the study area (unit: mg/kg)
Site Zn Ni Cd Pb
0-1 m 1-2 m 0-1 m 1-2 m 0-1 m 1-2 m 0-1 m 1-2 m
S-03 209.67 340.53 18.33 17.13 1.83 2.93 685.53 270.63
S-04 228.90 137.33 28.73 20.77 2.30 1.70 696.07 88.87
S-07 153.17 127.00 19.47 16.10 2.00 1.70 83.33 51.73
S-10 265.20 - 26.77 - 2.77 - 119.83 -
S-12 214.07 154.63 35.73 21.53 4.03 2.03 86.57 127.27
S-14 310.30 164.07 25.40 12.13 2.37 1.70 290.27 86.40
S-17 152.30 96.00 32.07 17.87 1.63 1.37 404.07 66.93
S-20 273.20 213.67 27.13 25.80 2.77 2.40 188.20 162.11
S-24 132.30 654.20 27.63 46.63 1.77 2.27 73.37 23.93
S-29 590.53 212.57 42.10 26.13 4.47 3.33 503.40 55.77
S-36 138.00 132.00 21.47 14.10 1.73 1.13 121.07 60.03
S-37 - 215.03 - 13.63 - 2.13 - 121.47
S-40 278.90 106.77 23.20 19.13 2.23 1.43 425.40 44.20
S-42 143.47 188.10 23.53 21.40 3.43 2.27 502.73 830.53
S-46 208.97 175.27 19.97 16.60 1.97 1.90 124.57 113.60
S-48 306.67 291.07 34.73 26.97 3.50 4.50 117.23 138.17
Table 5. Analysis results of ground water
Well No. Nitrate
Nitrogen (mg/L)
Chloride
(mg/L) Water Level (m) Hydraulic Conductivity
(cm/sec) pH
GW-01 N.D. 8.16 4.41 6.02×10
-66.57
GW-02 1.68 8.50 6.16 5.83×10
-56.62
GW-03 1.38 41.25 3.63 1.31×10
-56.86
GW-04 0.57 3.45 4.50 4.19×10
-57.06
GW-05 6.98 28.08 2.93 1.33×10
-46.92
*Cd, As, Hg, Phenol, Pb, Cr
6+, TCE, PCE, and BTEX were not detected in this experiment
any of the samples. Levels of nitrate and chloride were 6.98 mg/L and 28.08 mg/L, respectively, which is less than the standard for domestic water.
Therefore, it can be concluded that the petroleum- polluted soil has not led to pollution of the groundwater in this area.
Oil pollution can be caused by the following processes: oil waste burial, the release of oil through leaks, refueling, cleaning, or inspection. An oil band apparently created by dropping oil was observed around the high-pressure refueling track. In this area, the possible causes of pollution are expected leaks and the dropping of oil. Leaks from underground oil
storage tanks and the oil transportation line could be a main source of the oil pollution. Previous accidental leaks were investigated in with field- cleaning tracks have been investigated, as well as leaks associated with oil transportation pipes for high-pressure oil refilling tracks. Oil tanks were reinstalled on the ground after these leaks incident, so this history was not easily allowed the detection of pollution at the site to be recognized. In addition, pollution at the high depth of stratum might be caused by the cleaning and the oil refilling tracks.
Dropping oil during the process of cleaning and inspection is another possible cause of the oil
Fig. 7. Assessment of the TPH-polluted area.
pollution. Currently, this area is almost entirely paved with concrete. However, previously, when the area was unpaved, pollution of the soil might have been accelerated by dropping oil. Pollution at the entrance to the electric train track can be explained by this area being used as an inspection garage until 2008; TPHs were observed to a depth of 3 m.
The vertical projection distribution of the TPHs in terms of depth at intervals of 1 m in this area is illustrated in Fig. 7. The total polluted area was 7,610 m2. Most of the pollution occurred at a depth of between 0 m and 1 m, and the area polluted was 5,900 m2,representing 50% of the total polluted area.Oil pollution reached a depth of 5 m from the ground level. These data indicate that the polluted area should be remediated with a specific process, which can target applied points near the surface of the ground.
In this site, on-site treatment should be considered because refueling and inspection are consistently performed in this area, and it would be difficult to demolish ground facilities such as oil storage tanks, cleaning tracks, and refueling tracks at this location.
Monitoring is needed on a routine basis to prevent the spread of the oil pollution, as well as a suitable environmental management process, although worrying levels of pollutants were not detected in the groundwater. The process of soil flushing is recommended as a remediation process for this site because the remediation of soil and groundwater and the treatment of various pollutants such as heavy metals and TPHs could be eliminated effectively at the same time. This approach could be simultaneously combined with chemical oxidation for highly polluted locations. In addition, the pollution was present below a depth of 4 m at this site. Air sparging could also be applied at this site to improve the removal efficiency.14) Kim et al. (2006) reported an effective case of chemical oxidation with hydrogen peroxide and air sparging to remediate diesel-polluted groundwater and soil.18) There is an area highly polluted by lead (830.53 mg/L), representing 4.7 m3, which is too narrow to practically apply soil flushing. Thus, off-site treatment should be conducted by carrying out of this soil after digging.
IV. Conclusion
This research was performed to investigate the soil
and groundwater of the area surrounding S railway station, which has a 100-year operational history and uncover the basic data required to generate a strategy to remediate the area polluted by diesel and lubricants. Our conclusions are as follows:
The main causes of oil pollution are presumed to be leaks in oil storage tanks and oil transportation pipes dropping oil during the cleaning/refueling/
inspection processes. Diesel and lubricants were detected around the cleaning track and high-pressure refueling track, and lubricant oil was mostly detected around the railway turntable. Pollution of heavy metals was not consistently detected with the petroleum pollution measured by levels of TPHs and BTEX. TPHs were detected below a depth of 4 m.
Consistent monitoring of levels of heavy metals is required in this area, despite the levels detected being below that of the soil standard in Korea.
The polluted area assessed for TPHs was 7,610 m2, and the greatest amount of polluted soil was found between 0 m and 1 m in an area of 5,900 m2. On- site treatment was evaluated in advance because excavation is practically difficult due to the special conditions of railway stations. Chemical oxidation and soil flushing are recommended for remediation of this area. However, in a small area, under 5 m3, a high amount of lead was detected; it would be possible to remove this from the site.
The groundwater flows from the northeast to the southwest. The geological weak zone, which is distributed between 0 m and 3 m, is considered to be a conduit for the movement of the pollutants.
Periodical monitoring of the groundwater is needed because oil-polluted soil can cause pollution of groundwater, and this spread should be prevented.