대학교 행정실 실내 외 공기 중 나노입자와 중금속 농도에 관한 연구
최수현·임지영·박희진·정은경**·김종오*·손부순†
순천향대학교 환경보건학과, *동남보건대학 환경보건과, **숙명여자대학교 생명과학과
A Study on the Concentration of Nanoparticles and Heavy Metals in Indoor/Outdoor Air in a University Administrative Public Office
Su-Hyeon Choi, Ji-Young Im, Hee-Jin Park, Eun-Kyung Chung**, Jong-oh Kim*, and Bu-Soon Son† Department of Environmental Health Science, Soonchunhyang University, Chungnam, Korea
*Department of Environmental Health Science, Dongnam Health College
**Department of Biological Science, Sookmyung University, Seoul, Korea
ABSTRACT
Objectives: The purpose of this study is to investigate the mass concentration of nanoparticles and understand the characteristics of elements of heavy metal concentrations within nanoparticles in the air using Micro-Orifice Uniform Deposit Impactor Model-110 (MOUDI-110), based on indoor and outdoor air.
Methods: This Study sampled nanoparticlesusing MOUDI-110 indoors (office) and outdoors at S University in Asan, Korea in order to reveal the concentration of nanoparticles in the air. Sampling continued for nine months (10 times indoors and 14 times outdoors) from March to November 2010. Mass concentrations of nanoparticle and concentrations of heavy metals (Al, Mn, Zn, Ni, Cu, Cr, Pb) were analyzed.
Results: Indoors, geometric mean concentration of nanoparticles ranged in size from 0.056µm to 0.10 µm and those of 0.056µm or less recorded 0.929 µg/m3 and 1.002µg/m3, respectively. On the other hand, the levels were lower outdoors with 0.819µg/m3 and 0.597µg/m3. Mann-Whitney U tests showed that the difference between the indoors and the outdoors was statistically meaningful in terms of particles of 0.056µm or less (p<0.05) in size. These results are possibly influenced by the use of printers and duplicators as the factor that increased the concentration of nanoparticles. In seasonal concentration distribution, the level was higher during the summer compared to in the autumn. Those of 0.056µm or less in size presented a statistically meaningful difference during the summer (p<0.05). These results may be influenced by photochemical event as the factor that makes the levels high. Regarding zinc, among the other heavy metals, the fine particles ranged in size from 0.056µm to 0.10µm and those of 0.056 µm or less recorded 1.699 ng/m3 and 1.189 ng/m3 in the outdoors. In the indoors, the levels were lower, with 0.745 ng/m3 and 0.617 ng/m3. Cr and Ni at the size of 0.056µm or less, both of which have been known to pose severe health effects, recorded higher concentrations indoors with 0.736 ng/m3 and 0.177 ng/m3, compared to 0.444 ng/m3 and 0.091 ng/m3 outdoors. By season, Zn, Ni, Cu and Pb posted a high level of indoor concentration during the fall. As for Cr, the level of concentration indoors was higher than outdoors both during the summer and the autumn.
Conclusion: This study indicates the result of an examination of nano-sized particles and heavy metal concentrations. It will provide useful data for the determination of basic nanoparticle standards in the future.
†Corresponding author: Department of Environmental Health Science, Soonchunhyang University, Chungnam 336-745, Korea, Tel: +82-41-530-1270, Fax: 82-41-530-1272, E-mail : [email protected]
Received: 22 August 2012, Revised: 09 October 2012, Accepted: 20 December 2012
Keywords: nanoparticles, heavy metals, indoor
I. 서 론
대기오염은 바람 등에 의한 자연적인 희석률이 크 고 사회적 인식 확대 및 각종 환경규제 등으로 억 제되고 있으나, 실내공기는 한정된 공간에서 오염된 공기가 계속적으로 순환되면서 오염농도가 인체에 유해한 영향을 미칠 수 있을 정도로 증가될 수 있 기 때문에 실내환경에 대한 인식이 새롭게 부각되기 에 이르렀다.1)
인간은 하루 24시간 중 90% 이상을 실내(주택, 일 반사무실, 공공건물, 자동차, 지하철 등)에서 생활하 는 것으로 조사보고 되고 있다.2)또한 최근 실내에 서도 여러 종류의 오염물질이 발생되고 있으나 에너 지 절약 등을 위하여 주택이나 건물에서는 환기량을 최대한 줄이려는 노력이 보편화됨에 따라 다양한 오 염물질에 노출될 가능성은 더욱 높아졌다. 이러한 이 유로 인하여 일상생활에서의 실내공기오염은 보건학 적으로 중요한 관심사가 되고 있다.3)
입자상 오염물질의 경우 주로 PM10과 PM2.5 측정 자료를 기반으로 하는 연구가 수행되어 왔으나,4,5) 최근 독성학적인 조사, 연구에 의하면 100 nm (0.1 µm) 이하의 나노 입자가 큰 입자(Coarse Range)에 비해 질량 당 건강 위해도가 높다는 것이 밝혀지면서 나 노입자에 대한 관심이 고조되고 있다.6,7)
나노입자(nano-sized particle, 이하 NSP)는 학자들 에 따라 다양하게 불리고 있는데 독성학자들은 극미 세입자(ultrafine particles, 이하 UFPs)로 부르고 있 고, 기상학자들은 Aitken mode particle과 nucleation mode particle이라 하며, 재료과학자들은 가공의 나 노구조물질(engineered nanostructured materials)로 명명하고 있으나,8-10) 일반적으로 나노입자는 입경 100 nm 이하의 초미세입자를 일컫는다.11)
나노입자는 산림화재나 화산폭발과 같은 연소과정 에서 자연적으로 배출되며, 화장품, 섬유, 금속, 반 도체 등과 같은 의도적 요인에 의해 발생되기도 한 다. 또한 용접, 제련과 같은 열처리 과정, 디젤·가 솔린·가스의 연소과정, 고속연삭이나 드릴과 같은 기계적 공정 등 비의도적인 작업공정에서 발생 하는 것으로 알려져 있다.12,13)
또한 나노입자는 입자의 질량(mass), 수농도(number concentration), 크기(size), 형상(shape), 응집상태 (agglomeration state), 표면적(surface area), 표면화 학특성(surface chemistry), 용해도(solubility) 및 나 노결정구조(nano structure)등이 인체에 유해한 영향 요인으로 예측 되고 있다.14,15)
일반적으로 입자상 물질은 호흡기의 점막과 섬모 에 의한 기계적 배출기전(mucociliary escalation)에 의해 체외로 배출되나, 나노입자의 경우는 폐포를 통 과하여 혈관계로 쉽게 유입되어 여러 조직으로 분포 될 뿐만 아니라 이들 조직에서 활성산소를 생성시키 거나 염증반응을 유발하는 것으로 알려져 있다.16)역 학연구조사에 의하면 공기 중 나노입자는 기도질환 의 악화나 심혈관계에 영향을 미쳐 감수성 집단에서 는 유병율과 사망률에 영향을 주는 것으로 보고되고
있다.17,18) 또한 중금속 등을 포함하고 있는 나노입자
는 기침을 통하여 신체 밖으로 배출이 안되므로 폐 포에 침착이 많아지게 되어 인체에 더 큰 영향을 주 게 되는 것으로 알려져 있다.19)
또한 큰 입자보단 작은 입자가 단위 중량 당 표면 적이 커지며, 나노크기의 입자가 화학반응의 촉매로 서 작용하는 특성이 있다.20) 특히, 동일한 질량의 입 자가 노출될 때 직경이 0.1 µm인 입자는 인체 내에 침투할 경우 10 µm의 입자에 비해 표면적이 104배 정도 넓으며, 0.01 µm 입자는 10 µm의 입자에 비해 약 106배 정도 넓다.21) 따라서 나노입자는 물질 자 체의 독성 영향도 존재하지만, 입자 크기가 작아질 수록 그 표면적이 상대적으로 증가하기 때문에 유해 물질의 흡착율 및 생체조직에 대한 반응성이 증가되 어 독성이 발생되는 것으로 추정되고 있다.22,23)
그간 나노물질에 관한 연구는 디젤분진 등 비의도 적이며 인위적으로 생성되는 물질에 대한 독성연구 가 주를 이루었으며,24,25)일반 실내 환경에서 접할 수 있는 프린터, 팩스, 복사기, 요리과정 및 담배 등과 같은 발생원에 대한 나노입자의 농도 분포 등을 측 정, 분석한 연구는 상대적으로 매우 부족한 실정이다.
따라서 본 연구에서는 입자의 크기분포에 따른 시 료포집이 가능한 다단의 MOUDI 샘플러를 이용하 여 대학교 행정실 실내 실외 공기 중 나노입자의 중
량 농도와 중금속 농도를 분석, 평가하여 향후 실내 나노입자에 대한 관리방안 수립을 위한 기초자료로 제공하고자 한다.
II. 연구방법 1. 연구대상 및 기간
본 연구는 일반 공기 중 나노입자 농도를 파악하 기 위해 아산의 S대학교의 실내(사무실)와 실외에서 2010년 6월 2일부터 11월 26일까지 약 6개월간(실 내 10회, 실외 9회) 조사하였다. 실외의 경우 06/21- 06/24, 06/27-06/30, 07/12-07/15, 08/01-08/04, 09/
02-09/05, 10/02-10/05, 10/10-10/13, 11/04-11/07, 11/23-11/26에 포집되었으며, 실내의 경우 06/02-06/
05, 06/11-06/14, 07/05-07/08, 07/21-07/24, 08/17- 08/20, 09/08-09/11, 09/28-10/01, 10/21-10/24, 10/
28-10/31, 11/11-11/14에 측정되었다.
2. 측정 및 분석방법 2.1. 시료의 포집방법
공기 중 나노입자(nanoparticles)의 측정에는 MOUDI- 110 (MSP Corporation, USA)을 이용하여 입경별(10, 5.6, 3.2, 1.8, 1.0, 0.56, 0.32, 0.18, 0.10, 0.056µm) 로 분당 30 l/min의 유량으로 3일(72시간)동안 연속 측정하였다. 필터(filter)는 stage 1-stage 8까지 Pallflex membrane filter(46.2 mm, Pall Life Science Cor.
USA)를 사용하였으며, 나노입자에 해당하는 stage 9-stage 10 단계에서는 중금속 포집과 분석이 가능 한 PTFE filter(2.0 µm, 46.2 mm, Whatman Inc.
USA)를 사용하였다. 필터는 항온, 항습을 유지하기 위하여 데시케이터 내에서 48시간 이상 보관하였으 며, 1.0×10⁻⁶g까지 측정 가능한 micro balance(CP2P-
F, Sartorius, Germany)를 이용하여 무게를 측정한 후 시료를 포집하였다.
2.2. 시료의 분석방법
2.2.1 나노입자(nanoparticles)의 중량 농도 포집한 시료는 채취 전과 동일한 방법으로 항온, 항습 상태인 데시케이터 내에서 48시간 이상 보관 한 후 micro balance(CP2P-F, Sartorius, Germany)를 이용하여 여지 무게를 측정한 후 질량 농도를 산정 하였다.
2.2.2 금속성분(Heavy Metal) 농도
나노입자 중 중금속 농도는ICP-MS(ELAN 6100, Perkin-elmer SCIEX, USA)를 사용하여 분석을 실 시하였다. 금속성분을 추출하기 위해 환경부 대기오 염 공정시험방법 ES 01450.2 방법에 따라 테프론 (teflon)용기에 시료를 담은 후 용기에 염산(30% HCl, Merck KGaA, Germany)과 질산(65% HNO3, Merck KGaA, Germany)을 3 대 1로 혼합한 왕수(aqua regia) 6 ml 첨가하고 핫플레이트(hotplate) 위에서 150-180oC 로 3시간 정도 반응시킨 후 상온에서 식혔다. 용기 가 완전히 식으면 뚜껑을 3차 증류수를 이용하여 3 회 이상 세척하여 다시 핫플레이트 위에서 150-180oC 로 가열하여 증발시켰다(이 때에는 뚜껑을 열고 가 열한다). 증류수가 거의 증발될 때까지 가열한 후 상 온에서 식힌 뒤 3차 증류수를 이용하여 용기를 3회 이상 세척하여 최종 볼륨이 15 ml가 되도록 하였다.
전처리 후 ICP-MS를 이용하여 중금속 농도를 분 석하고, 공시료 값에 대하여 보정을 하였다. 분석에 사용된 표준용액은 ICP-MS Multi-element standard solution 10 ppm(AccuTraceTM Reference standard ICP-MS Calibration standard 2, AccuStandard, Inc., USA)을 사용하여 0.1, 1, 5, 20 ppb로 희석한 용액 을사용하였다.37)
III. 연구결과 및 고찰 1. 나노입자 중량 농도
1.1 실내· 외 나노입자 농도
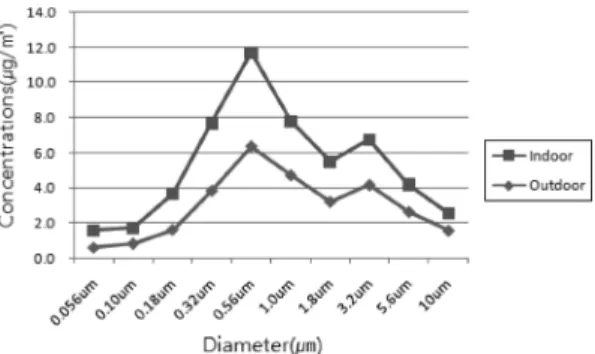
본 연구가 이루어진 여름과 가을의 평균 실내·외 입경별 농도를 Fig. 1에 제시하였다. 두 장소의 입 경별 농도를 살펴 본 결과 입자의 농도 분포는 비 Table 1. Specifications
MOUDI Model-110
Impactor stage 10 Stage
Flow rate 30l/min
Power 115VAC 50/60 Hz, 0.5A
Size(D×H) 220×560 mm
Cut-point diameter, µm 10, 5.6, 3.2, 1.8, 1.0, 0.56, 0.32, 0.18, 0.10, 0.056 Pump GAST Model 0823 Series
슷한 유형을 보이고 있었으며, 0.10 µm부터 0.056 µm 이하의 나노입자가 장소별로 실내 8%, 실외 5%를 차 지하고 있었다. 이는 전체 포집된 먼지입자 중 나노입 자의 기여율이 상당할 것으로 생각된다. 이러한 나노 입자의 실내와 실외의 농도를 Table 1에 나타내었다.
실내 공기 중에서 입경분포가 0.056 µm 이하와 0.10 µm- 0.056µm의 기하평균 농도는 각각 1.002 µg/m3, 0.929µg/m3이었으며, 실외는 0.597 µg/m3, 0.819µg/m3 로 실내의 농도가 실외보다 높은 경향을 나타냈다. 실 내와 실외의 Mann-Whitney U test를 한 결과 ≤0.056 µm 에서 통계적으로 유의한 차이를 보였다(p < 0.05).
Maston(2005)의 연구에서 흡연을 허용한 사무실의 나노입자가 실외보다 높은 값을 나타내는 경우가 있 다고 보고하였는데26)본 연구가 이루어진 장소의 경 우 출입구 주변에서 흡연을 하는 사람을 많이 볼 수 있었으며, 실내 측정 장소가 실외 출입구와 가까워 서 환기를 위하여 창문을 열거나, 사람들의 이동과 바람의 영향으로 유입된 담배 연기로 인하여 실내
나노입자가 영향을 받은 것으로 생각된다. 또한 Kagi 등(2007)의 연구에 서 레이져 프린터를 사용하는 동 안에 50 nm 이하 입자의 농도가 크게 증가하는 것 으로 나타났으며,27) Lee와 Hsu(2007)의 연구에서도 복사기 사용전과 복사기 사용 중의 농도를 비교한 결과 복사기 사용 중의 나노입자의 농도가 높았으며, 입자의 크기가 작아질수록 복사기 사용전과 사용 중 의 농도 차이가 크게 나타났다.28)본 연구에서의 실 내 농도의 경우도 프린터 및 복사기의 사용으로 인 한 영향을 받았을 것으로 판단된다.
1.2 계절별 나노입자 농도
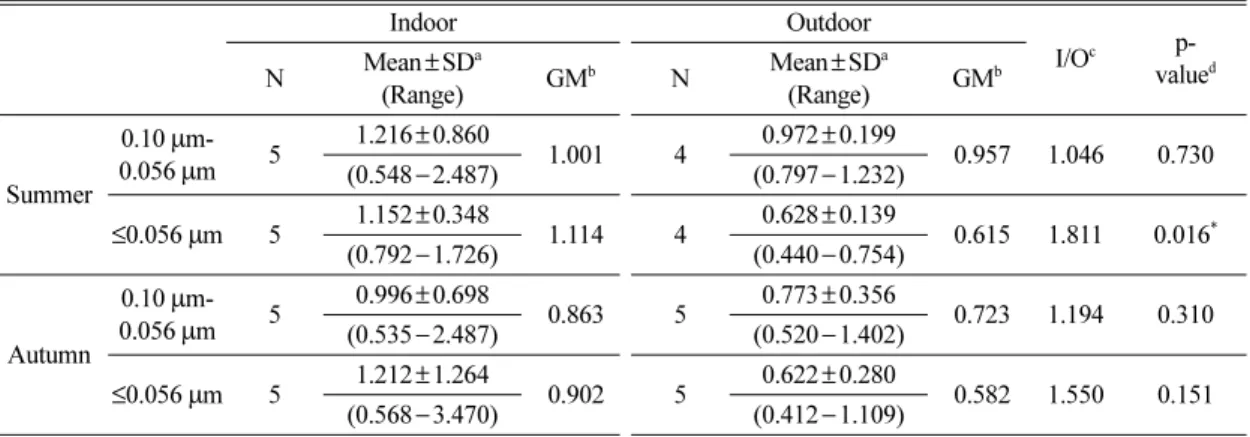
실내와 실외의 계절별 농도를 여름과 가을로 구분 하여 살펴본 결과 여름철 실내 공기 중의 기하평균 농도는 입경분포가 0.056 µm 이하와 0.10 µm-0.056 µm 에서 각각 1.001 µg/m3, 1.114µg/m3로 이었으며, 실 외는 0.615 µg/m3, 0.957µg/m3로 실내의 농도가 실 외보다 높은 경향을 나타냈다(Table 2).
가을철 실내 공기 중의 기하평균 농도는 입경분포 가 0.056 µm 이하와 0.10 µm-0.056 µm에서 각각 0.902µg/m3, 0.863µg/m3이었으며, 실외는 0.582 µg/m3, 0.723µg/m3로 조사되었다. 가을철의 경우도 실내의 농도가 실외보다 높게 나타났으나, 두 장소간의 통 계적인 유의한 차이는 없었다.
두 계절 모두 실내의 농도가 높게 조사되었고, Mann-Whitney U test를 한 결과 여름철 입경분포가 0.056µm 이하일 때 통계적으로 유의한 차이를 보 였다(p < 0.05).
본 연구결과 여름이(0.032 ppm) 가을에 비하여 (0.015 ppm) 높은 오존농도를 보였는데 이는 광화학 Fig. 1. Concentration and size of particles in two regions
throughout summer and autumn.
Table 2. Indoor concentration and outdoor concentration of nanoparticles (unit: µg/m3)
Indoor Outdoor
I/Oc p- valued N Mean°æSDa
(Range) GMb N Mean°æSDa
(Range) GMb
Nano
0.10 ߦ -
0.056 ߦ 10 1.106±0.747
0.929 9 0.861±0.299
0.819 1.285 0.905
(0.535−2.487) (0.520−1.402)
0.056 ߦ 10 1.182±0.875
1.002 9 0.625±0.216
0.597 1.189 0.017*
(0.568−3.470) (0.412−1.109)
aArithmetic mean ±Arithmetric standard deviation
bGeometric mean
cIndoor/outdoor ratios
dMann-Whitney U test, *p<0.05
반응을 통해 생성된 오존이(나노입자) 높게 나타나 는 것으로 보고하고 있어,29,30) 강한 일조량을 보이는 여름이 광화학 반응의 영향으로 높게 나타난 것으로 생각된다.
2. 나노입자 중 중금속 농도
2.1. 실내· 외 나노입자 중 중금속 농도
실내와 실외의 나노입자 중 중금속의 기하평균 농 도는 Table 3와 같다. 실외 공기 중 Al의 농도는 입 경분포가 0.056 µm 이하와 0.056-0.10 µm에서 각각, 14.131 ng/m3, 14.170 ng/m3로 실내의 10.164 ng/m3, 11.658 ng/m3에 비하여 높게 나타났으며, 실내와 실 외 모두 약 80%로 가장 많은 분포를 보였다. Al은 지각에 기인하는 원소이자 토양의 지표성분으로 보 통 자연적으로 발생하게 되는데,31,32)실내의 경우 다 양한 사무기기와 에어컨의 열교환기에 포함되어 있 는 알루미늄 판의 부식,4)신발에 묻혀 들어오는 토 양성분 등으로 인하여 실내에서도 높은 분포를 나타 내는 것으로 생각된다.
실외 공기 중 Zn의 농도는 입경분포가 0.056 µm 이하와 0.056-0.10 µm에서 각각 1.189 ng/m3, 1.699 ng/m3로 실내 0.617 ng/m3, 0.745 ng/m3보다 높게 조 사되었다. Zn의 주요 오염원은 석탄 및 기름연료의 사용, 자동차 타이어 마모, 윤활유 등으로 인한 인 위적인 오염원으로 보고하고 있는데,33,34) 실외의 경
우 측정지점에서 150 m 떨어진 곳에서 공사가 이루 어져 많은 차량 통행의 영향으로 인하여 높은 경향 을 보인 것으로 판단된다.
Cr과 Ni의 경우 입경분포가 0.056 µm 이하에서 각 각 실내(0.736 ng/m3, 0.177 ng/m3)가 실외(0.444 ng/m3, 0.091 ng/m3)에 비하여 높게 나타났다. Cr의 경우 페 인트, 시멘트, 가죽의 태닝제, 복사기의 토너 등으로 부터 발생되는데,4,35,36) 본 연구결과도 같은 경향을 보이고 있어 실내오염물질의 저감을 위해서는 이들 의 관리가 필요할 것으로 생각된다.
2.2. 계절별 나노입자 중 중금속 농도
계절별 실내와 실외의 나노입자 내 중금속 농도는 Table 4와 같다. 일반환경에서의 나노입자의 경우 샘 플의 획득이 쉽지 않았는데 Mn의 경우 입경분포가 0.056µm 이하와 0.056-0.10 µm에서 기하평균 농도를 살펴 본 결과 여름철 실내 공기 중에서 1.018 ng/m3, 0.847 ng/m3로 실외 공기 중의 0.358 ng/m3, 0.517 ng/m3 보다 높게 조사되었으며, 가을철의 경우 실외 (0.151 ng/m3, 0.120 ng/m3)가 실내(0.060 ng/m3, 0.112 ng/m3)보다 높게 나타났다. 조(2010)의 연구에 따르 면 아산 실외 공기 중 농도는 입경분포가 0.056 µm 이 하와 0.056-0.10 µm에서 여름(0.03 ng/m3, 0.18 ng/m3) 이 가을(0.04 ng/m3, 0.09 ng/m3)보다 높게 나타나37) 본 연구와 비슷한 경향을 보였다.
Table 3. Seasonal concentration of nanoparticles (unit: µg/m3)
Indoor Outdoor
I/Oc p- valued
N Mean±SDa
(Range) GMb N Mean±SDa
(Range) GMb
Summer
0.10µm-
0.056µm 5 1.216±0.860
1.001 4 0.972±0.199
0.957 1.046 0.730
(0.548−2.487) (0.797−1.232)
≤0.056 µm 5 1.152±0.348
1.114 4 0.628±0.139
0.615 1.811 0.016*
(0.792−1.726) (0.440−0.754)
Autumn
0.10µm-
0.056µm 5 0.996±0.698
0.863 5 0.773±0.356
0.723 1.194 0.310
(0.535−2.487) (0.520−1.402)
≤0.056 µm 5 1.212±1.264
0.902 5 0.622±0.280
0.582 1.550 0.151
(0.568−3.470) (0.412−1.109)
aArithmetic mean ±Arithmetric standard deviation
bGeometric mean
cIndoor/outdoor ratios
dMann-Whitney U test
*p<0.05
여름철 실내 공기중 Cr의 기하평균 농도는 0.056 µm 이하와 0.056-0.10 µm에서 각각 0.965 ng/m3, 0.798 ng/m3, 실외의 경우 0.576 ng/m3, 0.642 ng/m3로 실 내의 농도가 높게 나타났다. 가을 또한 실내(0.561 ng/m3, 0.590 ng/m3)가 실외(0.360 ng/m3, 0.809 ng/
m3)에 비하여 높은 경향을 보였다. 여름철 실내의 경 우 가을보다 높은 값을 보였는데 이는 여름철에 보 고서 작성 등으로 인한 프린터 사용이 집중되어 Cr
농도에 영향을 주었을 것으로 판단된다.
실내 Zn, Ni, Cu, Pb의 경우 가을철에 비하여 여 름철에 낮은 농도를 나타내고 있었다. 박(2007), 조 (2001)등의 연구에 의하면 유연 휘발유에서 나오는 Pb의 영향으로 난방연료 사용이 많은 가을철에 많 이 나오며,29,38) Cu와 Ni 또한 실내에서 기름의 연소 와 같은 난방연료의 사용으로 발생된 것으로 보고하 고 있어 본 연구의 결과와 같은 경향을 나타냈다.39,40) Table 4. Indoor and outdoor concentration of heavy metals among the nano particles (unit: ng/m3)
Indoor Outdoor
p- valuec
N Mean±SDa
(Range) GMb N Mean±SDa
(Range) GMb
Al
0.10µm-
0.056µm 10 13.273±6.446
11.658 9 16.941±7.523
14.170 0.211
(5.312−21.377) (2.148−25.513)
≤0.056 µm 10 11.245±4.823
10.164 9 14.618±3.875
14.131 0.095
(3.574−18.052) (8.961−19.299)
Mn
0.10µm-
0.056µm 9 0.644± 0.692
0.345 9 0.420±0.504
0.230 0.605
(0.039−2.014) (0.037−1.592)
≤0.056 µm 9 0.693±0.738
0.290 7 0.430±0.375
0.247 0.758
(0.051−1.942) (0.037−0.919)
Zn
0.10µm-
0.056µm 4 0.991±0.758
0.745 7 1.762±0.502
1.699 0.164
(0.246−1.890) (1.068−2.587)
≤0.056 µm 4 1.576±2.069
0.617 7 1.466±0.940
1.189 0.648
(0.103−4.544) (0.353−2.683)
Ni
0.10µm-
0.056µm 4 0.235±0.093
0.220 3 0.346±0.201
0.311 0.629
(0.125−0.336) (0.198−0.575)
≤0.056 µm 6 0.230±0.172
0.177 4 0.113±0.082
0.091 0.257
(0.050−0.474) (0.047−0.217)
Cu
0.10µm-
0.056µm 1 0.059± -
0.059 6 0.378±0.341
0.288 0.286 (0.132−1.031)
≤0.056 µm 2 2.909±1.822
2.608 6 0.327±0.399
0.205 0.071
(1.620−4.197) (0.064−1.123)
Cr
0.10µm-
0.056µm 10 0.840±0.566
0.686 9 0.850±0.480
0.730 0.842
(0.307−1.976) (0.221−1.677)
≤0.056 µm 10 0.916±0.565
0.736 9 0.520±0.274
0.444 0.133
(0.207−1.901) (0.165−0.884)
Pb
0.10µm-
0.056µm 5 0.374±0.414
0.218 7 0.218±0.106
0.193 0.755
(0.038−1.080) (0.073−0.356)
≤0.056 µm 4 0.250±0.333
0.141 7 0.148±0.152
0.111 0.788
(0.055−0.749) (0.044−0.487)
aArithmetic mean ±Arithmetric standard deviation
bGeometric mean
cMann-Whitney U test
Table5.Seasonal concentration of heavy metals(unit: ng/m3)
Summer
p-value c Autumn
p-value d IndoorOutdoorIndoorOutdoor N Mean±SDa
(Range) GMbN Mean±SDa
(Range) GMbN Mean±SDa
(Range) GMbN Mean±SDa
(Range) GMb
Al 0.10µm-0.056µm 5 10.839±6.3649.4224 15.263±4.93614.5490.1905 15.708±6.17914.4255 18.283±9.47813.8740.421(8.483−20.321)(6.357−21.377)(2.148−25.513)(5.312−19.581)
≤0.056µm5 8.862±4.9307.8364 11.936±2.73911.6990.1905 13.627±3.72113.1845 16.764±3.38416.4370.151(8.961−15.122)(8.473−18.052)(10.984−19.299)(3.574−16.812) Mn 0.10µm-0.056µm 5 1.041±0.7080.8474 0.720±0.643 0.5170.5564 0.147±0.124 0.1125 0.180±0.191 0.1200.905(0.213−1.592)(0.039−0.325)(0.037−0.510)(0.347−2.014)
≤0.056µm5 1.198±0.6091.0184 0.486±0.332 0.3580.1114 0.061±0.009 0.0603 0.353±0.492 0.1510.629(0.077−0.890)(0.051−0.069)(0.037−0.919)(0.299−1.942) Zn 0.10µm-0.056µm N.D3 1.871±0.763 1.756N.A4 0.991±0.758 0.7454 1.679±0.306 1.6570.343(1.068−2.587)(0.246−1.890)(1.279−2.023)
≤0.056µmN.D3 2.037±1.101 1.761N.A4 1.576±2.069 0.6174 1.038±0.625 0.8860.886(0.765−2.683)(0.103−4.544)(0.353−1.869) Ni 0.10µm-0.056µm1 N.D1 0.575±- 0.575N.A4 0.235±0.0930.2202 0.231±0.047 0.2291.000-(0.125−0.336)(0.198−0.264)
≤0.056µm 0.474°æ-0.4741 0.217±- 0.2171.0005 0.181±0.1380.1453 0.078±0.054 0.0680.143--(0.050−0.414)(0.047−0.140)
aArithmetic mean±Arithmetric standard deviationbGeometric meancMann-Whitney U test between concentration of heavy metal in Summer, Indoor and OutdoordMann-Whitney U test between concentration of heavy metal in Autumn, Indoor and OutdoorN.D: Not Detectable, N.A: Not Applicable
Table5.Seasonal concentration of heavy metals(unit: ng/m3) Summer p- valuec
Autumn p- valuedIndoorOutdoorIndoorOutdoor NMean±SDa (Range)GMb NMean±SDa (Range)GMb NMean±SDa (Range)GMb NMean±SDa (Range)GMb Cu
0.10µm- 0.056µmN.D30.307±0.147 0.281N.A10.059±- 0.05930.450±0.504 0.2940.500 (0.160−0.454)-(0.132−1.031) ≤0.056µmN.D30.141±0.087 0.123N.A22.909±1.822 2.60830.514±0.535 0.3420.200 (0.064−0.235)(1.620−4.197)(0.119−1.123) Cr
0.10µm- 0.056µm51.002±0.709 0.79840.797±0.556 0.6420.73050.678±0.389 0.59050.892±0.472 0.8090.548 (0.221−1.552)(0.320−1.128)(0.467−1.677)(0.307−1.976) ≤0.056µm51.158±0.609 0.96540.598±0.191 0.5760.19050.675±0.448 0.56150.458±0.335 0.3600.548 (0.258−1.901)(0.433−0.849)(0.207−1.394)(0.165−0.884) Pb
0.10µm- 0.056µmN.D30.229±0.115 0.209N.A50.374±0.414 0.21840.210±1.116 0.1820.905 (0.123−0.352)(0.038−1.080)(0.073−0.356) ≤0.056µmN.D30.089±0.044 0.081N.A40.250±0.333 0.14140.192±0.198 0.1391.000 (0.074−0.487)(0.044−0.133)(0.055−0.749) aArithmetic mean±Arithmetric standard deviation bGeometric mean cMann-Whitney U test between concentration of heavy metal in Summer, Indoor and Outdoor dMann-Whitney U test between concentration of heavy metal in Autumn, Indoor and Outdoor N.D: Not Detectable, N.A: Not Applicable
IV. 결 론
본 연구는 2010년 3월부터 11월(실내 10회, 실외 14회)까지 아산(S대학교)의 일반 환경 중 나노입자 를 대상으로 중량농도와 중금속(Al, Mn, Zn, Ni, Cu, Cr, Pb) 농도를 파악하였다.
1. 실내 공기 중 나노입자(입경분포가 0.056 µm 이 하, 0.10 µm-0.056 µm)의 기하평균 농도는 각각 1.002 µg/m3, 0.929 µg/m3, 이었으며, 실외는 0.597 µg/m3, 0.819 µg/m3로 실내의 농도가 실외보다 높은 경향을 나타냈다.
2. 계절별 공기 중 나노입자 농도 분포의 경우 가 을에 비하여 여름이 높은 경향을 보였으며, 여름철 입경분포가 0.056 µm 이하일 때 통계적으로 유의한 차이를 나타냈다(p<0.05).
3. 실내와 실외 공기의 나노입자 중 중금속 농도 는 Zn의 경우 입경분포가 0.056 µm 이하와 0.056- 0.10 µm에서 실외는 각각 1.189 ng/m3, 1.699 ng/m3 로 실내 0.617 ng/m3, 0.745 ng/m3보다 높았으며, 인 체에 위해도가 큰 것으로 알려진 Cr과 Ni의 경우 입 경분포가 0.056 µm 이하에서 각각 실내(0.736 ng/m3, 0.177 ng/m3)가 실외(0.444 ng/m3, 0.091 ng/m3)에 비 하여 높게 나타났다.
4. 계절에 따른 나노입자 중 중금속 농도의 경우 실내 Zn, Ni, Cu, Pb이 가을철에 높은 농도를 나타 내고 있었으며, 실내 Cr의 경우 여름철과 가을철 모 두 실외에 비하여 높은 경향을 보였다.
본 연구의 결과는 일반 환경 중 나노입자와 중금 속 농도 결과를 제시함으로써 향후 나노입자에 관한 관리방안을 수립하는데 중요한 데이터로 활용될 것 으로 생각된다.
참고문헌
1. Hoddinott KB, Lee AP. The use of environmental risk assessment methodologies for an indoor air quality investigation. Chemosphere. 2000; 41(1-2):
77-84.
2. Statistics Korea. Report on the time use survey.
2000; 1: 29-50.
3. Sundell J. On the history of indoor air quality and health. Indoor Air. 2004; 14(7): 51-58.
4. Lee SD. A study on chemical composition of PM10
and PM2.5 in office buildings. [dissertation]. [Seoul]:
Hanyang University; 2006.
5. Lee YM, Park CH, Song SH, Heo WJ, Yu SD, Jeong YH. The distribution of fine particles in indoor/outdoor at elementary school in Incheon.
Proceedings of the 47th meeting of KOSAE. 2008;
538-539.
6. Montoya L, Lawrenceb J, Murthy GK, Sarnatb J, Godleski J, Koutrakis P. Continuous measurements of ambient particle deposition in human subjects.
Aerosol Sci Technol. 2004; 38(10): 980-990.
7. Park EJ. Health risk assessment of fine particles and their hazardous chemicals. [dissertation]. [Seoul]:
Dongduk Womens University; 2008.
8. U.S.EPA. Air quality criteria for particulate matter, office of research and development. 2004.
9. Kulmala M, Vehkamäki H, Petäjä T, Dal Maso M, Lauri A, Kerminen VM, Birmili W, McMurry PH.
Formation and growth rates of ultrafine atmo- spheric particles: a review of observations. J Aero- sol Sci. 2004; 35(2): 143-176.
10. NNI. What is Nanotechnology? Available: http://
www.nano.gov/html/facts/whatIsNano.html. 2004.
11. U.S.EPA. Ministry of Environment. Nanotechnol- ogy white paper. 2007.
12. Morawska L, Moore MR, Ristovski Z. Health impacts on ultrafine particles. Environment stan- dards Branch, Department of the Environment and Heritage. 2004.
13. Elihn K, Berg P. Ultrafine particle characteristics in seven industrial plants. Ann Occup Hyg. 2009;
53(5): 475-484.
14. Maynard AD, Kuempel ED. Airborne nanostruc- tured particles and occupational health. J Nanopart Res. 2005; 7(6): 587-614.
15. Langer S, Moldanov'a J, Arrhenius K, Ljungström E, Ekberg L. Ultrafine particle produced by ozone/
limonene reactions in indoor air under low/closed ventilation conditions. Atmos Env. 2008; 42(18):
4149-4159.
16. Korea Occupational Safety & Health Agency. Haz- ard identification of nanoparticles and prevention strategy for work related health problem. 2007.
17. Penttinen P, Timonen KL, Tittanen P, Mirme A, Ruuskanen J, Pekkanen J. Ultrafine particles in urban air and respiratory health among adult asth- matics. Eur Respir J. 2001; 17(3): 428-435.
18. Donaldson K, Stone V. Current hypotheses on the mechanisms of toxicity of ultrafine particles. Ann Ist Super Sanita. 2003; 39(3): 405-410.
19. Lee GW. Exposure and risk assessment of size-
related heavy metals in particulate matter. [disserta- tion]. [Seoul]: Yonsei University; 2009
20. Maeng SH, Yu IJ. The concepts of nanotoxicology and risk assessment of the nanoparticles. J Toxicol Pub Health. 2005; 21(2): 87-98.
21. Harrison RM, Shi JP, Xi S, Khan A, Mark D, Kin- nersley R, Yin J. Measurement of number, mass and size distribution of particles in the atmosphere. Philos Transact A Math Phys Eng Sci. 2000; 358(1775):
2567-2580.
22. Utell MJ, Frampton MW. Acute health effects of ambient air pollution: The ultrafine particle hypoth- esis. J Aerosol Med. 2000; 13(4): 355-359.
23. Kreuter J, Shamenkov D, Petrov V, Ramge P, Cychutek K, Koch-Brandt C, Alyautdin R. Apoli- poprotein-mediated transport of nanoparticle-bound drugs across the blood-brain barrier. J Drug Target.
2002; 10(4): 317-325.
24. Park KS. Toxicity of nanomaterials and strategy of risk assessment. J ENVIRON TOXICOL. 2005;
20(4): 259-271.
25. Shin DC. A review of the literature on health effects of ultra-fine particles. Journal of Korean Society for Indoor Environment. 2006; 2(2): 81-88.
26. Maston U. Indoor and outdoor concentrations of ultrafine particles in some Scandinavian rural and urban areas. Sci Total Environ. 2005; 343(1-3): 169- 176.
27. Kagi N, Fujii S, Horiba Y, Namiki N, Ohtani Y, Emi H, Tamura H, Kim YS. Indoor air quality for chemical and ultrafine particle contaminants from printers. Build Environ. 2007; 42(5): 1949-1954.
28. Lee CW, Hsu DJ. Measurements of fine and ultrafine particles formation in photocopy centers in Taiwan. Atmos Env. 2007; 41(31): 6598-6609.
29. Park JY, Heo YJ, Kim JS, Cho GN, Park GH. Stud- ies on nanoparticle events and seasonal variation nanoparticle concentration in the ambient atmo- sphere. The 2007 Environmental Societies Joint Conference, J KOSAE. 2007; 1303-1305.
30. Park KH, Park JY, Kwak JH, Cho GN, Kim JS.
Seasonal and diurnal cariations of ultrafine particle concentration in urban Gwangju, Korea: Observa- tion of ultrafine particle events. Atmos Env. 2008;
42(4): 788-799.
31. Choi MS, Park EJ. Trace metals in airborne partic- ulates collected at Cheju Island Korea. J KOSAE.
1999; 15(6): 727-738.
32. Jeong JH, Im JM, Mun JH, Lee JH. Distribution characteristics of chemical composition of roadside airborne PM2.5 in Daejeon city. Proceedings of the 46th meeting of KOSAE. 2008; 547-548.
33. Lee HM, Kim DS, Lee JH. An assessment of the long-term concentration of heavy metals and asso- ciated risk in ambient PM10. J KOSAE. 1996; 12(5):
555-566.
34. Chow JC. Measurement methods to determine com- pliance with ambient air quality standards for sus- pended particle. J Air Waste Manag Assoc. 1995;
45(5): 320-382.
35. Ministry of Labor. A study on the revision of chem- ical substances exposure limit: hexavalent chrome.
2005.
36. Na DJ, Lee BK. A study on the characteristics of PM10 and air-borne metallic elements produced in the industrial city. J KOSAE. 2000; 16(1): 23-35.
37. Cho TJ. A study on the size of ultrafine particles and heavy metal level in the atmosphere. [disserta- tion]. [Asan]: Soonchunhyang University; 2010 38. Cho EJ. A study on the chemical commposition of
atmospheric aerosols in Kwangju. [dissertation].
[Kwangju]: Chosun University; 2001
39. Kim SW. Source characterization and concentration of chemical elements in fine particulate in an indus- trial area. [dissertation]. [Seoul]: Hanyang Univer- sity; 1997
40. Koutrakis K, Briggs LK. Source apportionment of indoor aerosols in Suffolk and Onondaga Counties, New York. Environ Sci Technol. 1992; 26: 521-527.