Modeling of Suspended Solids and Sea Surface Salinity in Hong Kong using Aqua/MODIS Satellite Images
Man Sing Wong*,**, Kwon Ho Lee**†, Young Joon Kim***, Janet Elizabeth Nichol*, Zhangqing Li**, and Nick Emerson*
* Department of Land Surveying and Geo-Informatics,
The Hong Kong Polytechnic University, Hung Hom, Kowloon, Hong Kong
** Earth System Science Interdisciplinary Center (ESSIC), University of Maryland (UMD), College Park, MD 20742, USA
*** Advanced Environmental Monitoring Research Center (ADEMRC), Gwangju Institute of Science & Technology (GIST), Gwangju, Korea
Abstract :A study was conducted in the Hong Kong with the aim of deriving an algorithm for the retrieval of suspended sediment (SS) and sea surface salinity (SSS) concentrations from Aqua/MODIS level 1B reflectance data with 250m and 500m spatial resolutions. ‘In-situ’ measurements of SS and SSS were also compared with coincident MODIS spectral reflectance measurements over the ocean surface. This is the first study of SSS modeling in Southeast Asia using earth observation satellite images. Three analysis techniques such as multiple regression, linear regression, and principal component analysis (PCA) were performed on the MODIS data and the ‘in-situ’ measurement datasets of the SS and SSS. Correlation coefficients by each analysis method shows that the best correlation results are multiple regression from the 500m spatial resolution MODIS images, R2= 0.82 for SS and R2= 0.81 for SSS. The Root Mean Square Error (RMSE) between satellite and ‘in-situ’ data are 0.92mg/L for SS and 1.63psu for SSS, respectively.
These suggest that 500m spatial resolution MODIS data are suitable for water quality modeling in the study area. Furthermore, the application of these models to MODIS images of the Hong Kong and Pearl River Delta (PRD) Region are able to accurately reproduce the spatial distribution map of the high turbidity with realistic SS concentrations.
Key Words :MODIS, suspended solids, salinity, regression, Principal Component Analysis.
Received 29 May 2007; Accepted 5 June 2007.
†Corresponding Author: Kwon Ho Lee ([email protected])
1. Introduction
Hong Kong, an affluent city with a service-based economy is situated at the mouth of the Pearl River, whose delta region, spanning Hong Kong, Macau and Guangdong Province of China, has undergone lightning-paced industrial and urban development over the last 20 years. Accompanying this, the Pearl River Delta (PRD) region itself has suffered many adverse environmental changes including sea level rise, increased storminess and changes in salinity, sea surface temperature, nutrient, phytoplankton and sediment content, and sediment transport profiles.
The economy and activities of the coastal cities of the PRD are directly affected by such changes. Increased salinity in the domestic water supply, with adverse effects for residents and tourists alike, has recently gained wide publicity.
Marine monitoring system in Hong Kong, still relies on the Conductivity-Temperature-Depth (CTD) profilers developed in 1986 (EPD, 2004) for water quality monitoring. These are deployed at fixed points and data is collected biweekly and monthly.
The problems of point sampling at fixed stations may be overcome by the use of satellite images which potentially offer wide area coverage, as well as long- term and continuous marine measurements. Until recently, no suitable marine satellite sensors were available, since the most commonly used earth monitoring satellites LANDSAT and SPOT were calibrated for land. Thus their signal to noise ratio for low reflectance water surfaces was inadequate to obtain meaningful data. Furthermore, in a sub- tropical region such as Hong Kong, the low repeat cycles and high cost of these satellites limited their usefulness for monitoring constantly changing phenomena such as water quality.
The MODIS sensors on NASA’s TERRA and AQUA spacecrafts were launched in 1999 and 2002,
respectively. They are multi-spectral sensors with several wavebands designed for the sensing of earth’s environment including atmosphere, land, and ocean.
Miller and Mckee (2004) made use of Terra/MODIS 250m resolution images for mapping suspended matter, and found a high correlation (R2 = 0.89) between MODIS 250m images and ‘in-situ’
measurements in Mississippi Delta. Barbin et al.
(2004) used LIDAR fluoro-sensor for measuring surface chlorophyII-a concentration in transects between New Zealand and Italy, and found a good agreement between MODIS and SeaWiFS datasets.
They also emphasized the usefulness of ‘in-situ’
sensors for continuous calibration to counteract the failure of remote-sensing in cloudy environments.
This study aims to demonstrate the usefulness of MODIS spectral images for water quality measurements using ‘in-situ’ water quality monitoring data (suspended solids and salinity) provided by the Hong Kong Environmental Protection Department (EPD).
2. Study area and data used
Hong Kong waters, can be divided into three zones based on influences from different geographical sources (Morton and Wu, 1975; Wu, 1988). The western waters (Deep Bay) which are affected by Pearl River estuarine region are turbid. The eastern waters (Mirs Bay) are influenced by the Pacific currents, while the central waters are influenced by both Pearl River, Pacific currents, as well as by local residential and industrial effluents into the Victoria Harbour (Yeung, 1998). During 2003 to 2004, the average salinity over Hong Kong was quite high at around 28.5 psu and average suspended solids were around 11.7 mg/L. It was observed in 2003 and 2004 that salinity concentration was at a minimum during summer time, and at a maximum in spring and winter
time (Fig. 1), suspended solids content fluctuated between 5 to 32 mg/L.
The Hong Kong marine monitoring system was designed in 1986, using conductivity-temperature- depth profilers for water sampling. Fig. 2 shows the locations of these monitoring stations. Three levels in the water column are measured: (i) surface (1m
below sea surface), (ii) middle (half of the sea depth) and (iii) bottom (1m above seafloor). For this study the ‘in-situ’ surface (1 meter below sea surface) data only will be used because it is expected to have higher correlation with image reflectances than middle and bottom water column measurements. In addition, ten cloud-free images were acquired from
Fig. 2. Locations of the marine monitoring stations overlaid with Hong Kong boundaries Fig. 1. Monthly average of salinity and suspended solids over 2003 to 2004
year 2003 to year 2004.
MODIS/Aqua sensor provides high radiometric sensitivity (12 bit) data in 36 spectral bands ranging in wavelength from 0.4mm to 14.4mm. Two bands are imaged at a nominal resolution of 250 m at nadir, five bands at 500m, and the remaining 29 bands at 1km.
All the bands were selected particularly to minimize the impact of absorption by atmospheric gases (Justice et al., 2002). Because of its advantages, MODIS images are being used increasingly to detect the change of water environment.
Ten sets of Aqua/MODIS level 1B images were acquired through the NASA Goddard Earth Science Distributed Active Archive Center (DAAC). They were compared with 17 stations available from the EPD’s monitoring system. MODIS 250m and 500m images were selected for modeling instead of 1 km data because their finer resolutions show more spatial variation over the small study area. Table 1 illustrates the MODIS channels on 250m and 500m and their potential applications.
Only those 17 stations located on open water were selected since 250m and 500m resolution pixels are easily mixed with land cover close to channel and coast. Aqua/MODIS images, rather than Terra/MODIS, were selected since Aqua spacecraft crosses Hong Kong at noon (local time 1:30pm). This time is close to the EPD’s data collection time (12:30 noon), allowing the data to easily satisfy the
definition of ‘in-situ’ (Woodruff et al., 1999).
Acquiring ‘in-situ’ data corresponding to the satellite images is difficult especially for ocean and water studies. Miller and Mckee (2004) made use of 52
‘in-situ’ measurements during six field campaigns, for mapping suspended matter with Terra/MODIS 250m resolution images. Chen et al. (2004) classified water quality in the Pearl River estuary and its adjacent coastal waters of Hong Kong using clustering method based on 58 ‘in situ’ water quality dataset and 30 samples from two concentration maps of water quality parameters derived from SeaWiFS and AVHRR images. In this study, due to the limited availability of MODIS images corresponding with marine data, a total of 49 ‘in-situ’ water samples were available.
3. Methodology
1) Image preprocessing
Geometric correction of the MODIS data was carried out using the “Georeference MODIS”
function in ENVI, which provides automatic geometric correction for the MODIS images as well as correcting for orbit overlap and swath distortion (the bow-tie effect). The correction was done in order to compare the image data with water quality monitoring stations. Visual comparison with coastline vector data overlaid onto the images indicated that an Table 1. MODIS channels on 250m and 500m images and their potential applications (adopted from http://synergyx.tacc.utexas.edu/
DataUsersGuide/MODISbands.html).
Band # Pixel Resolution Reflected Bandwidth Potential Applications
(m) Range (nm)
1 250 620-670 Absolute Land Cover Transformation, Vegetation Chlorophyll
2 250 841-876 Cloud Amount, Vegetation Land Cover Transformation
3 500 459-479 Soil/Vegetation Differences
4 500 545-565 Green Vegetation
5 500 1230-1250 Leaf/Canopy Differences
6 500 1628-1652 Snow/Cloud Differences
7 500 2105-2155 Cloud Properties, Land Properties
Band # Pixel Resolution Reflected Bandwidth Potential Applications
(m) Range (nm)
accuracy of within 0.5 pixel was achieved.
In order to normalize the images with the corresponding spectral range, the empirical line calibration method (Smith and Milton, 1999) was employed. The empirical line method is based on the principle of using dark and bright regions in the image to calibrate the data through linear regressions in order to remove illumination and atmospheric effects. The pseudo-invariant targets (flat urban area and deep, clear reservoir water) were selected for normalization, whereby vegetation was not used since it varies seasonally with time (Teillet et al., 1990). The visual examination and statistical value with mean and standard deviation over targets were checked after the normalization.
2) Regression model
Three different models such as linear, multiple regression (Eq. 1), and Principal Component Analysis (PCA) analysis were applied to estimate the relationship between MODIS images and ‘in-situ’
data for 250m and 500m image resolution, respectively. Due to the limited availability of MODIS images corresponding with marine data, 49
‘in-situ’ water samples were available from 10 clear sky days. In order to examine the accuracy of each model, Root Mean Square Error (RMSE) (Eq. 2) of the models were used.
Marine data = A0+ Ai(MODISi) (1)
RMSE = (xi_mi)2 (2) where A0, Aiare constants of regression models, MODISi is ith band reflectance, xiis original data, mi is modeled data
4. Results
1) Suspended Solids (SS)
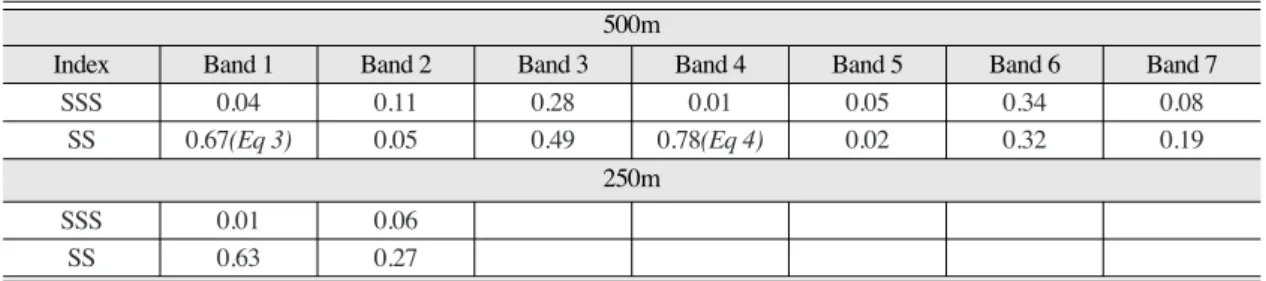
A fair correlation (R2=0.67) was found between the red band and suspended solids whereas green band was performed with higher correlation (R2=0.78) using simple linear regression at 500m resolution (Table 2). The correlation between MODIS 250m red band and suspended solids was slightly lower (R2=0.63) than that of 500m. This suggests that size aggregated to 500m has a higher representative ability than 250m, based on the results of correlation.
In Table 3, multiple regression performed better than simple linear regression (R2=0.82) as the multiple regression involved seven bands, and the volume scattering and reflections were varied in each band,
S
N i=11 N
S
k i=1Table 2. Correlation coefficients using simple linear regression with 500m and 250m images.
500m
Index Band 1 Band 2 Band 3 Band 4 Band 5 Band 6 Band 7
SSS 0.04 0.11 0.28 0.01 0.05 0.34 0.08
SS 0.67(Eq 3) 0.05 0.49 0.78(Eq 4) 0.02 0.32 0.19
250m
SSS 0.01 0.06
SS 0.63 0.27
500m
Index Band 1 Band 2 Band 3 Band 4 Band 5 Band 6 Band 7
250m
Table 3. Correlation coefficients using multiple linear regressions with 500m and 250m images.
Index 500m 250m
SSS 0.81 (Eq 7) 0.13
[P<0.0001] [P=0.04228]
SS 0.82 (Eq 5) 0.65 (Eq 6)
[P<0.0001] [P<0.0001]
Index 500m 250m
whereas the 250m image consists of two channels with wavelengths at 650nm and 859nm. It is not difficult to understand that the higher the redundancy and more wavelengths involved in the regression, the higher the correlation achieved. Increases in band dimensionality also increase the signal content.
In this study, PCA was also used and the result is listed in Table 4. The rationale of PCA is to reduce the amount of noise in the data and attempt to retain the accuracy and effectiveness for mapping the salinity and suspended solids. PCA is a scene- dependent algorithm which generates weight factors through a linear transformation. Traditionally, most of the useful data is loaded in first few PCs (eg. PC1 and PC2), whereas the noise is found in the last few PCs. In this study, PC1 achieved moderate correlation (R2=0.74) at 500m resolution and a combined PC1 &
2 performed achieved a poor correlation (R2=0.42).
The poor performance from a combination of PC1 &
2 was because some of the signals in PC2 may not be relevant to the modeling of suspended solids.
However, the PCA was not applied on 250m due to lack of band dimensionality.
In order to find the best model, four models have been selected with R2>0.6 in each regression case.
SS (mg/L) = 94.095×Band 1 _2.787 (3) SS (mg/L) = 97.085×Band 4 _5.821 (4) SS (mg/L) = -4.281 + 23.628×Band1 _15.675×
Band 2 _14.653×Band 3 + 79.251×
Band 4 + 21.303×Band 5 + 9.709×
Band 6 + 10.963×Band 7 (5) SS (mg/L) = -3.683 + 120.966×Band1 _24.282×
Band 2 (6)
RMSE results of each model are listed in Table 5. It was found that multiple regression with 500m images Table 4. Correlation coefficients using Principal component
analysis at 500m images.
Index PC1 PC2
SSS 0.01 0.07
SS 0.74 0.42
Index PC1 PC2
Table 5. RMSE on each equation.
Eq 3 Eq 4 Eq 5 Eq 6 Eq 7*
RMSE 1.24 1.01 0.92 1.45 1.63
* Salinity equation
Eq 3 Eq 4 Eq 5 Eq 6 Eq 7*
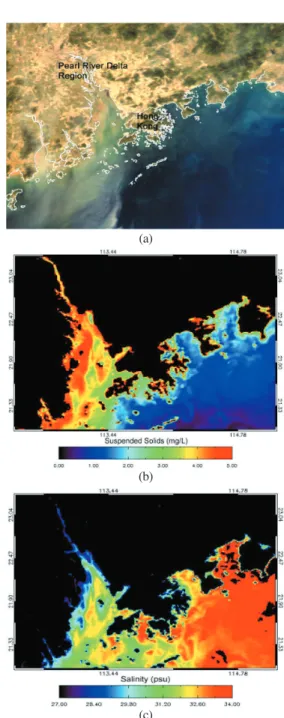
Fig. 3. a. True color MODIS 500m image (Nov 03, 2003) overlaid with coastlines b. Map of suspended solids derived from multiple regression model c. Map of salinity derived from multiple regression model.
(a)
(b)
(c)
achieved the highest correlation coefficient value of 0.82, and a moderate RMSE (RMSE = 0.92mg/L).
The results suggest that MODIS 500m images are appropriate for modeling of the suspended solids. The selected model was then applied on the MODIS 500m image acquired on Nov 3, 2003 (Fig. 3a).
Fig. 3b shows the corresponding model whereby the algorithm was interpolated over entire Hong Kong territories and PRD region. From Fig. 3b, it was observed that the western coast which is closer to the PRD, suspended solids were higher than in the eastern coast region. Approximately 4.5 mg/L was detected on the estuary of PRD region which is a relatively high value when compared with the east coast (1 mg/L). However, a plume front was observed from the model as well as the coastal fronts, which was accumulating the suspended particles near the estuary of PRD region.
2) Sea Surface Salinity (SSS)
Although there are no previous studies and references attempted to correlate salinity with MODIS reflectances, Hu et al. (2004) suggested the Colored Dissolved Organic Matter concentration (CDOM) is the only constituent with linear and inverse relationship with ocean surface salinity. It is well-known that CDOM can be mapped using MODIS images, thus, it is not surprising that ocean salinity can also be modeled using MODIS images in statistical sense. Ocean salinity is not easily observed using passive remote sensing because there is no single band which correlates highly with the ‘in-situ’
salinity data, at both 250m and 500m resolutions. The multiple regression results in Table 3 show higher coefficient of correlation at 0.81 on 500m images.
According to the degree of correlation and RMSE, multiple regression at 500m with RMSE= 1.63 psu, were selected and interpolated (Fig. 3c). It was also found that PCA was poor at modeling salinity using
MODIS 500m data (R2< 0.1).
SSS (psu) = 14.256 _240.163×Band1 _72.533×
Band 2 + 124.700×Band 3 + 191.266×
Band 4 + 36.044×Band 5 _11.117×
Band6 _39.789 × Band 7 (7) The salinity of seawater is normally around 34 to 35 psu in open ocean, where it tends to be variable in the estuary due to fresh water output, tidal fluctuation and location etc. From Fig. 3c, it can be observed that higher salinity concentration was found around the PRD estuary where freshwater is presumably pluming out from Zhujiang river which dilutes the seawater salinity. High salinity concentration was found because the increasing waste water discharges
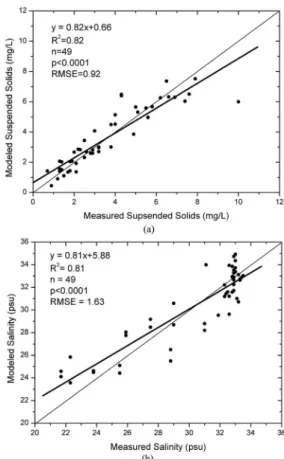
Fig. 4. Scatter plots of 49 points with modeled and ‘in-situ’
data, a. Modeled SS from multiple regression using MODIS 500m image versus ‘in-situ’ SS data, b.
Modeled SSS from multiple regression using MODIS 500m image versus ‘in-situ’ SSS data.
from industry inside PRD region which causes the increase of pollutants and COD (chemical oxygen demand) inside the fresh water.
3) Validation
MODIS-retrieved suspended solids and salinity results were compared with ‘in-situ’ measurement in order to validate the fitness of models. Fig. 4 illustrates the fitness of these two models using scattering plots with showing the RMSE, significant level and correlation coefficient. The high correlation data was found on suspended solids (Fig. 4a) whereas moderate correlation was observed on salinity (Fig.
4b). Either of the models was fulfilled with the requirement of 95% confidence interval (p<0.05).
5. Conclusion
This study attempts to model suspended solids and salinity concentrations using remote sensing images and ‘in-situ’ data. Half and quarter kilometer MODIS images were used for modeling. Significant correlations were observed between normalized MODIS 500m resolution images and ‘in-situ’ marine data using multiple regression analysis (R2= 0.81 for SSS and R2= 0.82 for SS). The validation results also showed good correlation between satellite and ‘in- situ’ measurement data (RMSE = 1.63 psu for SSS and RMSE = 0.92 mg/L for SS). It demonstrates the potential of remote sensing for water quality modeling inside the Hong Kong territories the entire Pearl River Delta region and Zhujiang river, where there is a lack of monitoring stations. Additionally, it is the first ever to map salinity concentrations over Hong Kong and PRD region based on local ‘in-situ’
data with a stated accuracy level. This may help in shaping policy decisions at the Hong Kong Environmental Department and Guangdong province
for desalinization the coastal waters. This study found the band dimensionality and spectral resolution were more important than spatial resolution where 500m images always achieved higher accuracies than 250m. Further analysis such as neural network modeling, cubic and logarithm regressions and band ratio will be evaluated in the near future.
Acknowledgements
This study was supported by the Hong Kong Polytechnic University and by the Geostationary Ocean Color Imager (GOCI) project funded by Korea Ocean Research & Development Institute (KORDI).
The authors wish to acknowledge the NASA, and the Korea Science and Engineering Foundation (KOSEF) through the Advanced Environmental Monitoring Research Center (ADEMRC) at Gwangju Institute of Science and Technology (GIST). Goddard Earth Science Distributed Active Archive Center for providing the MODIS Level IB images, and the Hong Kong Environmental Protection Department for providing the ‘in-situ’ data.
References
Barbini, R., F. Colao, L. De Dominicis, R. Fantoni, L. Fiorani, A. Palucci, and E. S. Artamonov, 2004. Analysis of simultaneous cholorophyII measurements by lidar fluorosensor, MODIS and SeaWiFS, International Journal of Remote Sensing, 25(11): 2095-2110.
Chen, X. L., Y. S. Li, Z. G. Liu, K.D. Yin, Z. L. Li, W. H. B. Wai, and W. H. King, 2004.
Integration of multi-source data for water quality classification in the Pearl River estuary and its adjacent coastal waters of
Hong Kong, Continental Shelf Research, 24:
1827-1843.
EPD, 2004. Marine water quality in Hong Kong in 2004, Annual report provided by the Hong Kong Environmental Protection Department, Hong Kong.
Hu, C., Z. Chen, T. Clayton, P. Swarnzenski, J. Brock, and F. Muller-Karger, 2004. Assessment of estuarine water-quality indicators using MODIS medium-resolution bands: Initial results from Tampa Bay, FL, Remote Sensing of Environment, 93: 423-441.
Justice, C. O., J. R. G. Townshend, E. F. Vermote, E.
Masuoka, R. E. Wolfe, N. Saleous, D. P. Roy, and J. T. Morisette, 2002. An overview of MODIS land data processing and product status, Remote Sensing of Environment, 83: 3-15.
Miller, R. L. and B. A. Mckee, 2004. Using MODIS Terra 250m imagery to map concentrations of total suspended matter in coastal waters, Remote Sensing of Environment, 93: 259-266.
Morton, B. and S. S. Wu, 1975. The hydrology of the
coastal waters of Hong Kong, Environmental Research, 10: 319-347.
Teillet, P. M., P. N. Slater, Y. Ding, R. P. Santor, R.
D. Jackson, and M. S. Moran, 1990. Three methods for absolute calibration of the NOAA AVHRR sensors in-flight, Remote sensing of Environment, 31: 105-120.
Smith, G. M. and E. J. Milton, 1999. The use of the empirical line method to calibrate remotely sensed data to reflectance, International Journal of remote sensing, 20(13): 2653- 2662.
Woodruff, D. L., R. P. Stumpf, J. A. Scope, and H.
W. Paerl, 1999. Remote estimation of water clarity in optically complex estuarine waters, Remote Sensing of Environment, 68: 41-52.
Wu, S. S., 1988. Marine pollution in Hong Kong: a review, Asian Marine Biology, 5: 1-23.
Yeung, I. M. H., 1999. Multiple analysis of the Hong Kong Victoria Harbour water quality data, Environmental Monitoring and Assessment, 59: 331-342.