240
and Safety
Available online at http://www.foodhygiene.or.kr
https://doi.org/10.13103/JFHS.2018.33.4. 240
Monitoring and Risk Assessment of Lead and Cadmium in Various Agricultural Products Collected from the Korean Market
Eun Jung Chang, Sung Hee Park, Kyung Jin Lee
1, Jee su Choe
1, and Mee hye Kim
1* Hazardous Substance Analysis Division, Gyeongin Regional Food and Drug Administration,
Ministry of Food and Drug Safety, Incheon, Korea
1
Imported Food Analysis Division, Gyeongin Regional Food and Drug Administration, Ministry of Food and Drug Safety, Incheon, Korea
(Received May 30, 2018/Revised July 17, 2018/Accepted July 13, 2018)
ABSTRACT - This study was carried out to determine the levels of lead and cadmium as found in nine agricul- tural products (n = 578) sold in Korea, and to estimate the risk to human health that is summarily associated with their intake. The concentrations of Pb and Cd were measured using an ICP-MS after microwave digestion in this study. The average contents of Pb and Cd were measured as 0.014 and 0.017 mg/kg for barley, 0.006 and 0.005 mg/kg for mung bean, 0.008 and 0.007 mg/kg for kidney bean, 0.010 and 0.004 mg/kg for green bean, 0.008 and 0.001 mg/kg for pine- apple, 0.016 and 0.002 mg/kg for apricot, 0.015 and 0.002 mg/kg for Japanese apricot, 0.021 and 0.002 mg/kg for plum and 0.019 and 0.003 mg/kg for jujube, respectively. The levels of Pb and Cd in the study samples were less than the maximum residual levels established by the European Union (EU), CODEX, and the Korea Food Code. As we have seen, the daily dietary exposures of Pb and Cd from these agricultural products for the general population were noted as 0.067% of PTWI (25 µg/kg b.w./week) and 0.28% of PTMI (25 µg/kg b.w./month), respectively. In line with the study conclusions, these results suggest that the current dietary intakes of Pb and Cd from these agricultural prod- ucts in Korea have no appreciable risk effects on health for humans as noted in this experiment.
Key words : Lead, Cadmium, Agricultural products, Risk assessment, ICP-MS
Heavy metals are not biodegradable, have long biological half-lives and have the potential for accumulation in the different body organs leading to unwanted side effects
1,2). In particular, lead (Pb) and cadmium (Cd) are the heavy metals of most concern because of their potential for toxicity or accumulation in plant and animals
3). In animals, Pb absorbed from foods or the environment is accumulated in the skeleton, especially in bone marrow. It is a neurotoxin and causes behavioral abnormalities, retarding intelligence and mental development. It interferes in the metabolism of calcium and vitamin D, affects hemoglobin formation and causes anemia. The entrance of Pb at levels > 0.8 μg/mL into blood causes various abnormalities
4-6). Cadmium is a potent human carcinogen and has been classified as a category 1 carcinogen (human carcinogen) by the Inter- national Agency for Research on Cancer and the National Toxicology Program of the USA, because of its charac- teristics as a lung carcinogen. It can also cause Itai-Itai disease, osteoporosis, non-hypertrophic emphysema and
irreversible renal tubular injury
7,8).
Lead and cadmium are significant environmental pollu- tants. Anthropogenic activities such as agriculture, industry and urban life increase the Cd and Pb content of soils and waters, thereby contributing to the contamination of raw materials
9,10). It is well known that contamination of plants with heavy metals may occur due to irrigation with con- taminated water, the addition of fertilizers and metal-based pesticides, industrial emissions, transportation, the harvesting process, and/or storage
11,12). The Cd and Pb content in food can also increase significantly through manufacturing processes and through contact with the materials used in the packaging
13). Therefore, exposure to Pb and Cd depends on dietary habits and geographical location
14). In particular, food is a major source of both Pb and Cd for the general populations
15,16).
Human beings are encouraged to consume more fruits, vegetables and cereals that are good sources of vitamins, minerals and dietary fibers which are beneficial to human health. These plants contain both essential and toxic heavy metals over a wide range of concentrations
12,17). In general, the levels of heavy metals in fruits and vegetables are very low. However, due to their high dietary intake, fruits and
*Correspondence to: Meehye Kim, Gyeongin Regional Food and Drug Administration, 137 Juan-ro, Nam-gu, Incheon 22133, Korea Tel: 82-32-450-3360, Fax: 82-32-442-4622
E-mail: [email protected]
vegetables are the main contributors to the dietary exposure of heavy metals. Keeping in the view of the potential toxicity cumulative behavior of heavy metals and the frequent consumption of fruits, vegetables and cereals, it is necessary to monitor the levels of heavy metals in these food items, to evaluate their contribution to the daily intake of the metals through risk assessment and to ensure that the levels of heavy metals meet the agreed international requirement.
Human toxicity by consuming foods contaminated with Pb and Cd has been regularly assessed by food safety au- thorities
18,19). The Joint FAO/WHO Expert Committee on Food Additives (JECFA) established provisional tolerable weekly intakes (PTWI) for Pb and Cd, the limits being 25 μg/kg body weight for Pb
4)and 7 μg/kg body weight for Cd
20). In 2009, the toxicity of Cd was reassessed by the European Food Safety Authority (EFSA) and EFSA set a reduced tolerable weekly intake (TWI) of 2.5 μg/kg body weight for Cd in food
21). Recently, JECFA decided to express the tolerable intake for Cd as a monthly value in the form of a provisional tolerable monthly intake (PTMI), owing to the exceptionally long half-life of Cd. Therefore, the PTWI for Cd of 7 μg/kg body weight was withdrawn and the PTMI for Cd of 25 μg/kg body weight, which corresponds to a daily intake of 0.8 μg/kg body weight was established by JECFA
22).
With a rather dramatic change in dietary patterns because of rapid economic development during the past three decades and the globalization of the food market, more Koreans have concerns about the safety of their diets.
Ministry of Food and Drug Safety (MFDS) has been responsible for monitoring the levels of heavy metals in raw foods and establishing the safety guidelines for Pb and Cd in individual raw foods for the past decade
23,24). This study is part of the monitoring program for heavy metals in agricultural products conducted by MFDS. In this study, we selected the nine items of agricultural products (barley, green bean, kidney bean, mung bean, pineapple, Japanese apricot, apricot, plum and jujube) which need further monitor in Korea, and investigated the levels of Pb and Cd in these agricultural products collected from the Korean market using an inductively coupled plasma mass spec- trometry (ICP-MS). Finally, based on our monitoring data and the nationally representative dietary intake data of the population, we estimated the daily dietary exposure levels of Pb and Cd associated with their intake for the Korean population and assessed their risks compared with PTWI or PTMI of JECFA.
Materials and Methods Reagents and standards
Nitric acid (65%, HNO
3) and hydrogen peroxide (H
2O
2) for sample digestion were purchased from Dongwoo Fine Chem Co. (Seoul, Korea) and Junsei Chemical Co. Ltd.
(Tokyo, Japan), respectively. Purified water (18 MΩ cm) for sample preparation was produced by the Milli-Q system (Millipore Corp., Bedford, MA, USA). All chemicals and reagents used were analytical grade unless stated otherwise.
Standard solutions of Pb and Cd were prepared daily from 1000 mg/L stock solution (Merck, Darmstadt, Germany) by serial dilution using 5% nitric acid (v/v, in water).
Sample collection
All the samples (n = 578) of barley, green bean, kidney bean, mung bean, pineapple, Japanese apricot, apricot, plum and jujube including domestic and imported agricultural products were collected from local markets in South Korea.
Collected samples were rinsed with purified water and only the edible parts of the samples were homogenized, packed in polyethylene decontaminated containers and stored at −70
oC until analysis.
Sample preparation and instrumental analysis The concentrations of Pb and Cd in all samples were measured using ICP-MS after microwave. The sample amounts for Pb and Cd analysis were 1.0 g for barley and pulses and 2.0 g for fruits. The sample was weighed into a polytetrafluoroethylene (PTFE) digestion vessel, and then 65% nitric acid and hydrogen peroxide were added. The vessels were allowed to stand at room temperature for 2 h and were placed inside the microwave oven (ETHOS PLUS, Milestone S.r.l., Sorisole, Italy). The digestion was carried out according to the manufacturer’s pre-set program. After that, the digested solutions were heated at 100
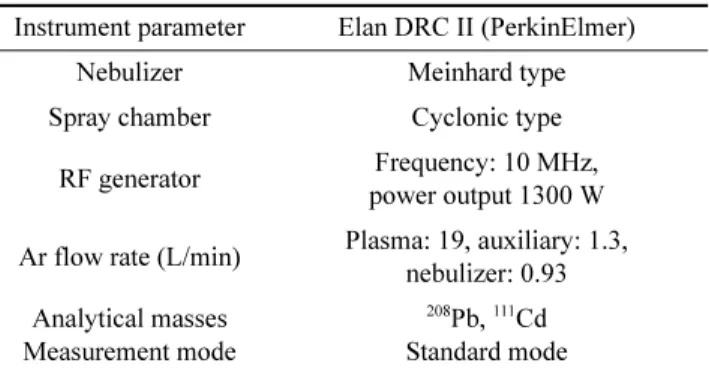
oC until dryness to remove nitric acid, then re-dissolved with 20 mL of 5% nitric acid (v/v, in water) and filtered with 0.45 μm filters (Hydrophilic PVDF Millipore Millex-HV, Millipore, Billerica, MA, USA). The instrument used for Pb and Cd analysis in this study was an ICP-MS (Elan DRC II, PerkinElmer Inc., Waltham, MA, USA) and the instrumental
Table 1. ICP-MS operating conditions
Instrument parameter Elan DRC II (PerkinElmer)
Nebulizer Meinhard type
Spray chamber Cyclonic type
RF generator Frequency: 10 MHz,
power output 1300 W Ar flow rate (L/min) Plasma: 19, auxiliary: 1.3,
nebulizer: 0.93 Analytical masses
Measurement mode
208
Pb,
111Cd
Standard mode
operating conditions are summarized in Table 1.
Analytical quality assurance (AQA) and method validation
Appropriate analytical quality assurance procedures and precautions were taken to ensure the reliability of the results.
To avoid contamination of the samples, all materials used for sample digestion and dilution were immersed in freshly prepared 15% nitric acid (v/v, in water) for 24 h, then rinsed in thoroughly purified water, and dried before use. All determinations were made in triplicate and reagent blank determinations to correct the instrument readings were performed for every batch of nine samples measured.
For validation of the analytical procedure, the accuracy and precision of the method were tested by determining two certified reference materials (CRM) of rice flour (KRISS 108-01-001, Korean Research Institute Standard and Science, Deajeon, Korea) and spinach flour (NIST 1570a, National Institute of Standard & Technology, Gaithersburg, MD, USA). A recovery test was also performed using samples spiked with Pb and Cd for accuracy and precision assess- ment. The limit of detection (LOD) and the limit of quantification (LOQ) were calculated as the concentration equivalent to three times and ten times of the standard deviation of the signal of the blank solution, respectively.
The linearity was calculated using Pb and Cd standard solutions at levels of 0.0005, 0.001, 0.0025, 0.005, 0.0075 and 0.010 mg/L (zero included).
Dietary exposure estimates and risk assessment The daily dietary exposures of Pb and Cd through the nine agricultural food items were estimated with the concen- trations of Pb and Cd investigated in this study and the amount of consumption of each food item. The food consumption data was obtained from the Korean Nutrition Survey
25)which provides food consumption data for 8,641 individuals as determined during 2008 in face-to-face inter- views using the 24h recall method. Body weight data were also obtained from the Korean Nutrition Survey (KHIDI
25),
2008). The typical body weight (55 kg) for the general adult population of 20 years and older in South Korea was used for the estimates of dietary Pb and Cd exposures. We calculated daily dietary exposure of Pb or Cd as:
For the calculation, contaminant levels below LOD were considered to be at the level of LOD/2.
For the purpose of risk assessment, the mean and 95%
percentile of daily exposure level were compared with the PTWI of 25 μg/kg body weight/week for Pb and the PTMI of 25 μg/kg body weight/month for Cd as proposed by the JECFA
22).
Results and Discussion Analytical method validation
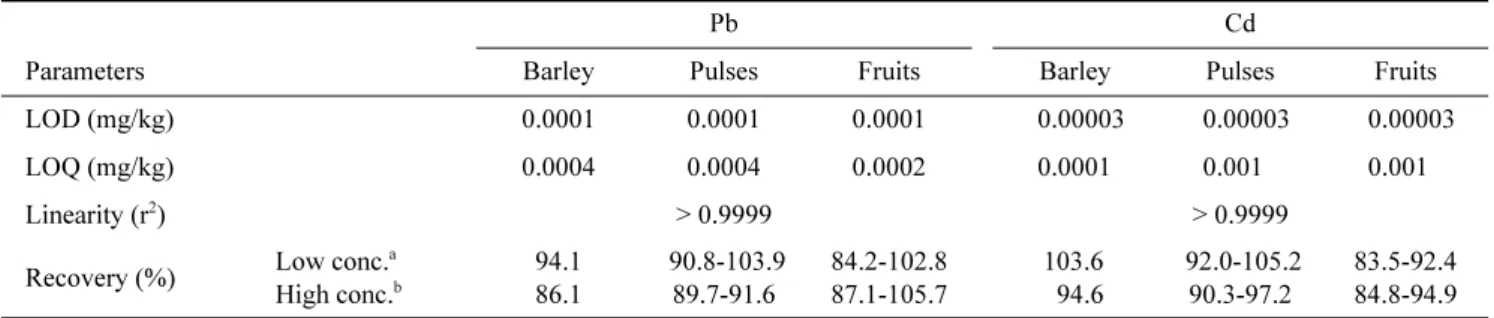
The recoveries of Pb and Cd, LOD and LOQ in the individual matrix were analyzed, and the linearity of the calibration curve was calculated (Table 2). The recovery test was carried out by spiking 0.01 and 0.1 mg/kg of Pb or Cd into samples and the recoveries ranged from 84.2% to 105.7% for Pb and 83.5% to 105.2% for Cd. The LOD and LOQ of Pb in barley and pulses were 0.0001 and 0.0004 mg/
kg and those in fruits were 0.0001 and 0.0002 mg/kg. The LOD and LOQ of Cd were 0.00003 and 0.0001 mg/kg, regardless of sample matrix. The linearity (r
2) of the cali- bration curve was above 0.9999 in both Pb and Cd.
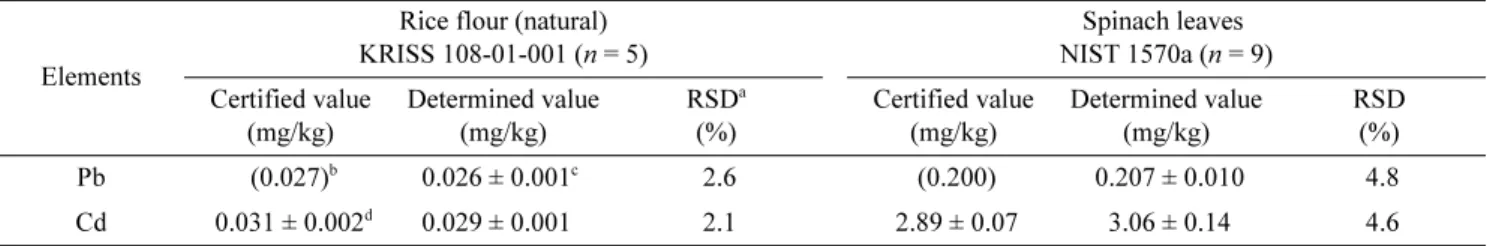
The accuracy and precision of the analytical method in this study have been checked by applying it to two CRMs.
Table 3 shows the results of the determination of Pb and Cd in two CRMs. There were not significant differences (P <
0.05) between the certified value of the CRMs and our determined value for Pb and Cd concentrations. In addition, the relative standard deviation (RSD) as a statistical measure of the precision for a series of repetitive measurements was
Daily dietary exposure =
Daily food consumption Pb or Cd concentration × Body weight
---
Table 2. Results of analytical method validation for Pb and Cd
Pb Cd
Parameters Barley Pulses Fruits Barley Pulses Fruits
LOD (mg/kg) 0.0001 0.0001 0.0001 0.00003 0.00003 0.00003
LOQ (mg/kg) 0.0004 0.0004 0.0002 0.0001 0.001 0.001
Linearity (r
2) > 0.9999 > 0.9999
Recovery (%) Low conc.
aHigh conc.
b94.1 86.1
90.8-103.9 89.7-91.6
84.2-102.8 87.1-105.7
103.6 94.6
92.0-105.2 90.3-97.2
83.5-92.4 84.8-94.9
a
Low conc. means 0.01 mg/kg spiking
b
High conc. means 0.10 mg/kg spiking
below 5%. These results indicate that the method used in this study is suitable for Pb and Cd analysis in agricultural products.
Concentrations of Pb and Cd in agricultural products The mean concentrations and ranges of Pb and Cd found in the nine items of agricultural products collected from the local markets in Korea are summarized in Table 4, and Fig.
1 and 2. The determined concentrations of Pb and Cd were expressed as mg/kg of wet weight.
The results showed that the mean levels of Pb in all samples were between 0.006 mg/kg in mung bean and 0.021 mg/kg in plum with ranges of 0.001-0.024 and 0.003-0.090 mg/kg, respectively. The levels of Pb observed in the samples covered a very wide range. In particular, the ranges of Pb levels in apricot (0.003-0.084 mg/kg), jujube (0.004- 0.076 mg/kg) and plum (0.003-0.090 mg/kg) were greater compared with the ranges for barley, pulses, Japanese apricot and pineapple. The mean Pb level in barley was
0.014 mg/kg and the mean Pb levels in pulses were from 0.006 to 0.010 mg/kg. The levels are lower than those in China of 0.031 mg/kg for cereals and 0.026 mg/kg for pulses
3), and similar to those in Australia (0.008-0.014 mg/
kg for cereals; 0.005-0.012 mg/kg for legumes and pulses)
22). Within the selected fruits, the highest mean value of Pb was noticed in plum followed by jujube, apricot, Japanese apricot and pineapple. Heavy metals of Pb and Cd are persistent environmental contaminants, which may be deposited on the surfaces exposed to the air and then absorbed into the tissues of agricultural products
26,27). Therefore, the levels of Pb in fruits which need to be peeled for eating such as pineapples, bananas and oranges may be lower than in fruits which do not necessarily need to be peeled for eating. Our results also showed that the mean value and range of Pb in pineapple were 0.008 and 0.0001- 0.034 mg/kg and were lower than in the other fruits which do not necessarily need to be peeled. These results were similar to those reported by other investigators
17,28). Table 3. Results of the determination of elements in the certified reference materials
Elements
Rice flour (natural) KRISS 108-01-001 ( n = 5)
Spinach leaves NIST 1570a ( n = 9) Certified value
(mg/kg)
Determined value (mg/kg)
RSD
a(%)
Certified value (mg/kg)
Determined value (mg/kg)
RSD (%)
Pb (0.027)
b0.026 ± 0.001
c2.6 (0.200) 0.207 ± 0.010 4.8
Cd 0.031 ± 0.002
d0.029 ± 0.001 2.1 2.89 ± 0.07 3.06 ± 0.14 4.6
a
RSD means the relative standard deviation
b
( ) means reference value
c
Determined value is expressed as mean ± standard deviation (SD)
d
Certified value is expressed as mean ± uncertainty
Table 4. Concentrations of Pb and Cd in various agricultural products Number of
samples
Pb (mg/kg) Cd (mg/kg)
Agricultural
products Minimum Maximum Mean ± SD
aMinimum Maximum Mean ± SD
Barley 72 0.006 0.045 0.014 ± 0.007 0.004 0.042 0.017 ± 0.007
Pulses
Green bean 80 0.003 0.033 0.010 ± 0.005 0.0003 0.021 0.004 ± 0.003
Kidney bean 80 0.001 0.058 0.008 ± 0.007 0.002 0.033 0.007 ± 0.005
Mung bean 53 0.001 0.024 0.006 ± 0.004 0.002 0.010 0.005 ± 0.002
Fruits
Apricot 50 0.003 0.084 0.016 ± 0.012 0.0001 0.014 0.002 ± 0.002
Japanese apricot 90 0.004 0.054 0.015 ± 0.009 ND
b0.011 0.002 ± 0.002
Jujube 50 0.004 0.076 0.019 ± 0.014 0.0004 0.013 0.003 ± 0.002
Pineapple 50 0.0001 0.034 0.008 ± 0.008 ND
b0.002 0.001 ± 0.001
Plum 53 0.003 0.090 0.021 ± 0.019 0.0001 0.005 0.002 ± 0.001
a
SD indicates standard deviation
b
ND means ‘not detected’
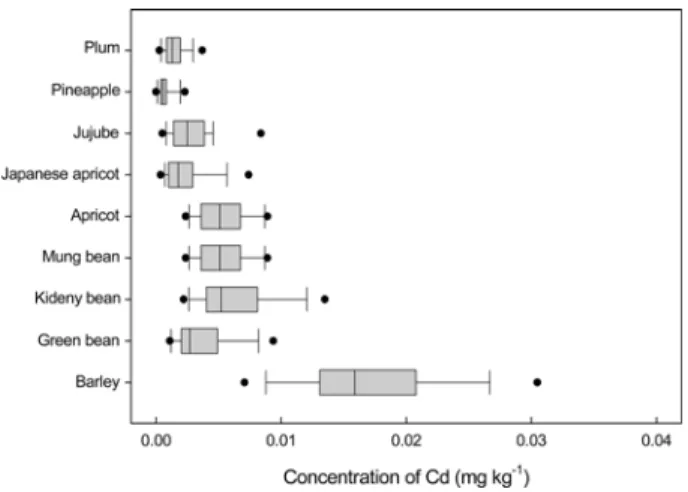
The mean levels of Cd varied from 0.001 mg/kg in pineapple to 0.017 mg/kg in barley. In particular, the mean value of Cd in barley was the highest among the nine items of agricultural products and also had the widest range (0.004-0.042 mg/kg). A similar result has been reported in a Swedish study
29). They reported that the mean value of cereal products for Cd (0.024 mg/kg) was the highest among various food groups. The mean levels of Cd estimated in pulses were 0.004-0.007 mg/kg and these values are similar to those observed by Kim et al.
30)(0.007 mg/kg in pulses).
The mean values of Cd in fruits ranged from 0.001 mg/kg to 0.003 mg/kg and are lower than those in barley and pulses. According to a report by JECFA
22), the mean level
of Cd in fruits was 0.006 mg/kg for Australia, 0.006 mg/kg for China, 0.004 mg/kg for EFSA (covering 19 European countries), 0.005 mg/kg for France and 0.003 mg/kg for USA. These results for various countries were similar to our results. The distribution of Cd levels in various Korean foods has been previously reported by Kim and Wolt
31). They reported that the average Cd concentration in shellfish (0.46 mg/kg) was the highest results and those in other foods including rice, cereals, potatoes, vegetables and fruits were about 0.02 mg/kg. Their average Cd concentrations were slightly higher than our results. This difference can be explained by the differences of species in cereals and fruits selected for monitoring
32)and a variation in Cd concen- trations in soils
33).
The levels of Pb and Cd found in 578 samples of agri- cultural products in this study were less than the maximum residual levels (MRLs) proposed by EU legislation and the CODEX Alimentarius. The MRLs for Pb by the EU and the CODEX in cereals, pulses and fruits excluding berries and other small fruits are 0.2, 0.2 and 0.1 mg/kg, respectively. In the CODEX Alimentarius, the MRLs of Cd in pulses and cereals except buckwheat, cañihua and quinoa are 0.1 mg/
kg, and the MRLs in fruits are not established. In EU legislation, the MRLs of Cd in fruits and cereals excluding germ, wheat and rice, are 0.05 and 0.1 mg/kg, and the MRL in pulses is not established
34-36).
Evaluation of dietary exposure and risk assessment For most people, the main route of exposure to toxic heavy metals is through the diet
37). Consequently, infor- mation about dietary intake is necessary in order to evaluate the potential health risks for the individual. In this study we calculated the daily intake of Pb and Cd deriving from the consumption of nine items of agricultural products and compared these with the PTWI or PTMI set by international organizations, to assess the potential health hazards for Korean people. It should be state that the purpose here is not to evaluate the total diet exposure, but rather to study the intakes of Pb and Cd from some agricultural products.
Table 5 and 6 show the daily dietary exposure and risks of Pb and Cd to the general population through the nine items of agricultural products selected in this study. The daily dietary exposure of Pb through these agricultural products was 2.4 × 10
−3μg/kg body weight on average, which corresponds to 0.067% of PTWI. The extreme dietary exposure of Pb (95
thpercentile) was 8.1 × 10
−3μg/kg body weight/day which is equal to 0.23% of PTWI. In the case of Cd, the mean and 95
thpercentiles of daily dietary exposure were 2.2 × 10
−3and 9.8 × 10
−3μg/kg body weight, which correspond to 0.28 and 1.2% of PTMI. The dietary exposure of Cd through agricultural products selected in this Fig. 1. Distribution of Pb concentration in agricultural products.
The boundary of the box indicates the 25
thand 75
thpercentiles, a line within the box marks the median, error bars indicate the 10
thand 90
thpercentiles and outlying points indicate 5
thand 95
thper- centiles.
Fig. 2. Distribution of Cd concentration in agricultural products.
The boundary of the box indicates the 25
thand 75
thpercentiles, a
line within the box marks the median, error bars indicate the 10
thand 90
thpercentiles and outlying points indicate 5
thand 95
thper-
centiles.
study was similar to that of Pb. However, the risk of dietary exposure to Cd was about four times higher than that of Pb.
This can be explained by the difference of PTWI for Pb (25 μg/kg body weight/week) and PTMI for Cd (25 μg/kg body weight/month) used in the estimation of the risk.
The main contribution to the daily exposure of Pb and Cd comes from barley. This is similar to results reported by Satarug et al.
38)and Muller et al.
39). They reported that in non-occupationally exposed individuals, vegetables and
cereals in foods are major sources of Cd. Kim and Wolt
24)also reported that because rice is commonly and highly consumed by Koreans, it was the dominant contributor to Cd in the diet, representing on average 25% of the total dietary exposure for the general population. Sun et al.
40)analyzed the contribution of food commodities to the Pb intake for the total population of Jiangsu Province, China and found that rice followed by wheat flour and bean products contributed most to the total Pb intake for both Table 5. Estimated daily dietary exposure to Pb and Cd through the consumption of agricultural products
Food intake (g) Daily dietary exposure of Pb ( µg/kg bw
a)
Daily dietary exposure of Cd ( µg/kg bw )
Agricultural products Mean 95
thpercentile Mean 95
thpercentile Mean 95
thpercentile
Barley 6.71 31.65 1.7 × 10
−38.1 × 10
−32.1 × 10
−39.8 × 10
−3Pulses
Green bean 0.39 0 7.1 × 10
−50 2.8 × 10
−50
Kidney bean 0.32 0 4.7 × 10
−50 4.1 × 10
−50
Mung bean 0.07 0 7.6 × 10
−60 6.4 × 10
−60
Fruits
Apricot 0.08 0 2.3 × 10
−50 2.9 × 10
−60
Japanese apricot 0.001 0 2.7 × 10
−70 3.6 × 10
−80
Jujube 0.08 0 2.8 × 10
−50 4.4 × 10
−60
Pineapple 0.72 0 1.1 × 10
−40 1.3 × 10
−50
Plum 1.06 0 4.1 × 10
−40 3.9 × 10
−50
Sum 2.4 × 10
−38.1 × 10
−32.2 × 10
−39.8 × 10
−3a
bw indicates body weight.
Table 6. Risk of dietary exposure to Pb and Cd through the consumption of agricultural products Risk of dietary exposure to Pb
(% of PTWI)
Risk of dietary exposure to Cd (% of PTMI)
Agricultural products Mean 95
thpercentile Mean 95
thpercentile
Barley 4.8 × 10
−22.3 × 10
−12.6 × 10
−11.2 × 10
−0Pulses
Green bean 2.0 × 10
−30 3.5 × 10
−30
Kidney bean 1.3 × 10
−30 5.1 × 10
−30
Mung bean 2.1 × 10
−40 8.0 × 10
−40
Fruits
Apricot 6.5 × 10
−40 3.6 × 10
−40
Japanese apricot 7.6 × 10
−60 4.5 × 10
−60
Jujube 7.7 × 10
−40 5.5 × 10
−40
Pineapple 2.9 × 10
−30 1.6 × 10
−30
Plum 1.1 × 10
−20 4.8 × 10
−30
Sum 0.067 0.23 0.28 1.2
children and the general population.
Acknowledgments
The authors thank the Ministry of Food and Drug Safety (R&D Project No. 10231-Food Safety-021) for financial support.
국문요약