Vol. 25, No. 8 (2015)
365
Dependency of the Critical Carbon Content of Electrical Conductivity for Carbon Powder-Filled Polymer Matrix Composites
Soon-Gi Shin †
Department of Advanced Materials Engineering, College of Samcheok, Kangwon National University, Samcheok, Gangwon-do 245-711, Korea
(Received June 14, 2015 : Revised July 13, 2015 : Accepted July 13, 2015)
Abstract
This paper investigates the dependency of the critical content for electrical conductivity of carbon powder-filled polymer matrix composites with different matrixes as a function of the carbon powder content (volume fraction) to find the break point of the relationships between the carbon powder content and the electrical conductivity. The electrical conductivity jumps by as much as ten orders of magnitude at the break point. The critical carbon powder content corresponding to the break point in electrical conductivity varies according to the matrix species and tends to increase with an increase in the surface tension of the matrix. In order to explain the dependency of the critical carbon content on the matrix species, a simple equation (Vc*= [1 + 3(γc1/2− γm1/2)2/(ΔqcR]−1) was derived under some assumptions, the most important of which was that when the interfacial excess energy introduced by particles of carbon powder into the matrix reaches a universal value (Δqc), the particles of carbon powder begin to coagulate so as to avoid any further increase in the energy and to form networks that facilitate electrical conduction. The equation well explains the dependency through surface tension, surface tensions between the particles of carbon powder.Key words
electrical conductivity, carbon powder, polymer matrix, composites, excess energy.1. Introduction
It has been known that the electrical conductivity of insulating polymer matrix composites filled with con- ducting materials, such as carbon powder or metal powder, is mainly applied dielectric materials of electronic area, discontinuously increases at some content of the con- ducting material. 1-5) This break point in the relationship between the content of conducting material and the conductivity of polymer matrix composites implies some sudden change in the dispersing state of conducting powders, i.e. the coagulation of powders to form net- works which facilitates the electrical conduction through the polymer matrix composites. The same phenomenon has been observed for ceramic matrix composites. For example, Ishida 6) studied the electrical conductivity of CaF 2 -SiC composites to present a geometrical model for the electrical conductivity in a two-phase system. The transition-like change in the electrical conductivity of these composites has attracted many researchers to
propose models for the phenomenon. 1-3) Reboul 1) and Flory 7) applied Flory’s theory for gelation taking place during polymerization of poly-functional monomers to predict the sharp increase of the electrical conductivity at the particular carbon powder contents, and Shin 5) used an averaged number of contacts of conduction powders to discuss the possibility of the network formation. These approaches are all very interesting. We have to point out, however, that the geometrical effects are too much emphasized in their models, while the thermodynamic effects are hardly taken into consideration. This makes it difficult for their models to explain why the sharp break in the conductivity change should depend on the species of matrix and conducting powders. Sircar 8) believe that the jump of the electrical conductivity is due to the tunnel effect in the thin layers of matrix sandwiched by conducting powders, but not to passing through network conduction. In the present work we are not interested in the mechanism of electrical conduction in the polymer matrix composites. It should be, however, noticed that
†
Corresponding author
E-Mail : [email protected] (S.-G. Shin, Kangwon Nat’l Univ.)
© Materials Research Society of Korea, All rights reserved.
This is an Open-Access article distributed under the terms of the Creative Commons Attribution Non-Commercial License (http://creative-
commons.org/licenses/by-nc/3.0) which permits unrestricted non-commercial use, distribution, and reproduction in any medium, provided the
original work is properly cited.
Tanioka 9) on the gas sorption by carbon powder-filled rubber matrix composites showed that the gas absorptivity of carbon powder markedly decreases near the break point of electrical conductivity. This reduction of the gas sorptivity must be due to the decrease in the sorption sites on the surfaces of carbon powders, which has been caused by the coagulation of the carbon powders.
In the present work we study experimentally the de- pendency of the critical content of carbon powder corresponding to the break point on the matrix (polymer) species, and then try to explain the result using a simple model. An excess energy due to the formation of carbon powder-polymer interfaces plays the most important role in our model. We assume that when the excess energy reaches a universal value independent of matrix species, the carbon powders begin to coagulate to form networks in the polymer matrix composites.
2. Experiment Procedure
Two kinds of matrix listed in Table 1 and carbon powder (Mitsubishi Chemical Co, 24 nm, in diameter) as filler were used. Two kinds of carbon powder were used in additional experiments for discussion of the effects of carbon powder size on the critical carbon content. Each matrix was mixed with a given amount of carbon in a roller mill for 20 minutes at temperatures shown in Table 1. Prior to the mixing, both the matrix and the carbon powder were dried at 353 K for 24 h under vacuum. A longer mixing time is effective in making the mixture uniform, whilst a shorter time must be favored to avoid matrix degradation which is more or less necessarily caused by the mechanical action of the roller mill. The fact that the polymer matrix composites thus prepared gave highly reproducible data on the conductivity implied that the almost equilibrium mixed state was achieved in them. The matrix was plasticized with a small amount of acetone and then mixed with carbon powder in the roller mill. After mixing, the acetone was removed from the mixture under vacuum. Films 1.5 mm thick were pre- pared from the matrix-carbon powder mixtures, by heat- casting followed by quenching into ice water. The tem- perature of the casting was the same as that of mixing as shown Table 1.
The electrical conductivity was measured in the thick-
ness direction of the polymer matrix composite films.
Silver paste was used to ensure good contact of the sample surface with the electrodes of the conduction tester. The electrical conductivity of the samples varied over a wide range from 10 −18 to 1 Ω −1 cm −1 . Low con- ductivity samples were measured under 2.5 kV/cm using a vibrating reed electrometer (Takedariken Co., Ltd. TR- 84M), while high conductivity samples were measured under 10 V/cm using universal tester (Sanwa Co. Ltd.
EM-1000). Prior to the measurements, all the samples were kept in a desicator with P 2 O 5 .
3. Results and Discussion
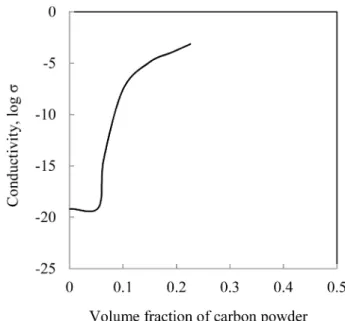
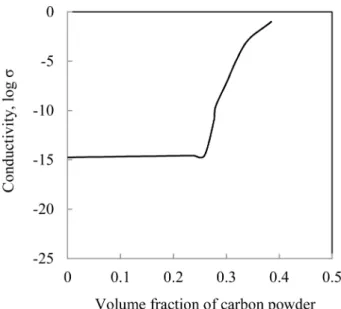
Fig. 1 and Fig. 2 show the electrical conductivity of the composites with different matrix (polystylene and nylon-6) as a function of volume fraction of carbon powder. At zero volume fractions (pure matrix), the con- ductivity varies widely: The high conductivity of nylon 6 matrix (Fig. 2) is due to the amide group. The change in the conductivity of all the composites with carbon powder addition is not monotonic: whilst the carbon powder content remains less than a value which seems to be characteristic to each matrix, the change is slight and continuous. The conductivity, however, jumps as high as 10 orders of magnitude when the carbon powder content reaches a particular value. After the transition-like in- crease, the change of conductivity again becomes mild as before. This jump of conductivity indicates that some drastic change occurs in the state of dispersion of carbon powders in matrix, i.e. the beginning of coagulation re- sulting in networks facilitating the electrical conduction.
Table 1. Matrix (polymer) and treatment temperatures used in this research.
Matrix (polymer)
Treatment temperature (K)
Remark Mixing Film casting
Polystylene 422 422 Wako Co.
Nylon 6 498 498 Mitsubishi rayon
Fig. 1. Electrical conductivity of polystylene matrix composites
filled with carbon powder as a function of carbon content.
The critical carbon powder content corresponding to the conductivity jump varies from 7 vol% for polystylene matrix to 27 vol% for nylon 6 matrix, suggesting that the polarity of matrix may relate to the critical content: The higher the polarity of a given matrix, the larger the critical carbon powder content is. This makes us expect that the critical carbon powder content must depend on the surface tension of matrix, and therefore the content (critical volume fraction) is plotted against the tension in Fig. 3. The values of the tension were from reference 10)
for two kinds of matrix, shows that the content is related to the surface tension of matrix. Then we can recognize a correlation between the surface tension of the matrix and critical carbon powder content: The larger the surface tension, the larger the critical carbon powder content is.
The results obtained above led us to conclude that the critical carbon powder content must be related with the excess energy produced in the matrix-carbon powder interface. We try to explain the relationship between the critical carbon powder content and the surface tension shown in Fig. 3, on the basic of the interfacial energy. In a carbon black-filled composites, the volume fraction (V c ) of carbon powder is defined by V c = NV o /(1 + NV o ), where N is the number of carbon powders per unit volume of matrix, and V o is the volume of a carbon powder. The addition of carbon powder to a matrix necessarily produces a matrix-carbon powder interface.
Let Δq, the interfacial excess energy produced in a unit volume of matrix, be expressed by Δq = KT, where T is the total area of the interfaces per unit volume of matrix and K is the interfacial energy per unit area of the interface. We only consider the case where K is positive, and therefore Δq is positive. T is expressed by T = PNT o , where T o is the surface area of a carbon powder, and P is a parameter indicating the state of dispersion of carbon powders: When all the carbon powders disperse isolated from others, P is equal to unity, and it decreases with coagulation of carbon powders. Thus Δq = KPNT o . We make three assumptions of I, II and III: (I). Carbon powders begin to coagulate only when Δq reaches Δq c , i.e. a particular value of the excess energy. This means that P is kept at unity before Δq reaches Δq c . Therefore Δq = KNT o (for Δq < Δq c ) and Δq c = KN c T o (at the critical point), where the critical point is that where Δq reaches Δq c , and N c is the number of carbon powder at the critical point. (II). The value of Δq c is a universal constant independent of matrix species. This together with (I) mean that carbon powders begin to coagulate at an iso-interfacial energy state of the matrix which is the expression analogous to the iso-free volume state for the glass transition point. 11-13)
Replacing N in V c = NV o /(1 + NV o ) by N c in Δq c = KN c T o gives V c * = [1 + (K/ Δq c )(T o /V o )] −1 to the critical volume fraction. For spherical powders, (T o /V o ) = 3/R. As Δq c has been assumed to be a universal constant, V c * is a function of (T o /V o ) determined by the geometry of carbon powder and of K, the interfacial energy depending on the matrix species. Then an assumption is made for K. (III).
K is given by equation K = γ c + γ m − 2(γ c · γ m ) 1/2 proposed by Fowkes, 14) where γ c and γ m are the surface tensions of carbon powder and matrix respectively.
It is well known that this relation is only reasonable for Fig. 3. Polt of the critical carbon content against the surface tension
of matrix. The dotted line shows the best-fit curve calculated by equation (1) with values of γ
m.
Fig. 2. Electrical conductivity of nylon 6 matrix composites filled
with carbon powder as a function of carbon content.
non-polar systems in which the surface tension is due to dispersion force. A relationship which is applicable to general systems inclusive of polar contribution has been studied. For example, Kitazaki 10) proposed an equation for the interfacial energy which consists of non-polar, polar and hydrogen bonding contributions, under assump- tion that the equation K = γ c + γ m − 2(γ c · γ m ) 1/2 was applic- able to each of the three contributions. It might be better to use their equation than to use equation K = γ c + γ m − 2( γ c · γ m ) 1/2 for general systems including polar contribu- tions. Nevertheless we make (III) at this time, because we are concerned at the validity of assumptions made in their equation, and also of the complication which would be caused by use of their equation. We must, however, recognize that (III), the use of equation K = γ c + γ m − 2( γ c · γ m ) 1/2 for general systems including polar contribu- tions, is so rough that it might have made our theoretical approach technological rather than scientific. Substitution of equation K = γ c + γ m − 2(γ c · γ m ) 1/2 into V c * = [1 + (K/ Δq c ) (T o /V o )] −1 gives V c * = [1 + ( γ c 1/2 − γ m 1/2 ) 2 (T o /V o )/ Δq c ] −1 . This reduces into equation (1) for spherical powders.
V c * = [1 + 3( γ c 1/2 − γ m 1/2 ) 2 /( Δq c R] −1 (1) In these equations V c * is a unique function of γ m , the surface tension of a given matrix, when carbon powders of the same size and quality are used, because of the constant γ c and (T o /V o ) or R. The critical content values, V c * , obtained above were analyzed by equation (1):
Simultaneous equations which were a function of Δq * and γ c were made by substituting the experimental values of V c * and γ m by Kitazaki 10) and 27 nm for R into equation (1). The calculation of the equations showed that 5.5 × 10 −2 N/m for γ c and 2.1 × 10 5 J/m 3 for Δq c gave the best fit between observed and calculated γ m − V c *
relation. The dotted line in Fig. 3 shows the relation of equation (1) with these constants for γ c and Δq c . It may be reasonable to consider that the state of carbon powder dispersion is determined during mixing or film casting.
This means that γ m in the above equations should be that at mixing or film casting temperature. We, however, used the values at room temperature, for no data at high temperature were available. The dotted line in Fig. 3 seem to explain satisfactorily the experimental γ m − V c *
relation.
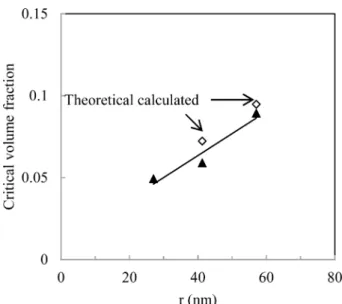
Equation (1) and [1 + ( γ c 1/2 − γ m 1/2 ) 2 (T o /V o )/ Δq c ] −1 expect that the value of V c * increases with the increase in R the diameter of spherical powders, or in (V o /T o ) the ratio of volume to the surface area of powders of any shape. In order to examine the validity of the equations, the effect of R on the value of V c * was studied for polystylene and nylon 6, using 41 nm and 56 nm carbon powders add- itionally to 27 nm powder which has been used so far.
The jump of the electrical conductivity was observed in all these polymer matrix composites, and the V c * was estimated for each matrix as a function of the powder diameter. On the other hand, the V c * values for these carbon powders were calculated by equation (1) with the same constants as those determined above for 27 nm powder, as a function of the diameter. Both calculated and measured values of V c * are plotted against the diameter of carbon powder in Fig. 4 and Fig. 5 with the exception that only the measured values are shown for 27 nm powders. The calculated values for the 27 nm particles are necessarily equal to the observed values, for the constants in equation (1) have been chosen for 27 nm Fig. 4. Critical carbon content as a function of the diameter of the carbon powder for polystylene matrix composites.
Fig. 5. Critical carbon content as a function of the diameter of the
carbon powder for nylon 6 matrix composites.
data. The measured V c * values increase with increasing diameter of the carbon powder, as it expected diameter from equation (1), and the difference between the mea- sured and calculated V c * values is not large. This seems to indicate that the equation for V c * derived above may be valid for these non-polar matrix with comparatively small surface tension. On the other hand, the following values of V c * were obtained for nylon 6: 0.26 for the 27 nm powder, 0.20 for the 41 nm powder and 0.22 for the 56 nm powder. It is difficult to find any systematic change of V c * with powder size in this case, which seems to imply that the equation might not be valid. However, we have to think of the property of these equations relating to the value of γ c . They indicate that when the difference between the values of γ c and γ m is small, as is the case for nylon 6, even a small change in γ c value causes a large change in the value of V c * . This means that the application of the equations to the case where the value of γ m is close to that of γ c should be avoided. It may be reasonable to assume that the three carbon powders different in their size were different also in their surface energy more or less, and that this is the reason why no systematic change in the V c * value with the change in the powder size was measured in the case of nylon 6.
Our interest has been so far concentrated on the critical point at which carbon powders would begin to coagulate.
We now consider what would happen after the critical point. It may be reasonable to consider that the (I) implies that the interfacial energy would be kept at Δq c
in the composites with more carbon powder than V c * as schematically shown by the dotted line in Fig. 3. There- fore Δq c = KPNT o or PN = N c (for N > N c ). In this ex- pression Δq c is the upper limit of the interfacial energy which all matrix can have commonly.
4. Conclusions
The dependency of critical content for electrical con- ductivity (break point) of carbon powder-filled polymer matrix composites with different matrix was studied as a function of carbon content to find a break point of the relationships between the carbon powder content and the
electrical conductivity. The electrical conductivity jumps by as much as 10 orders of magnitude at the break point.
The critical carbon powder content corresponding to the break point varies depending on the polymer species and tends to increase with the increase in the surface tension of matrix. In order to explain the dependency of the critical carbon powder content (V c * ) on the polymer species, a simple equation, V c * = [1 + 3( γ c 1/2 − γ m 1/2 ) 2 /( Δq c R] −1 was derived under three assumptions, the most important of which was that when the interfacial excess energy intro- duced by particles of carbon powder into the polymer reaches a universal value. The equation well explains the dependency through surface tension, as long as the difference of the surface tensions between the particles of carbon powder and the polymer is not very small.
References
1. J. P. Reboul, Carbon Black-Polymer Composites, p. 80- 120, Marcel Dekker, New York (1982).
2. Y. Song, T. W. Noh, S. I. Lee and J. R. Gaines, Phys.
Rev. B, 33, 904 (1986).
3. I. Balberg, Phys. Lett., 59, 1305 (1987).
4. S. G. Shin, Kor. J. Met. Mater., 48(9), 867 (2010).
5. S. G. Shin, Electron. Mater. Lett., 6(2), 65 (2010).
6. A. Ishida, M. Miyayama, A. Kishimoto and H. Yanagida, J. Ceram. Soc. Jpn., 103, 6 (1995).
7. P. J. Flory, Principles of Polymers Chemistry, Connell Univ. Press, Chap. 9 (1953).
8. A. K. Sircar and T. G. Lamond, Rubber Chem. Tech., 50, 735 (1977).
9. A. Tanioka, K. Miyasaka and K. Ishikawa, J. Polymer.
Sci. (eds., Polymer. Phys.), 883 (1982).
10. Y. Kitazaki and T. Hata, J. Adhesion Soc. Jpn. 8, 131 (1973).
11. M. L. Williams, R. F. Landel and J. Ferry, J. Amer.
Chem. Soc., 77, 3701 (1955).
12. M. J. Kim and J. B. Yoo, Electron Mater. Lett., 4, 57 (2008).
13. S. W. Kim, W. S. Chung, K. -S. Sohn, C. -Y. Son and S. Lee, Kor. Inst. Met. Mater., 47, 50 (2009).
14. F. M. Fowkes, Ind. Eng. Chem., 56, 40 (1964).