Research Report
FT-IR 스펙트럼 데이터의 다변량 통계분석을 이용한 고기능성 아프리칸 얌 식별 및 기능성 성분 함량 예측 모델링
송승엽1,2, 지은이1, 안명숙1, 김동진3, 김인중2,4*, 김석원5*
1한국생명공학연구원 그린바이오연구센터
2제주대학교 일반대학원 생명공학과
3탄자니아 넬슨만델라 아프리카과학기술원 생명공학대학
4제주대학교 아열대농업생명과학연구소
5한국생명공학연구원 미생물자원센터
Discrimination of African Yams Containing High Functional Compounds Using FT-IR Fingerprinting Combined by Multivariate Analysis and Quantitative Prediction of Functional Compounds by PLS Regression Modeling
Seung Yeob Song
1,2, Eun Yee Jie
1, Myung Suk Ahn
1, Dong Jin Kim
3, In-Jung Kim
2,4*, and Suk Weon Kim
5*1
Greenbio Research Center, Korea Research Institute of Bioscience and Biotechnology, Daejeon 305-806, Korea
2
Faculty of Biotechnology, College of Applied Life Sciences, Jeju National University, Jeju 690-756, Korea
3
School of Life Sciences and Bioengineering, The Nelson Mandela African Institute of Science and Technology, P.O. Box 447 Arusha, Tanzania
4
Research Institute for Subtropical Agriculture and Biotechnology, Jeju National University, Jeju 690-756, Korea
5
Microbiological Resource Center, Korea Research Institute of Bioscience and Biotechnology, Daejeon 305-806, Korea
Abstract: We established a high throughput screening system of African yam tuber lines which contain high contents of total carotenoids, flavonoids, and phenolic compounds using ultraviolet-visible (UV-VIS) spectroscopy and Fourier transform infrared (FT-IR) spectroscopy in combination with multivariate analysis. The total carotenoids contents from 62 African yam tubers varied from 0.01 to 0.91 μg・g
-1dry weight (wt). The total flavonoids and phenolic compounds also varied from 12.9 to 229 μg・g
-1and from 0.29 to 5.2 mg・g
-1dry wt. FT-IR spectra confirmed typical spectral differences between the frequency regions of 1,700-1,500, 1,500-1,300 and 1,100-950 cm
-1, respectively. These spectral regions were reflecting the quantitative and qualitative variations of amide I, II from amino acids and proteins (1,700-1,500 cm
-1), phosphodiester groups from nucleic acid and phospholipid (1,500-1,300 cm
-1) and carbohydrate compounds (1,100-950 cm
-1). Principal component analysis (PCA) and subsequent partial least square- discriminant analysis (PLS-DA) were able to discriminate the 62 African yam tuber lines into three separate clusters corresponding to their taxonomic relationship. The quantitative prediction modeling of total carotenoids, flavonoids, and phenolic compounds from African yam tuber lines were established using partial least square regression algorithm from FT-IR spectra. The regression coefficients (R
2) between predicted values and estimated values of total carotenoids, flavonoids and phenolic compounds were 0.83, 0.86, and 0.72, respectively. These results showed that quantitative predictions of total carotenoids, flavonoids, and phenolic compounds were possible from FT-IR spectra of African yam tuber lines with higher accuracy. Therefore we suggested that quantitative prediction system established in this study could be applied as a rapid selection tool for high yielding African yam lines.
Additional key words: carotenoid, flavonoid, partial least squares regression, phenolics compound, principal component analysis, UV-VIS spectrophotometer
*Corresponding author: [email protected], [email protected]
※ Received 3 July 2013; Revised 17 September 2013; Accepted 1 October 2013. 본 연구는 한국연구재단 한아프리카 협력기반조성사업(2011- 0030880)과 농림수산식품부 수출전략기술개발사업, 2012년도 정부(교육과학기술부)의 재원으로 한국연구재단의 대학중점연구소 지원사업으로 수행된 연구임(No. 2012048080 & 2010-0007627).
Ⓒ 2014 Korean Society for Horticultural Science
서 언
아프리칸 얌은 주로 아프리카 지역에서 재배되고 있는 다 년생작물로, 카사바, 감자, 고구마와 같이 전분 함량이 높아 중요한 식량자원으로 이용되고 있다. 얌의 구근은 전분질 15-20%, 단백질 1-1.5%, 지질 1% 및 기타 미네랄 및 비타민 등을 함유하고 있다(Adeleke, 2010; Kwon et al., 2010). 또한 얌의 구근에는 다양한 약리적 활성을 갖는 유용 기능성물질, saponin, tannin, sitosterol, diosgenin, carotenoid, flavonoid, polyphenol, allantoin, araginine, mucin 등을 함유하고 있어 약용작물로서 활용 가치가 매우 높은 식물이다(Kim et al., 2009; Kum et al., 2006; Kwon et al., 2010). 특히 얌의 구근 에 존재하는 다양한 페놀성 화합물들은 자유 라디칼 제거, 항산화 효과 및 항염증 작용 등 다양한 약리적 기능을 가지 고 있다(Yang et al., 2009; Yao et al., 2004). 따라서 얌은 자양, 강장, 폐결핵, 고혈압, 당뇨병, 스트레스와 피로 회복 에 효능이 알려져 있다(Song et al., 2010; Yoon et al., 1989).
이처럼 아프리칸 얌은 식용 및 약용작물로서 가치가 높은 작물이지만 주요 성분에 대한 정확한 분석이 활발하게 이루 어지지 않고 있다. Im et al.(1995)은 아프리칸 얌의 경우 사 포닌, 알칼로이드, 페놀성 성분이 국내산 얌에 비해 높아서 보다 쓴맛이 강하다고 보고하였다. 따라서 식량 및 약리적 측면에서 우수한 아프리카 얌의 농업적 활용 기반 구축을 위해 다양한 아프리카산 얌의 기능성 성분 분석이 이루어져 야 할 것으로 사료된다. 아울러 기능성 성분분석 데이터를 기반으로 고기능성 얌 라인의 신속한 선발시스템 확립이 이 루어져야 할 것으로 사료된다.
유용 기능성 물질들의 정량 및 정성분석은 주로 gas chro- matography(GC)나 high performance liquid chromatography (HPLC) 및 질량분석기와 연계를 통해 정확한 성분의 정량 및 정성 분석이 이루어진다(Aktumsek et al., 2013; Kimura et al., 2002). 그러나 이러한 분획 컬럼을 통한 기능성 성분 정량 분석의 경우 분석 결과는 매우 정확하지만, 상대적으 로 시료의 준비과정이 복잡하며, 추출 및 시료 분석 비용이 많이 소요되고, 다수의 시료를 분석할 경우 많은 시간이 요 구되는 한계점을 가지고 있다(Yuan et al., 2013). 이러한 정 량 및 정성분석의 복잡성 문제를 해결하기 위한 하나의 대 안으로 ultraviolet-visible(UV-VIS) spectrophotometer를 이 용한 기능성 성분들의 신속한 함량 조사가 가능함이 보고되 고 있다(Kofalvi and Nassuth, 1995; Stadnik and Buchenauer, 2000; Zhishen et al., 1999).
최근 오믹스 연구기법의 발달에 힘입어, 대사체 수준에서 시료간의 양적, 질적 패턴 차이를 구명하는 대사체학 연구 가 활발하게 이루어지고 있다. 대사체 연구는 주로 Fourier transform infrared(FT-IR) spectroscopy, proton nuclear magnetic resonance(HNMR) spectroscopy 및 mass spectrometry(MS) 등의 분석 데이터를 이용하여 진행되고 있으며 각종 시료의 식별 및 대사체 마커 개발에 활용이 되고 있다(Krishnan et al., 2005). 특히, FT-IR 분석 방법은 스펙트럼이 가지고 있 는 다양한 정보를 다변량통계분석을 이용하여 신속하고 정 확하게 구분할 수 있다(Gallardo-Velázquez et al., 2009). 따 라서 대사체체 기은법 대사성분의 작용기작 구명 등 기초학 문적 활용은 물론 농산물의 품종, 원산지, 재배연령, 진위 식별, 식품이나 의약품 산업의 표준화 및 안정성 관련 다양한 활용이 가능하다. 대사체 분석데이터로부터 보다 유용한 생 물학적 정보를 추출하기 위하여 다양한 다변량통계분석 기법 이 필수적으로 동반되고 있다. 이중에서 대표적인 다변량통 계분석기법중 하나인 partial least squares(PLS) regression 은 시료로부터 정확한 정량분석 데이터와 동일시료의 스펙 트럼 데이터의 상관분석을 통해 다양한 성분들의 함량 예측 모델링 방법으로 활용이 이루어지고 있다(Bastiena et al., 2005; Höskuldsson, 1988; Mevik and Wehrens, 2007; Wold et al., 2001). 최근에는 PLS regression 기법을 이용하여 동 백나무속 식물(Camellia oleifera)에서 지방산 함량 예측 모 델링(Yuan et al., 2013), 사과, 오렌지 그리고 복숭아 주스에 함유되어 있는 carotenoid 성분 함량 예측 모델링(Leopold et al., 2011), 버섯에 존재하는 단당류와 다당류 함량 예측 모델링(Chen et al., 2012), 육류의 부패 및 손상에 대한 예측 모델링(Argyri et al., 2013)이 가능한 것으로 보고되고 있으 며 예측정확도 또한 매우 높아 산업적 활용 측면에서 실용 화 가능성이 매우 높아지고 있는 실정이다.
따라서 본 연구에서는 FT-IR 스펙트럼 데이터의 다변량 통계분석 기법을 이용하여 아프리칸 얌의 신속한 구분 및 식별체계를 확립하고 더 나아가 아프리칸 얌의 구근에 존재 하는 total carotenoids, flavonoids, phenolic compounds의 신 속한 함량예측 모델링을 개발하여 기능성 성분이 우수한 아 프리칸 얌의 신속한 선발체계를 확립하고자 하였다.
재료 및 방법
식물재료
본 연구에 사용된 아프리칸 얌(Dioscorea)은 탄자니아 넬
Table 1. Quantitative analysis of total carotenoids, flavonoids and phenolic contents from African yam tubers using UV-VIS spectrophotometric analysis. All samples were run in three replicates.
Species Number
of lines
Compound contents Total carotenoids
(μg・g
-1dry w t) Total flavonoids
(μg・g
-1dry w t) Total phenolic compounds (mg・g
-1dry w t)
D. alata 15 0.09 ± 0.05 43.87 ± 19.53 2.01 ± 1.44
D. rotundata 12 0.26 ± 0.16 58.60 ± 20.85 1.20 ± 0.51
D. dumetorum 13 0.53 ± 0.17 170.97 ± 45.26 3.56 ± 1.32
D. cayenesis 5 0.20 ± 0.01 45.81 ± 25.54 1.86 ± 1.67
D. mangenotiana 1 0.73 41.94 1.83
D. prahensilis 2 0.60 ± 0.14 54.84 ± 4.56 1.87 ± 0.78
D. bulbifera 6 0.61 ± 0.22 85.48 ± 36.14 1.73 ± 0.99
Dioscorea spp. 8 0.15 ± 0.05 76.61 ± 35.03 1.58 ± 0.77
Data represent the mean ± SD of measurements.
슨만델라 아프리카과학기술원 생명공학대학으로부터 제공 받은 아프리칸 얌 구근을 사용하였다. 실험에 사용된 각각 의 얌 라인은 Dioscorea alata 15라인, D. bulbifera 6라인, D. cayensis 5라인, D. dumetorum 13라인, D. rotunalata 12 라인, D. mangenotiana 1라인, D. prahensilis 2라인 그리고 분류학적 동정이 이루어지지 않은 케냐의 얌 시료 8라인 등 총 62라인을 사용하였다(Table 1). 건조된 아프리칸 얌 구근 은 막자와 막자사발을 이용하여 미세한 분말로 분쇄하였으 며 -70°C 초저온냉동고에 보관하면서 실험에 사용하였다.
UV-VIS Spectrophotometer를 이용한 Chlorophyll a, b/Carotenoids 측정
아프리칸 얌으로부터 total carotenoids 함량은 Yang et al.
(1998)의 방법을 이용하여 UV-VIS spectrophotometer(DU®730, BECKMAN COULTER, Brea, CA, America)를 통해 조사 하였다. 아프리칸 얌 분말 시료 20mg을 80% acetone 1mL이 들어있는 tube에 넣어주고 용매와 잘 섞이도록 흔들어 주었 다. 용매와 잘 섞인 시료를 상온에서 13,000rpm으로 5분간 원심분리 하였다. 원심분리가 끝난 후 시료의 상징액을 새로 운 tube에 옮겨 주었다. 새로운 tube에 옮겨진 추출물을 흡 광도가 0.3-0.85이 되도록 희석하였고, 350-750nm 측정범위 에서 > 2nm 간격으로 UV-VIS spectrophotometer를 이용하 여 흡광도를 측정하였다. 측정된 흡광도로부터 Lichtenthaler Lichtenthaler and Buschmann(2001)의 방법을 이용하여 아 프리칸 얌 시료로부터 total carotenoids 함량을 조사하였고 함량계산식은 다음과 같다.
Ca (μg・L-1) = 12.25*A663-2.79*A647 Cb (μg・L-1) = 21.50*A647-5.1*A663
C(x+c) (μg・L-1) = (1000*A470-1.82*Ca-85.02*Cb)/198
함량계산식에 사용된 Ca는 chlorophyll a, Cb는 chlorophyll b를 나타낸다. 또한, C(x+c)에서 x+c는 xanthophylls와 carotenes 의 합을 total carotenoids 함량을 나타낸다. 측정된 값은 ANOVA를 이용하여 유의성을 판별하였다.
UV-VIS Spectrophotometer을 이용한 Total Flavonoids 측정
아프리칸 얌으로부터 total flavonoids 함량은 Zhishen et al.(1999)의 방법을 이용하여 UV-VIS spectrophotometer를 통해 조사하였다. 아프리칸 얌 시료 10mg을 absolute ethanol 1mL 들어가 있는 tube에 넣어주었다. 용매와 잘 섞이도록 흔들어준 후 1시간 동안 상온에서 반응 시켰다. 반응이 끝난 시료를 상온에서 13,000rpm으로 5분간 원심분리하고, 원심 분리가 끝난 시료의 상징액 100μL를 새로운 tube에 옮겼다.
옮겨진 시료 100μL에 2차 증류수 400μL를 첨가하여 혼합한 다음 5% NaNO2 30μL를 첨가하여 상온에서 10분간 반응시 켰다. 10분간 반응이 끝난 후 10% AlCl3 용액 30μL를 첨가 하여 상온에서 다시 1분간 반응시켰다. 반응이 끝난 후 1M NaOH 200μL를 첨가하여 반응액의 최종 부피가 1mL가 되도 록 2차 증류수 240μL를 첨가하였다. 준비된 시료는 UV-VIS spectrophotometer를 이용하여 510nm 파장에서 흡광도를 측 정하였다. Reference compounds로는 catechin(100mg・L-1)을
사용하여 조사하여 total flavonoids 함량을 측정하였다. 측정 된 값은 ANOVA를 이용하여 유의성을 판별하였다.
UV-VIS Sspectrophotometer을 이용한 Total Phenolics 함량 측정
아프리칸 얌으로부터 total phenolics compounds 함량은 Wu et al.(2007)의 방법을 이용하여 UV-VIS spectrophotometer 를 통해 조사하였다. 아프리칸 얌 시료 10mg을 80% ethanol 50μL가 들어가 있는 tube에 넣어주었다. 용매와 잘 섞이도록 흔들어준 후 95°C에서 5분간 가열하여 추출하였다. 추출된 시료는 상온에서 12,000rpm으로 15분간 원심분리하고, 원심 분리가 끝난 시료의 상징액 20μL를 새로운 tube에 옮겼다.
옮겨진 추출물 20μL에 2N Folin-Ciocalteu reagent 50μL와 20% Na2CO3 100μL를 첨가하고 최종 부피가 1mL가 되게 2 차 증류수 830μL를 첨가하여 준비하였다. Control로 사용될 용액은 2차 증류수 850μL에 2N Folin-Ciocalteu reagent 50μL 와 20% Na2CO3 100μL를 첨가하고 최종 부피가 1mL가 되게 준비하였다. 표준물질은 20μL ethanol이 포함된 chlorogenic acid에 2N Folin-Ciocalteu reagent 50μL와 20% Na2CO3 100 μL를 첨가하고 최종 부피가 1mL가 되도록 2차 증류수 830μL 를 첨가하여 부피를 조정하였다. 준비된 시료는 상온에서 20분간 반응 시킨 후에 UV-VIS spectrophotometer를 이용 하여 725nm 파장에서 흡광도를 조사하였다. 측정된 값은 ANOVA를 이용하여 유의성을 판별하였다.
FT-IR 스펙트럼 조사 및 스펙트럼 데이터 다변량 통계분석 아프리칸 얌 62개의 구근 분말 20mg을 tube에 넣고 20%
methanol 용액을 200μL씩 첨가하여 잘 섞어주었다. 각 tube 를 50°C 수조에서 20분간 반응시킨 다음 13,000rpm에서 15 분간 원심분리한 후 상징액을 새로운 tube에 옮겼다. 회수한 상징액은 원심분리과정을 반복하여 찌꺼기가 들어가지 않 도록 조심스럽게 새로운 tube에 상징액을 옮겼다. 회수된 상 징액은 -20°C에서 보관한 다음 FT-IR 스펙트럼 조사에 사용 하였다.
FT-IR(Fourier transform infrared) 스펙트럼 조사는 Tensor 27(Bruker Optics GmbH, Ettlingen, Germany)를 사용하였 고, DTGS(deuterated triglycine sulfate) 검출기로 분석하였 다. 추출된 각각의 시료 5μL를 384-well ZnSe plate에 분주 하여, 37°C hot plate에서 약 20분간 건조하였다. 건조된 ZnSe plate는 Tensor 27에 장착된 HTS-XT(Bruker Optics GmbH) 고효율 자동화 장치를 이용하여 스펙트럼을 조사하
였다. 각 시료의 스펙트럼은 총 4,000-400cm-1범위에서 그 리고 4cm-1 간격으로 총 128회 반복 측정된 평균 스펙트럼 을 분석에 사용되었다. 각 시료의 FT-IR 스펙트럼은 통계적 분석을 위해 각각 3반복 측정하였다. FT-IR 스펙트럼 조사 및 데이터 변환에 사용된 프로그램은 Bruker에서 제공하는 OPUS Lab(ver. 6.5, Bruker Optics Inc.)를 사용하였다. FT-IR 스펙트럼 데이터의 다변량 통계분석을 위해 먼저 FT-IR 스펙트럼 데이터의 baseline 교정, normalization 및 mean centering 등 스펙트럼의 전처리 과정을 R 프로그램(version 2.15.0, Auckland, New Zealand)을 이용하여 수행하였다.
Baseline 교정을 위해 FT-IR 스펙트럼 분석 영역의 양 끝점 (1,800-800cm-1)의 흡광도를 0으로 조정하였으며 실험상의 오차를 최소화하기 위하여 각 스펙트럼을 동일 면적으로 normalization 하였다. 이후 데이터의 mean centering 과정을 거쳐 2차 미분을 수행한 다음 전처리가 완료된 스펙트럼 데 이터를 다변량 통계분석 분석을 위한 표준화된 데이터로 사 용하였다. 가공된 FT-IR 스펙트럼 데이터는 NIPALS 알고 리즘(Wold, 1966)을 이용하여 R 프로그램(version 2.15.0)에 서 PCA(Principal component analysis)와 PLS-DA(Partial least square discriminant analysis) 분석(Fiehn et al., 2000; Trygg et al., 2007)을 수행하였다.
아프리칸 얌 구근으로부터 Total Carotenoids, Flavonoids 및 Phenolics 함량 예측 PLS 모델링
아프리칸 얌 구근의 FT-IR 스펙트럼 데이터로부터 total carotenoids, flavonoids, phenolics 함량 예측 모델을 개발하였 다. 총 62개 아프리칸 얌 시료의 FT-IR 스펙트럼 데이터와 동 일 시료로부터 얻어진 total carotenoids, flavonoids, phenolics 함량 실측 정량 데이터를 이용하여 X 변수에는 FT-IR 스펙트럼 데이터를 사용하였고, 3개의 Y 변수에는 UV-VIS spectrophoto- meter를 통해 얻어진 total carotenoids, flavonoids, phenolics 함량 정량 데이터를 각각 사용하였다. PLSR(partial least square regression) 분석은 R 프로그램(version 2.15.0)을 이용하였 다. 예측 모델링의 정확도를 향상시키기 위하여 1개의 X 변 수에 대해 3개의 Y 변수를 각각 교차검정을 실시하였다. 확 립된 예측 모델링을 이용하여 각각의 아프리칸 얌 시료의 total carotenoids, flavonoids 및 phenolics 함량 예측을 수해하였 다. 함량 예측 모델링의 정확도를 조사하기 위하여 아프리 칸 얌 시료로부터 total carotenoids, flavonoids 및 phenolics 함량 실측치와 예측치에 대한 선형회귀분석을 수행하여 상 관계수를 조사하였다.
Fig. 1. Representative FT-IR spectral from African yam tubers.
FT-IR spectral ranges showed quantitative information of protein/amide I, II (1500-1700 cm
-1), phosphodiester group (1300-1500 cm
-1), and sugar compound (950-1100 cm
-1).
Solid or dotted lines and abbreviations represent each African yam species. D. ata: Dioscorea alata; D. dum: Dioscorea dumetorum; D. bul: Dioscorea bulbifera; D. spp: Dioscorea spp. Arrows indicate the FT-IR regions showing significant spectral variations between African yam samples.
결과 및 고찰
아프리칸 얌 구근으로부터 Total Carotenoids, Flavonoids 및 Phenolics 함량 조사
UV-VIS spectrophotometer를 이용하여 아프리칸 얌 구근 에 존재하는 total carotenoids, flavonoids 및 phenolics 함량 을 조사하였다(Table 1). 여러 아프리칸 얌 종들에 대한 각 각의 성분에 대한 유의한 차이를 보이는지를 ANOVA 프로 그램을 통해 평가한 결과 유의성(P < 0.05)이 있는 차이를 보였다. Total carotenoids 함량은 D. bulbifera가 0.61μg・g-1 dry weight(wt)로 아프리칸 얌 종 가운데서 가장 높았으며 다음으로 D. prahensilis 및 D. dumetorum이 각각 0.59 및 0.53μg・g-1 dry wt로 나타나 total carotenoids 함량이 높은 종임을 알 수 있었다. 반면에 D. alata와 D. cayensis는 다른 아프리칸 얌 종들에 비해 total carotenoids 함량이 낮은 종임 을 알 수 있었다(Table 1). Total flavonoids 함량의 경우, D.
dumetorum이 171μg・g-1 dry wt으로 가장 함량이 높은 종으 로 나타났으며, D. bulbifera 가 다음으로 total flavonoids 함 량이 높은 종임을 알 수 있었다. 아직까지 정확한 종의 동정 이 이루어지지 않은 시료인 Dioscorea spp의 경우 비교적 total flavonoids 함량이 높은 종임을 알 수 있었다(Table 1).
D. alata와 D. cayensis는 carotenoids의 함량분석 결과와 마찬 가지로 total flavonoids 함량이 가장 낮은 종으로 나타났다.
Total phenolic 함량의 경우 D. dumetorum이 3.56mg・g-1 dry wt 로 가장 높은 종이며, carotenoids와 flavonoids 함량이 낮았 던 D. alata가 다른 아프리칸 얌 종들에 비해 함량이 높음을 알 수 있었다(Table 1). 아프리칸 얌 시료의 기능성 성분 정 량분석 결과를 보면, total flavonoids와 phenolics 함량에 비 해 total carotenoids 함량이 낮게 나타났으며, total flavonoids 와 phenolics 함량은 각각의 아프리칸 얌 종들 사이에 함량 차 이가 매우 크게 나타남을 알 수 있었다(Table 1). 이 결과는 Yang et al.(2009)이 얌에 존재하는 total carotenoids, flavonoids, phenolics 함량 등 기능성 성분들의 경우 종에 따라서 질적 차이는 물론 양적 차이가 매우 크다는 보고와 일치한다.
아프리칸 얌 시료의 FT-IR 스펙트럼 비교분석
아프리칸 얌 시료로부터 전세포 추출물의 FT-IR 스펙트 럼 데이터 다변량통계분석을 통해 아프리칸 얌의 대사체 수 준에서 종간 유연관계 구명 및 식별체계를 확립하였다. 각 아프리칸 얌 시료의 FT-IR 스펙트럼을 비교한 결과 아프리 칸 얌 시료들은 FT-IR 스펙트럼상의 1,700-1,500, 1,500-1,300,
1,100-950cm-1 부위에서 대사체의 양적, 질적 패턴 변화가 크게 이루어짐을 알 수 있었다(Fig. 1). FT-IR 스펙트럼의 1,700-1,500, 1,500-1,300 그리고 1,100-950cm-1부위는 각각 아미노산 및 단백질의 amide bond I과 II, 핵산 및 인지질로 부터 phosphodiester bond 및 인을 포함하는 유기산, 그리고 단당류나 복합 다당류를 포함하는 carbohydrates 계열의 화 합물들의 질적, 양적 정보를 반영한다(D’Souza et al., 2008;
Dumas and Miller, 2003; Lopez-Sanchez et al., 2010; Parker, 1983; Wolkers et al., 2004; Yee et al., 2004). 즉 FT-IR 스펙 트럼 상의 질적, 양적 차이는 아프리칸 얌에 함유되어 있는 아미노산이나 단백질, 지방산, 그리고 탄수화물계통의 화합 물들의 질적, 양적 차이가 현저하게 나타남을 의미한다. 따 라서 FT-IR 스펙트럼 분석은 아프리칸 얌 시료들 사이에서 주요 대사체의 질적, 양적 변화를 조사하고 이들 화합물의 함량이 높은 계통이나 라인의 신속한 선발 수단으로 활용이 가능할 것으로 기대된다.
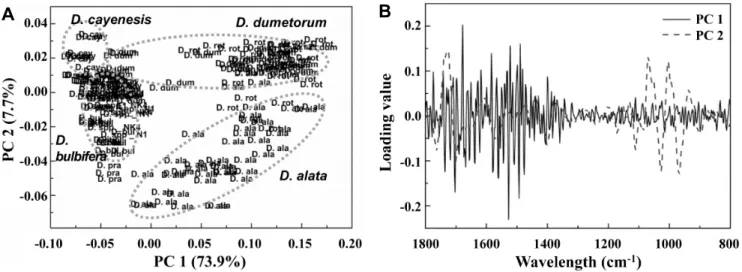
아프리칸 얌 시료의 FT-IR 스펙트럼 데이터 다변량통계분석 FT-IR 스펙트럼 데이터의 PCA 분석 결과 PC 1과 2 score 는 전체 변이량의 각각 75.8%, 7.3%의 설명력을 갖고 있으 며 이는 전체 변이량의 약 83.1%를 반영하고 있음을 알 수
A
B
Fig. 2. PCA scores (A) and loading values plot (B) of PCA scores from FT-IR data of African yam lines. Dotted eclipses represent the clustering boundary of yam tuber samples w ith high (D.dumetorium), medium (D. bulbifera) and low (D. alata) contents of total phenolic compound and flavonoids. Abbreviations in the PCA score plots represent each African yam samples: Solid line and dotted line represent PC 1 and PC 2 score, respectively (A); Arrows indicate the FT-IR regions playing important roles in African yam sample clustering (B) D. ata: Dioscorea alata; D. bul: Dioscorea bulbifera; D. cay: Dioscorea cayenesis;
D. dum: Dioscorea dumetorum; D. man: Dioscorea mangenotiana; D. pra: Dioscorea prahensilis; D. rot: Dioscorea rotundata;
D. spp: Dioscorea spp. Kenyan.
있었다(Fig. 2A). 이처럼 설명력이 높은 PC1과 PC2를 기준 으로 아프리칸 얌 시료들의 PCA score plot을 관찰한 결과, 아프리칸 얌 시료들은 PC 1을 기준으로 크게 좌우로 구분이 이루어지는 것을 관찰할 수 있었다. PCA score plot 상의 좌 측에는 D. cayenesis, D. bulbifera, D. mangenotiana, D.
prahensilis와 Dioscorea spp. Kenyan 종들이 주로 위치하였 으며, 우측에는 D. alata, D. dumetorum과 D. rotundata 종들 이 위치하였다. 이들 아프리칸 얌 시료들을 PC 2를 기준으 로 보면 상하로 집단의 분포가 이루어짐을 알 수 있었다. 위 쪽에는 D. dumetorum, D. rotundata에 속하는 시료들이 주 로 분포하였으며, 반대로 아래쪽에는 주로 D. alata 시료들 이 분포함을 알 수 있었다(Fig. 2A).
아프리칸 얌 시료의 PCA score plot상에서 공간적인 분포 위치가 주는 생물학적인 정보를 파악하기 위하여 먼저 아프 리칸 얌 시료들의 기능성 성분들 함량 차이 결과(Table 1)와 PCA score plot상의 이들 시료들의 위치와 상관관계를 조사 하였다. Total carotenoids, flavonoids이 비교적 낮았던 시료 인 D. alata의 경우 재미있게도 PCA score plot상에서 우측 하단에 별도의 그룹을 형성하였으며, 반대로 total carotenoids, flavonoids 및 phenolic 함량이 가장 높았던 시료인 D. dumetorum 의 경우 PCA score plot상에서 우측 상단에 별도의 그룹을 형성하며 분포하는 것을 관찰할 수 있었다. 이상의 결과를 미 루어볼 때 PCA score plot상에서 공간적인 분포위치와 이들
시료의 기능성 성분들 total carotenoids, flavonoids 및 phenolic 의 함량과 밀접한 상관관계가 있음을 알 수 있었다.
PCA score plot 상에서 기능성 성분들의 함량에 따른 아 프리칸 얌 시료들의 집단 구분 및 클러스터링에 중요한 역 할을 하는 FT-IR 스페트럼 부위를 조사하기 위하여 PC 1과 2를 결정하는데 중요한 FT-IR 스펙트럼 부위를 조사하였다 (Fig. 2B). Loading value 분석 결과 아프리칸 얌 시료의 좌우 구분에 중요한 PC 1을 결정하는 중요한 FT-IR 스펙트럼 부 위는 주로 1,700-1,500과 1,500-1,300cm-1 region임을 알 수 있었고, 얌 시료의 상하 구분에 중요한 PC 2의 경우 주로 1,100-950cm-1 region임을 알 수 있었다(Fig. 2B). 이들 FT-IR 스펙트럼 부위는 아프리칸 얌 시료의 FT-IR 스펙트럼 비교 에서 보였던 차이가 큰 부위(Fig. 1)와 일치하는 것으로 amide I, II, 지방산과 carbohydrates 계열의 화합물들의 질적, 양적 차이가 아프리칸 얌의 대사체 수준 식별에 중요한 역할을 하고 있음을 의미하는 결과라 사료된다(Fig. 2B). 특히 기능 성 성분들의 함량 차이에 따른 아프리칸 얌 시료의 구분에 있어서 중요한 역할을 하는 PC 2의 경우 carbohydrates 계열 의 화합물들의 질적, 양적 차이가 크게 영향을 줌을 알 수 있었다. 이 결과로 미루어 볼 때 이들 당 계열의 일차대사산 물들의 양적 변화가 이차대사산물의 질적, 양적 변화와 양 의 상관관계에 놓여 있음을 의미하는 결과라 사료된다.
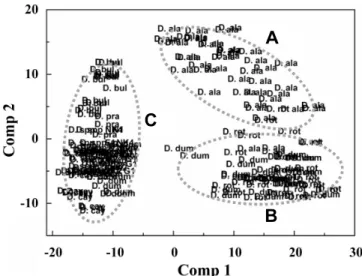
PLS-DA 분석의 경우 PCA 분석보다 더욱 확실하게 아프
A
B C
Fig. 3. PLS-DA score plot of FT-IR data from African yam lines.
Dotted eclipses and capitals represent the clustering boundary of yam tuber samples with high (B), medium (C) and low (A) contents of total phenolic compound and flavonoids.
Abbreviations in the PLS-DA score plots represent each African yam samples. D. ata: Dioscorea alata; D. bul: Dioscorea bulbifera; D. cay: Dioscorea cayenesis; D. dum: Dioscorea dumetorum; D. man: Dioscorea mangenotiana; D. pra: Dioscorea prahensilis; D. rot: Dioscorea rotundata; D. spp: Dioscorea spp. Kenyan.
A
B
C
Fig. 4. Linear regression analysis between estimated and predicted values of total carotenoids (A), flavonoids (B), and phenolic contents (C) by the PLS regression model from FT-IR spectral data. Regression coefficient values (R
2) are 0.83, 0.86 and 0.72 respectively.
리칸 얌 시료들의 그룹 식별이 가능하였다(Fig. 3). 각각의 아프리칸 얌 시료들의 그룹 경계는 PCA에 비해 더욱 작아 졌으며 동일 종에 속하는 각 시료들의 반복구들도 각 그룹 내에 위치하여 PCA보다 아프리칸 얌의 식별능력이 향상되 었음을 알 수 있었다. Total carotenoids, flavonoids 함량이 비교적 낮았던 시료인 D. alata의 경우 PCA score plot상에 서 우측 상단에 별도의 그룹을 형성하였으며, 반대로 total carotenoids, flavonoids 및 phenolic 함량이 가장 높았던 시 료인 D. dumetorum의 경우 PLS-DA score plot상에서 D.
rotundata와 함께 우측 하단에 별도의 그룹을 형성하며 분포 하는 것을 관찰할 수 있었다. 기능성 성분들의 함량이 중간 인 그룹은 주로 좌측에 분포하였다(Fig. 3). 이상의 결과를 미루어볼 때 PCA와 마찬가지로 PLS-DA 역시 각 아프리칸 얌 시료들의 sccore plot상에서 공간적인 분포위치와 이들 시료의 기능성 성분들 total carotenoids, flavonoids 및 phenolic 의 함량과 밀접한 상관관계가 있음을 알 수 있었다.
아프리칸 얌의 FT-IR 스펙트럼으로부터 Total Carotenoids, Flavonoids 및 Phenolic 함량 예측 PLS Regression 모델링
FT-IR 스펙트럼 데이터와 UV-VIS spectrophotometer를 이
용하여 측정된 total carotenoids, flavonoids 그리고 phenolic 함량 데이터를 이용하여 각 성분별 함량 예측 PLS 모델링 을 개발하였다(Fig. 4). Total carotenoids의 경우, PLS 모델
링을 통해 FT-IR 스펙트럼 데이터로부터 예측된 함량 값과 동일 시료의 실측 함량 값을 이용하여 회귀분석을 수행한 결과 상관계수가 R2 = 0.83로 높게 나타났다(Fig. 4A). Total flavonoids와 total phenolic의 함량 예측 모델링을 통한 선형 회귀분석 상관계수는 각각 R2 = 0.86(Fig. 4B) 및 0.72(Fig.
4C)로 나타났다. 이들 결과는 얌 시료의 FT-IR 스펙트럼 데 이터 만으로도 이들 시료 내에 존재하는 total carotenoids, flavonoids 및 phenolic의 함량을 80-90% 정도 정확성으로 함량을 예측할 수 있는 결과라 사료된다. 아직 아프리칸 얌 시료에서 carotenoid 함량 예측 모델링 연구가 보고된 바 없 어 정확한 비교는 어렵지만 carotenoid 함량이 높은 당근의 경우 FT-IR 스펙트럼과 total carotenoids 함량의 상관관계 분석을 통해 상관계수(R2)가 0.9정도임이 보고된 바 있다 (Zude et al., 2008). Total flavonoids와 total phenolics의 함 량 예측의 경우 커피(Páscoa et al., 2013)에서 보고된 바 있 으며 이 경우 함량 예측 모델링의 상관계수는 각각 R2 = 0.94, R2 = 0.94로 본 연구에서 보여준 아프리칸 얌의 경우보다 상관계수가 높게 나타났다. 향후 PLS 모델링의 정확도 향상 을 위한 시료의 분석조건 표준화, 모델링에 사용되는 분석 시료의 개체 수 증대, 기능성 성분의 양적 변화가 큰 시료가 모델링에 활용되는 등의 보완이 이루어진다면 보다 정확한 성분 예측 모델링으로 활용이 가능할 것으로 기대된다. 아 울러 얌의 경우 종간에 기능성 성분들의 양적, 질적 차이가 크게 이루어짐이 보고(Yang et al., 2009)된 바 있다. 또한 얌이 함유하고 있는 기능성 성분들에 대한 약리적 효과가 연구되고 있으며(Song et al., 2010; Yoon et al., 1989), 최근 에는 기능성 성분들에 대한 연구가 매우 활발히 진행되고 있다(Kim et al., 2009; Kum et al., 2006; Kwon et al., 2010).
그러나, 기능성 성분을 정량 분석하기 위해서는 많은 시간 이 필요하고, 대량의 시료를 분석하는데 어려움이 있다.
따라서 본 연구 결과를 토대로 기능성 성분 예측 모델링을 구축하고, 활용한다면 보다 쉽고, 빠르고 그리고 비교적 정확하게 기능성 성분을 예측할 수 있기 때문에 시간적, 비용적인 측면에서 보다 손쉽게 활용이 가능할 것으로 사 료된다.
따라서 본 연구에서 확립된 대사체 수준에서 아프리칸 얌 의 유용 기능성 성분 함량 예측 모델링은 아직 동정 및 표준 화가 이루어지지 않은 다수의 아프리칸 얌 시료로부터 품질 특성 평가 수단으로 활용이 가능하여 우수한 얌 품종이나 계통의 신속한 선발 수단으로서 활용이 가능할 것이다. 또 한, 선발된 라인은 육종의 직접적인 소재로 활용이 가능하
여 아프리칸 얌의 기능성 품종개발 가속화에 기여할 수 있 을 것으로 예상된다.
초 록
본 연구에서는 UV-VIS spectrophotometer를 이용한 total carotenoids, flavonoids, phenolics 함량 데이터와 FT-IR 스펙 트럼 데이터를 다변량통계분석법을 통하여 기능성 성분 함량 이 높은 아프리칸 얌 고속 선발 시스템을 구축하였다. 62개 아 프리칸 얌의 total carotenoids 함량은 0.01-0.91μg・g-1 dry wt 나타냈다. Total flavonoids와 phenolics 함량은 12.9-229.0 μg・g-1 dry wt와 0.29-5.2mg・g-1 dry wt로 각각 나타났다. 아 프리칸 얌은 FT-IR 스펙트럼상의 1700-1500, 1500-1300, 1100-950cm-1 부위에서 중요한 스펙트럼 변화가 나타났다.
이 부위는 각각 amide I과 II을 포함하는 아미노산 및 단백 질계열의 화합물, phosphodiester group을 포함한 핵산 및 인 지질 그리고 단당류나 복합 다당류를 포함하는 carbohydrates 계열의 화합물들의 질적, 양적 정보를 반영하는 부위이다.
PCA 분석과 PLS-DA 분석에서 62개 아프리칸 얌은 유연성 이 높은 종으로 3개의 그룹을 형성하였다. 아프리칸 얌의 FT-IR 스펙트럼 데이터와 UV-VIS spectrophotometer 을 이 용한 total carotenoids, flavonoids, phenolics 함량 데이터 간 에 PLS regression 분석하였다. Total carotenoids, flavonoids, phenolics 함량 성분의 실측 값과 예측 값간에 상관계수(R2)가 각각 0.83, 0.86, 0.72로 나타났다. 이 결과, 아프리칸 얌으로 부터 FT-IR 스펙트럼을 이용한 total carotenoids, flavonoids, phenolics 함량 예측이 가능하였다. 본 연구에서 확립된 대 사체 수준에서 아프리칸 얌의 유용 기능성 성분 함량 예측 모델링을 통해 품종, 계통의 신속한 선발 수단으로 활용이 가능할 것으로 예상된다.
추가 주요어 : 카로티노이드, 플라보노이드, 부분최소제곱회 귀(PLSR), 페놀계 화합물, 주성분분석(PCA), 자외선분광광도계