Impacts of Climate Change, Income Change, and Mitigation Measures on CO
2Emission in the Korean Residential Sector in 2050
Park, Chan
*†, Tatsuya, Hanaoka
**, Toshihiko, Masui
***, Lee, Dongkun
****and Jung, Taeyong
******Assistant professor, Department of Landscape Architecture, University of Seoul, Seoul, Republic of Korea
**Senior Researcher, Integrated Environment and Economy Section, Center for Social & Environmental Systems Research, National Institute for Environmental Studies, Japan
***Head, Integrated Environment and Economy Section, Center for Social & Environmental Systems Research, National Institute for Environmental Studies, Japan
****Professor, Department of Landscape Architecture and Rural Systems Engineering, Seoul National University, Republic of Korea
*****Professor, Graduate School of International Studies, Yonsei University, Seoul, Republic of Korea
ABSTRACT
This study analyzes potential CO2 emission pathways in the Korean residential sector by using the bottom-up optimization model, AIM/Enduse. This study focuses on: 1) estimating potential emissions considering future changes in population, GDP, and temperature, 2) assessing the mitigation potential of CO2 with a mitigation measures including carbon tax. 3) discussing co-benefits of air pollutants mitigation such as NOx, SO2 in the context of climate mitigation measures in the Korean residential sector. As a result, population and GDP variation shows an overwhelming impact on CO2 emission. Climate change may help to reduce energy consumption and CO2
emission in Korea due to heating and hot-water use demand decreasing. The carbon tax of 20, 50, 100, 200, 300, 500, 1000 US$/tCO2 in 2050 can reduce 1.0%, 2.5%, 3.6%, 9.6%, 12.2%, 14.1%, and 19.7% of CO2 emission respectively compared to BaU scenario of SSP2 with current technology selection behavior based on life cycle cost.
There is also a benefit of large reduction potential of air pollutants, in the range of 5-40% reductions in with CO2
mitigation measures.
Key words: AIM/Enduse, Bottom-up approach, Socio-economic scenario, RCP scenario, co-benefit
†Corresponding author: [email protected] (163 Seoulsiripdaero, Dongdaemun-gu, Seoul 02504 KOREA, Tel : +82-2-6490-2849) Received December 14, 2018 / Revised January 14, 2019 1st, January 23, 2019 2nd / Accepted February 8, 2019
1. Introduction
Human welfare and climate change are both increasingly critical drivers affecting policies, regulations and investment in the energy sector. Our society faces severe and possibly permanent alterations due to climate change. Ambitious long-term climate targets are being seriously considered to avoid the worst case of climate impacts (Ciscar and Dowling, 2014). Before setting the climate targets, policy makers and managers must carefully assess the potential barriers, costs, benefits, and unintended social and environmental conse- quences, considering the overall possible changes in the future. One way is to understand future energy service demand in more detail, and the possible reduction of CO
2emission and its co-benefits of air-pollutant emission. If health benefits, climate change, and other environmental benefits were quantified, society would be able to reduce unintended investment risks.
Worldwide, households consume about a third of all
end-use energy. In countries in a temperate climate zone,
more than half of this energy is typically used for heating
(IEA, 2004). Korea also emit 13.5% of CO
2in residential
sector in 2007 and uses more than 60% of household energy
for heating and hot-water (Yoon et al., 2010). Rising incomes
and the human welfare movement in Korea could lead
perhaps to an increase in demand for household energy
services. Global climate change trends also are causing
energy use patterns in the household sector to change. In
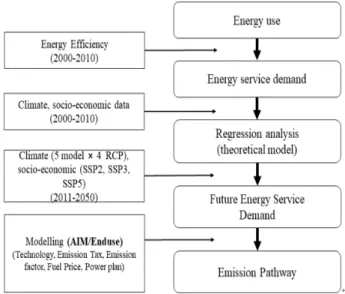
Fig. 1. Study framework.
addition, there are equally important questions about how the residential sector be affected by climate policies.
On the global scale, the integrated model (ENVISAGE, ICES, GRACE, AIM/CGE, IMAGE and IGEM) is used to predict impact of socio-economic change on emissions. These model’s results are not fully integrated with energy demand, climate change, and mitigation measures. On the regional scale, some studies have been performed for the USA (Rong et al 2007; Zhou et al 2013), India (Chaturvedi et al 2014), and China (Yu et al 2014; Zhou et al 2013). Nevertheless, of these regional and global study, there is still a lack of studies that can be accessing integrated impacts of population change, life style change, climate change, and climate policies on CO
2reduction potential, and benefits.
Residential sector is key area to observe to check overall possible changes in the future for decision making. In this paper, we attempt to describe changes in CO
2emissions induced by the Korean residential sector. We fully integrate socio-economic change, climate change, and the effect of mitigation measures in the context of shared socio-economic pathway (SSP), and future climate conditions with representative concentration pathways (RCP) trajectories. The primary objective is to develop a detailed analysis of energy service demand based on climate change and socio-economic changes such as population and income with 6 mega-region analysis.
The study then discusses for the sake of clarity CO
2emission reduction and the co-benefit of air pollutants reduction potentials as a result of climate policies.
2. Methodology
2.1 Modeling framework
This analysis consists of two parts: 1) estimating potential emissions considering future changes in population, income and climate, 2) assessing the mitigation potential of CO
2with a carbon tax scenario and analyzing co-benefits of reducing air pollutants such as NOx, SO
2, and so on by using a technology bottom-up model, the AIM/Enduse model (Fig. 1).
We develop regression model of energy service demand using energy use data, technology efficiency, and climate data from 2000 and 2010. We predict future energy service demand
with 3 SSPs and 4 RCP scenarios using empirical model. We set the scenario to answer our research question and analyze our scenario using AIM/Enduse model. This scenario framework is envisioned as being useful to address a variety of questions, such as investigating in more detail its dependence on both the level of climate change and future socioeconomic conditions, evaluation of specific policies, and discovering the tradeoffs and synergies of reducing air-pollutant reduction while reducing CO
2s under mitigation measures.
2.2 AIM/Enduse
The AIM/Enduse model is a bottom-up optimization model with a detailed mitigation technology selection method. The model firstly analyzes combinations of technologies in order to satisfy the future service demand in each service and sector, then estimates CO
2emissions and final energy consumption in the demand sectors and uses the given final energy demand to estimate the CO
2emissions and primary energy consumption for the power generation sector.
Technologies are selected in a linear optimization framework
to minimize the total system costs including initial costs, the
operating costs of technologies, energy costs, taxes and
subsidies, and other costs. The AIM/Enduse model is a
recursive dynamic model which can simultaneously perform
Service Code Technology Fuel
Space cooling RSC Air conditioner Electricity
Space heating RSH Boiler, stove Kerosene, LNG. LPG, Electricity
Hot-water RHW Boiler, Hot-water supplyer Kerosene, LNG. LPG, Electricity
Cooking RCD Gas range, Electric cooker LNG. LPG, Electricity
Lighting RLD Incandescent Bulb, Flurorescent bulb, LED Electricity
Fridge RRD Refrigerator Electricity
Information and communications
technology RID Tv, Computer Electricity
Other appliance ROD Washing merchine, vacuum, and so on Electricity Table 1. Disaggregated end use technologies for various energy services in the residential sector
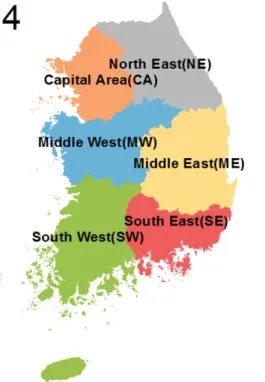
Fig. 2. Region aggregation.
calculations for multiple years and can analyze various CO
2emission scenarios under several constraints such as satisfaction of service demands, availability of energy and material supplies, and other system constraints (Kainuma et al, 2003; Hanaoka et al, 2015).
2.3 Scope and target
The Korea residential model was developed with 6 mega-regions to predict future impact more precisely as a
model with finer resolution can provide more insights in the national level estimation. We referred to economic dependency and cultural similarity to disaggregate Korea. The mega-regions were the Capital Area (CA), the Middle West area (MW), the South West area (SW), the North East area (NE), the Middle East area (ME), and the South East area (SE). This study simulates from 2010 to 2050 to gain mid-long-term information on CO
2emissions.
2.4 Energy service demand
The residential sector was divided by heating, hot-water, cooling, cooking, lighting, refrigeration, Information and Communication Technology (ICT), and other services as shown in Table 1.
We used a decomposition analysis method to predict future energy service demand (Isaac and van Vuuren, 2009). Energy service demand is divided by activity and intensity. Activity is the population in this study, and intensity is energy service demand per person. For intensity change modeling, a general liner regression method was developed using variables (GDP, heating degree days (HDD), cooling degree days (CDD), and so on). To make each service regression model, four-year regional panel data sets (2001, 2004, 2007, and 2010) were used (Eq. 1 and 2). The Gomertz curve function is used to estimate device penetration. The regression method was applied to identify the intensity change due to socio-economic changes and lifestyle changes, using energy service demand.
All SSP scenario and all climate condition (RCP scenario)
data was used mainly to illustrate possible feedback between
climate change and energy service demand.
Current energy service demand
(Eq. 1)
(Eq. 2)
Future energy service demand
(Eq. 3) (Eq. 4)
Where, RSD: Energy Service Demand, EC: Energy Consumption, EE: Energy Efficiency, DP: device penetration (r: Region, s: Service, e: Energy, d: Device)
2.5 Disaggregation of population and GDP In order to prepare the local scale drivers such as population and GDP, ideally a local model will be developed, and parameters will be calculated to replicate a national value that is equal to the total of local values. But even though a local model similar to the national model can be used, it is difficult to replicate the national values and provide a theoretical basis to change the parameters. Based on the calculated regional population change, the annual regional population is calculated. The national GDP per capita up to 2050 is calculated from SSPs, and the regional GDP per capita in the benchmark year is also calculated. The regional GDP is adjusted to meet the national total value using the regression and convergence year that correspond with SSP storylines (van Vuuren et al., 2012). Disaggregation of population and GDP into mega-regions using SSP scenario results has been described (See appendix).
2.6 Heating degree days (HDD) and Cooling degree days (CDD)
HDDs and CDDs can have an important influence on heating and cooling demand. Degree-days are the summation of temperature differences from a human comfort level over
time. They capture both extremity and duration of difference between outdoor temperatures and reference temperatures.
Heating degree days are degree-days below the ‘‘set point’’
of 18°C, and cooling degree days are degree-days above the
‘‘set point’’ of 24°C The population grid in 2005 was used for the weighting to provide a more precise explanation at provincial level. To remove model uncertainty, an average of five major climate models (gfdl-esm2m, hadgem2-es, ipsl-cm5a-lr, miroc-esm-chem, noresm1-m) and four RCPs (RCP2.6, RCP4.5, RCP6.0, RCP8.5) for each model are used to derive future climate (See appendix).
3. data and scenario
3.1 Population and GDP
In order to estimate future service demand, it is important to set socio-economic drivers such as population growth rate and GDP growth rate. This study used the population growth and GDP growth ratio (instead of income) based on the SSP scenario developed by Statistics Korea, Korea Development Institute, IIASA and OECD. In this research, SSP2 (similar with medium-growth scenario from Korea government projection), SSP3, and SSP5 were selected. SSP2 show similar pattern and range with SSP1 and SSP4 in Korea.
According to the SSP2 scenario and the government
forecast, the total population for Korea is projected to
decrease from 49.4 million people in 2010 to 48.8 million
people in 2050. The annual rate of population growth is
expected to decrease from 0.46 percent in 2010 to 0.28
percent in 2020. Beginning in 2031, the population growth
rate will become negative, then decline to -1.0 percent in
2050. The population of most areas, except the CA and MW
areas, are expected to decrease from 0.88 to 0.98 compared
to that of the 2010 level. The number of households is
expected to increase because of the increasing total
population in the CA and MW regions, and family size will
decrease from around three to two. The Gross Domestic
Product (GDP) in SSP2, SSP3, and SSP5 will expand
respectively, 3.2, 2.7, and 2.8 percent from 2010 to 2030, 2.0,
0.3, and 2.6 percent from 2031 to 2050 according to OECD
outlook. The proportion of GDP is 49% (CA), 12% (MW),
Fig. 3. Population and GDP per capita with different SSP scenarios from IIASA database and the Korean government prediction (KOR) from Statistics Korea (Population) and Korea Development Institute (GDP).
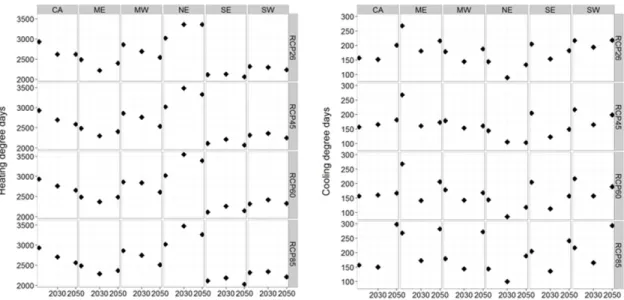
Fig. 4. Heating degree days and Cooling degree days in 2010, 2030, and 2030 under different climate conditions.
11% (SW), 2% (NE), 9% (ME), and 16% (SE) in 2010.
3.2 Climate change
HDD and CDD correspond to the long-term global average temperature. HDD is expected to decrease among RCP scenarios and regions except for the NE region (Fig 4). CDD trends vary over time, associated with variability in RCP scenarios and regions (Fig 4). It might be expected that predicting cooling energy service demand is relatively important. The RCP85 scenario shows high CDD changes in all regions.
3.3 Scenario
Assumptions of socio-economic factors and service demands were the same across the scenarios and only technology selections were different as they were determined by the AIM/Enduse model to satisfy these given service demands. Estimations of mitigation potentials are influenced by the portfolio of various mitigation measures, and various options are available for accelerating the introduction of energy efficient technologies on the demand side.
In this study, there is a scenario setting for estimating the
impacts of socio-economic change, climate change, and
mitigation measures on CO
2, as shown in Table 2. Each SSP
scenario (SSP2, SSP3, SSP5) under the climate conditions of
the RCP85 scenario were used with the same policy and same
Socio-economic condition Climate condition Mitigation measure (Tax:$/tCO2) Discount rate
SSP2 RCP26 Technology-frozen High (10%*, 33%)
SSP3 RCP45 BaU Low (5%)
SSP5 RCP60 Economical (20)
RCP85 (Reference) Economical (50)
Economical (100)
Economical (200)
Economical (300)
Economical (500)
3 4 8 2
* Space heating device, power generation plant only
Table 2. Modeling scenario
Capacity Share Generation share
2010 2030 BL 2050 BL 2010 2030 BL 2050 BL
Coal Power Generation 31.0% 29.3% 23.40% 40.2% 39.4% 35.1%
LNG Power Generation 22.0% 19.9% 20.0% 17.3% 16.2% 15.8%
Oil Power Generation 10.0% 0.8% 0.8% 4.8% 0.4% 0.4%
BMS Power Generation 0.0% 0.5% 0.5% 0.0% 0.4% 0.3%
Wind Power Generation 1.0% 10.0% 13.00% 0.4% 3.7% 5.4%
Solar Power Generation 1.0% 8.8% 12.00% 0.4% 3.3% 4.80%
Nuclear Power Generation 24.0% 22.7% 22.30% 31.70% 31.00% 31.9%
Water Power Generation 7.0% 3.0% 3.0% 1.3% 0.6% 0.5%
Combined Heat and Power Generation 4.0% 5.0% 5.00% 3.9% 5.0% 5.8%
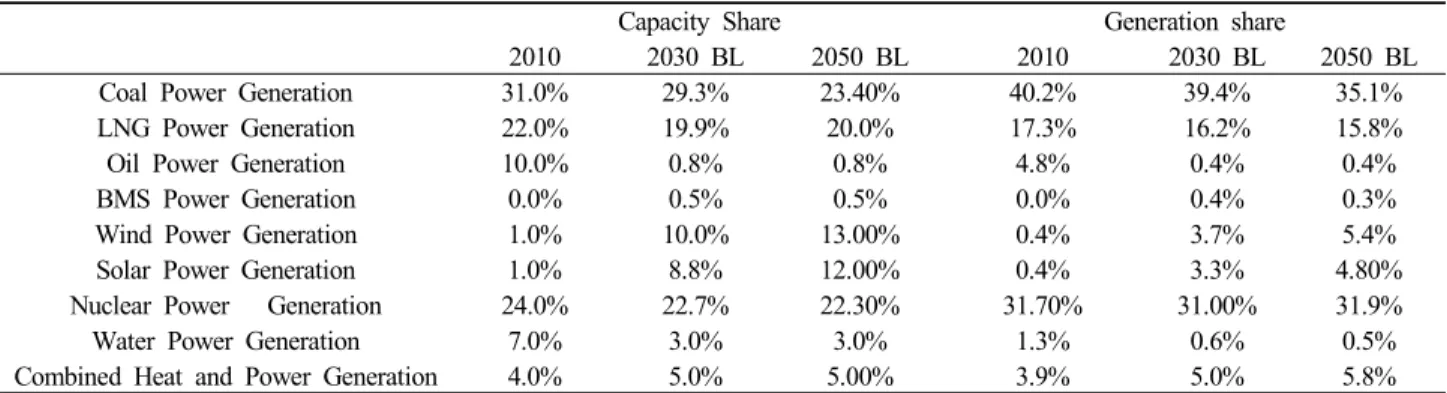
Table 3. Power generation plan in 2030 (7th Korean government plan) and 2050 (assumption)
discount rate to analyze socio-economic change impacts. For the climate impact, the SSP2 scenario under the four RCP cases is used with the same conditions and socio-economic change impact. We looked at three scenarios, one with technology frozen, one with BaU with no tax, and one economic scenario with tax from 50 ~ 1000 $/tCO
2in 2050.
Decisions require considering comprehensive strategies of pay-back time, and here the model uses a low discount rate, 5%, equivalent to the current interest of Korea, and a high discount rate of about 10% to 33% which is related Japan’s device life cycle study.
3.4 Technology database, energy database, emission factors and energy resources Understanding current patterns of energy consumption in Korea is important because they determine the potential for energy share and allow the model to represent the preferences
for individual energy services. Energy balances (KEEI, 2011)
give the total residential sector energy consumption for
Korea. We used technology efficiency and ownership ratio to
calculate energy service demand (Korea Power Exchange,
2011). The AIM/Enduse model require an energy database, an
energy resource database and a technology option database. In
the energy database, information on emission factors and
energy prices are stored. In this study, we developed
AIM/Enduse Korea database using current energy, technology
data. Energy prices are set exogenously, and they are one of
the important factors in estimating mitigation costs. Current
energy prices were set based on current price and taxes and
future international energy prices in the midterm were set
based on IEA World Energy Outlook (IEA, 2010). The future
energy prices by fuel type, sector, and country were set under
the assumption that domestic energy prices would rise with
international energy prices. Emission coefficients are important
(1) (2) (3) (4) (5) (6) (7) (8) (9) HEATING HOTWATER COOLING LIGHTING COOKING FRIDGE ICT OTHERS air conditioner
HDD 0.125***
(0.0194)
0.026*
(0.00993)
CDD 0.005*
(0.00288)
AIRCON 2.783***
(0.663)
GDPPC 0.528***
(0.046)
-5.240***
(0.636)
1.091***
(0.0892)
0.714***
(0.060)
0.436***
(0.039)
0.027***
(0.005) _cons -118.3*
(46.19)
26.280 (23.64)
2.653***
(0.491)
1.893*
(0.850)
177.000***
(12.13)
3.253 (1.701)
2.651*
(1.146)
1.578*
(0.746)
-0.013 (0.101)
N 64 64 64 64 64 64 64 64 64
R-sq 0.739 0.665 0.872 0.848 0.822 0.865 0.829 0.903 0.569
adj. R-sq 0.650 0.551 0.825 0.796 0.761 0.820 0.771 0.870 0.422
(rsme)
Standard errors in parentheses
*p<0.10 **p<0.0.5 ***p<0.01
Table 4. Regression model of intensity of each energy service per person
factors for estimating emissions amounts. Regarding air
pollutants, this study considered emission coefficients of primary emissions derived from energy combustion, and they were set by energy source, based on various international emissions factor guidelines and Korean reports (NIER, 2013).
This study used the 7
thKorean government power generation plan to observe the possibility of reductions as this plan combines both energy security issues and social concerns.
4. Results and discussion
4.1 Empirical model
The regression model results of each services are given in Table 4. Heating service demand and hot-water service demand per person will be influenced by HDD changes. This model can account for 65% and 55% of each. Cooling demand not only depended on CDD but also on purchasing of air-conditioning systems, which is usually described as an S-shaped curve function of the level of income. Lighting service demand per person was affected by income. Cooking depended on an income level at which people go outside of the home to eat. Other appliances such as refrigerators, TVs,
computers, and so on were also correlated with income level Figs 5. and 6. show energy service demand among the three SSP scenario under the RCP85 scenario. According to our model, final energy service demand does not grow significantly across the scenario up to 2050, which is predominantly due to the declining population. Energy service demand in the residential sector increases to 1.08 ~ 1.15 times among SSP scenario between 2010 and 2050 and changes to 0.86 ~ 1.23 times between 2010 and 2050.
Socio-economic variation shows an overwhelming impact on
CO
2emissions when we think about a sufficient energy
supply. Energy service demand is sensitive to climate, growth
of population and GDP, and region in terms of magnitude
and spatial pattern. Although the model does not include
macroeconomic impacts beyond energy service demand, there
is evidence that accounting for feedback effects both the
economy and energy service demand. The relative impact of
these factors varies across space and time. For example, in
the SW and SE region, climate change has an impact
comparable to population growth, while in other province,
such as the CA region, population growth shows an
overwhelming impact. When cross-province population
movements occur on a more active basis, by adaptation to
Fig. 5. Comparison of energy service demand of each SSP scenario under climate condition of RCP8.5 by region.
Fig. 6. Comparison of energy service demand of each SSP scenario under climate condition of RCP8.5 by service.
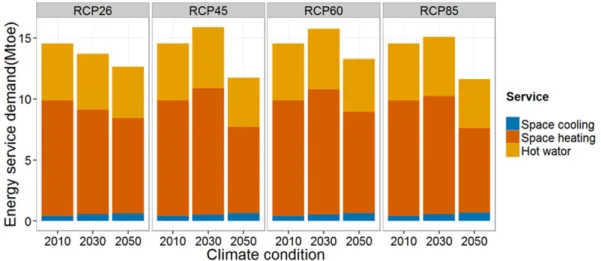
Fig. 7. Comparison of energy service demand for each climate condition under SSP2 among climate related services.
temperature, energy service demand for heating and hot-water can be reduced more in the future. These results are consistent with all regions in Korea. Other services using electricity are expected to increase their service demand because of population increase and higher income levels.
Demand for power for cooking is decreasing due to lifestyle change. People want to go outside to eat when they earn more money. Household expenditure for eating outside of the home is strongly correlated with GDP increases (Lee and Kim, 2005).
The current as well as future energy use pattern is significantly dominated by space heating and hot-water use
(Fig. 6). One notable trend in energy service demand is reduced heating and hot-water demand due to temperature increase (Fig. 7).
4.2 Comparisons of CO
2emission pathway In base scenario (population and GDP of SSP2 scenario case), CO
2emission will peak, and emit 76 MtCO
2in 2030.
After 2030, CO
2emission will decrease to 72 tCO
2due to
population decrease. Fig. 8 (left) shows CO
2emissions in the
residential sector under the different population and GDP
changes. In the event of population and GDP change impacts,
Fig. 8. CO2 emission scenario impacted by socio-economic change, and climate change.
Fig. 9. CO2 emission scenario impacted by climate policy such as carbon tax.
the emissions pattern is similar to population change in 2030, and 2050. CO
2emissions will increase by 1.13 times in SSP5, and decrease by 0.78 times in SSP3 compared to SSP2’s 2050 emission level. The gap of CO
2emissions in 2030 and 2050 is smaller than in 2020. In the case of climate change, CO
2emission will be shown fluctuation due to different potential changes by regions and climate scenario. More CO
2will be emitted in the RCP6.0 and RCP2.6 scenario due to heating and hot-water energy service demand in 2020, 2050 (Fig. 8 right). In case of Korea, climate change will help to reduce emission that comes from heating and cooling energy demand in certain period.
In the technology-frozen scenario, which represents a
scenario in line with the current and the previous share of device efficiency, CO
2will be emitted 78 MtCO
2. Korea residential sector can reduce 6 MtCO
2without any tax due to autonomous efficiency improvements. The carbon tax scenario at 50 US$/tCO
2to 1000 US$/tCO
2in 2050 can reduce CO
2emissions. A low discount rate, 5%, equivalent to the current interest rate of Korea, shows drastic decreases in CO
2emissions compared to a high discount rate of between 10% and 33%. In a low discount rate, no carbon tax scenario can reduce CO
2emissions more than 1000 US$/tCO
2scenario result of the high discount rate in 2050. With a long-term investment plan of customer and carbon taxes from government policy, Korea could reduce emissions by an average 16 MtCO
2compared to BaU case in 2050. To achieve the low carbon target, government should report cost-effectiveness of new device investment even if its device cost is high. And carbon taxes is needed in order to expand the use of energy-efficient devices at a faster rate than the demand side.
4.3 Co-benefits of air-pollutant reduction from CO
2mitigation measures
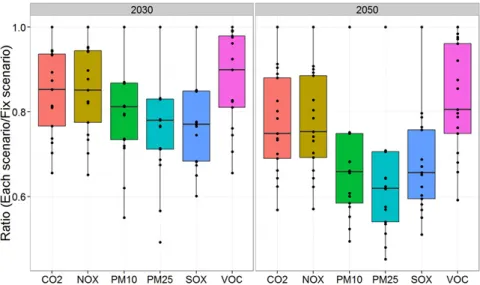
Fig. 10 shows the co-benefits of CO
2mitigation action in reducing energy-related air pollutant emissions. While reducing CO
2emission with mitigation measures, PM and SO
2, which harm human health, can be reduced by more than the average level. There is also a benefit of large reduction potential of air pollutants, in the range of 5-40% reductions.
There number is quite similar with Chae and park (2010).
Fig. 10. CO2 and air-pollutant emission reduction ratio with mitigation measure compared to BaU case under SSP2 and RCP85 scenario.
Regarding the reduction of emissions, energy efficiency change and fuel shift could play an important role in curbing air pollutants (see 1000 US$/tCO
2carbon tax case). In the residential sector, the use of LNG or electricity for heating services is a good way to reduce air-pollutant emission. But rural households are significantly different and characterized by the dominance of different fuels. Rural Korea is currently dependent on kerosene for heating and hot-water supply because of the lack of an infrastructure for LNG.
This study analyzed the impacts of socio-economic change, climate change and mitigation measures on CO
2, and also discussed co-benefit of air-pollutant emissions reduction from climate policies such as carbon tax. Our model can present a detailed, service-based model in the Korean residential sector and power generation sector. It covered multi-gas including not only the CO
2emission but also major air pollutants such as SO
2, NOx, and PM, and analyzed the co-benefits of reducing air pollutants due to CO
2mitigation actions.
Socio-economic variation shows an overwhelming impact on CO
2emissions. With a long-term investment plan of customer and carbon taxes from government policy, Korea could reduce emissions by an average 16 MtCO
2compared to BaU case in 2050. There is also a benefit of large reduction potential of air pollutants, in the range of 5-40% reductions.
Using energy-efficient technologies and fuel shift can play an
important role in curbing air pollutants. This study has not fully considered the potential practical, political, and institutional barriers to implement each option region by region. That question will be for a future agenda to be discussed in our ongoing studies.
Acknowledgements
This work is supported by Korea Environment Industry &
Technology Institute (KEITI) through Climate Change R&D Program, funded by Korea Ministry of Environment (MOE).
(2018001310002) and was supported by the Environmental Research and Technology Development Fund (S-12-2) of the Ministry of the Environment of Japan
REFERENCES
Asia-Pacific Integrated Model (AIM). 2013. In: Hanaoka T.
(Ed.) AIM/Enduse Model Manual. [accessed 2018 Dec 3]
http://www-iam.nies.go.jp/aim/AIM_datalib/Enduse_mod el/Manual_EnduseModel.pdf.
Chae Y, Park J. 2011. Quantifying costs and benefits of integrated environmental strategies of air quality management and greenhouse gas reduction in the Seoul Metropolitan Area. Energy Policy 39: 5296-5308.
Chaturvedi V Eom J Clarke L.E Shukla P.R 2014. Long
term building energy demand for India: Disaggregating end use energy services in an integrated assessment modeling framework. Energy Policy 64: 226-242.
Ciscar JC, Dowling P 2014. Integrated assessment of climate impacts and adaptation in the energy sector.
Energy Econ. 46: 531-538.
Hanaoka T, Akashi O, Fujiwara K, Motoki Y, Hibino G.
2014. Potential for reducing air-pollutants while achieving 2°C global temperature change limit target. Environ.
Pollut. 195: 336-343.
Intergovernmental Panel on Climate Change (IPCC) 1996.
Revised 1996 IPCC Guideline for National Greenhouse Gas Inventories. Cambridge University Press Cambridge UK.
Intergovernmental Panel on Climate Change (IPCC) 2006.
IPCC Guideline for National Greenhouse Gas Inventories.
Cambridge University Press Cambridge UK p. 2006 Intergovernmental Panel on Climate Change 2014. Fifth
Assessment Report - Climate Change 2014: Mitigation of Climate Change http://www.ipcc.ch/report/ar5/wg3/
International Energy Agency (IEA) 2010a. Energy Prices and Taxes 2010.
International Energy Agency (IEA) 2010b. World Energy Outlook 2010.
International Energy Agency (IEA) 2010c. Energy Technology Perspective 2010.
Isaac M, van Vuuren DP 2009. Modeling global residential sector energy demand for heating and air conditioning in the context of climate change. Energy Policy 37 (2): 507 –521. http://linkinghub.elsevier.com/retrieve/pii/S03014 21508005168.
Korea Energy Economics Institute (KEEI) 2002. Energy statistics of Korea
Korea Energy Economics Institute (KEEI) 2005. Energy statistics of Korea
Korea Energy Economics Institute (KEEI) 2008. Energy statistics of Korea
Korea Energy Economics Institute (KEEI) 2011. Energy
statistics of Korea
Korea Power Exchange (KPE) 2001. Survey on electricity consumption characters of home appliances
Korea Power Exchange (KPE) 2004. Survey on electricity consumption characters of home appliances
Korea Power Exchange (KPE) 2006. Survey on electricity consumption characters of home appliances
Korea Power Exchange (KPE) 2008. Survey on electricity consumption characters of home appliances
Korea Power Exchange (KPE) 2011. Survey on electricity consumption characters of home appliances
Lee KI, Kim MJ. 2005. Current status for eating outside.
Korea Rural Economic Institute.
Lee SK. 2010 Energy use in residential sector and estimation.
Korea Energy Economics Institute.
National institute of Environmental Research (NIER) 2013.
National emission factors of air-pollutant http://airemiss.
nier.go.kr/
Yoon SW, Lim EH, Lee GM, Hong YD. 2010, Analysis of CO
2Emission Pattern by Use in Residential Sector, Climate Change Research. 1 (3): 189-203.
U.S. Environmental Protection Agency 1995. Emissions Factors & AP 42 Compilation of Air Pollutant Emission Factors. http://www.epa.gov/ttnchie1/ap42/
Van Vuuren DP, Riahi K, Moss R, Edmonds J, Thomson A, Nakicenovic N, Kram T, Berkhout F, Swart R, Janetos A, Rose SK, Arnell N. 2012. A proposal for a new scenario framework to support research and assessment in different climate research communities.
Glob. Environ. Chang. 22: 21-35.
Yu S, Eom J, Zhou Y, Evans M, Clarke L. 2014. Scenarios of building energy demand for China with a detailed regional representation. Energy 67: 284-297.
Zhou N, Fridley D, Khanna NZ, Ke J, McNeil M, Levine M. 2013. China’s energy and emissions outlook to 2050:
Perspectives from bottom-up energy end-use model.
Energy Policy 53: 51-62.
Appendix
1. Disaggregation of GDP
2. Population growth ratio that used for disaggregation
3. Heating degree days and cooling degree days
4. Data source
Period Resolution Source Note
Population 2000 - 2050 Province level Statistic Korea, IIASA (SSP)
National predicted population divided into region by downscaling method
Household 2000 - 2050 Province level Statistic Korea,
IIASA (SSP) We calculated using population and family size Family size 1990 - 2050 Province level Statistic Korea,
IIASA (SSP)
We assumed same historical pattern of previous for SSP
GDP 2000 - 2010 Province level Bank of Korea GDP growth rate 2011 - 2050 National level OECD (SSP) Hours use of device 2000 - 2010 Province level Korea Power Exchange Device penetration rate 2000 - 2050 Province level Korea Power Exchange Device efficiency 2000 - 2010 National level Korea Power Exchange
Heating degree days 2000 - 2050 Province level
Korea Meteorological Administration
RCPscenario
Current: station data, Future: RCP scenario (Mean), Reference temperature : 18° C
Cooling degree days 2000 - 2050 Province level
Korea Meteorological Administration
RCP scenario
Current: station data, Future: RCP scenario (Mean), Reference temperature : 24° C
Floor area 1990 - 2050 Province level Statistic Korea,
calculation We made prediction model using GDP growth rate Energy use 2000 - 2010 Province level Korea Energy Economics
Institute
Consistency check between commercial and residential data
Energy use per household
2001, 2004,
2007, 2010 Province level Korea Energy Economics Institute