© 2016 The Korean Ophthalmological Society
This is an Open Access article distributed under the terms of the Creative Commons Attribution Non-Commercial License (http://creativecommons.org/licenses /by-nc/3.0/) which permits unrestricted non-commercial use, distribution, and reproduction in any medium, provided the original work is properly cited.
Original Article
Changes in Fundus Autofluorescence after Anti-vascular Endothelial Growth Factor According to the Type of Choroidal Neovascularization
in Age-related Macular Degeneration
Ji Young Lee, Hyewon Chung, Hyung Chan Kim
Department of Ophthalmology, Konkuk University Medical Center, Konkuk University School of Medicine, Seoul, Korea
Purpose: To describe the changes of fundus autofluorescence (FAF) in patients with age-related macular de- generation before and after intravitreal injection of anti-vascular endothelial growth factor according to the type of choroidal neovascularization (CNV) and to evaluate the correlation of FAF with spectral domain optical co- herence tomography (SD-OCT) parameters and vision.
Methods: This was a retrospective study. Twenty-one treatment-naïve patients with neovascular age-related macular degeneration were included. Study eyes were divided into two groups according to the type of CNV.
Fourteen eyes were type 1 CNV and seven eyes were type 2 CNV. All eyes underwent a complete ophthal- mologic examination, including an assessment of best-corrected visual acuity, SD-OCT, fluorescein angiogra- phy, and FAF imaging, before and 3 months after intravitreal anti-vascular endothelial growth factor injection.
Gray scales of FAF image for CNV areas, delineated as in fluorescein angiography, were analyzed using the ImageJ program, which were adjusted by comparison with normal background areas. Correlation of changes in FAF with changes in SD-OCT parameters, including CNV thickness, photoreceptor inner and outer segment junction disruption length, external limiting membrane disruption length, central macular thickness, subretinal fluid, and intraretinal fluid were analyzed.
Results: Eyes with both type 1 and type 2 CNV showed reduced FAF before treatment. The mean gray scales (%) of type 1 and type 2 CNV were 52.20% and 42.55%, respectively. The background values were 106.72 and 96.86. After treatment, the mean gray scales (%) of type 1 CNV and type 2 CNV were changed to 57.61% (p
= 0.005) and 57.93% (p = 0.008), respectively. After treatment, CNV thickness, central macular thickness, and inner and outer segment junction disruption length were decreased while FAF increased.
Conclusions: FAF was noted to be reduced in eyes with newly diagnosed wet age-related macular degenera- tion, but increased after anti-vascular endothelial growth factor therapy regardless of CNV lesion type.
Key Words: Anti-vascular endothelial growth factor, Choroidal neovascularization, Macular degeneration, Opti- cal imaging, Spectral domain optical coherence tomography
Received: July 24, 2015 Accepted: September 4, 2015
Corresponding Author: Hyung Chan Kim, MD, PhD. Department of Ophthalmology, Konkuk University Medical Center, Konkuk University School of Medicine, #120-1 Neungdong-ro, Gwangjin-gu, Seoul 05030, Korea. Tel: 82-2-2030-8181, Fax: 82-2-2030-5273, E-mail: [email protected]
This study was presented at the Korean Ophthalmological Society annual meeting, April 12-13, 2014 at Busan, Korea.
Neovascular age-related macular degeneration (AMD) is the leading cause of severe vision loss in countries with high life expectancy [1,2]. Neovascular AMD is character- ized by the development of choroidal neovascularization (CNV), often leading to intra- or sub-retinal exudation and hemorrhage [3]. CNV is the growth of new blood vessels;
growth from the choroid develops in the plane between the retinal pigment epithelium (RPE) and the Bruch mem- brane (subRPE CNV, type 1 growth pattern), between the retina and RPE (subretinal CNV, type 2 growth pattern), or a combination of both (combined growth pattern) [4,5].
In previous studies, the effectiveness of intravitreal an- ti-vascular endothelial growth factor (VEGF) (ranibizum- ab; Lucentis, Genentech, South San Francisco, CA, USA) injection for the treatment of neovascular AMD has been proven [6,7]. In a 2-year study, ranibizumab provided greater clinical benefits than verteporfin photodynamic therapy in patients with AMD with new-onset, predomi- nantly classic CNV [8]. Rates of serious adverse events were low. Ranibizumab (Lucentis) and bevacizumab (Avastin, Genentech) had similar effects on visual acuity over a 2-year period [9].
Fundus autofluorescence (FAF) is a noninvasive imaging method to metabolically map naturally or pathologically occurring fluorophores of the ocular fundus. The dominant source of fluorophores is A2-E in lipofuscin granules, which accumulate in the postmitotic RPE as a by-product of the incomplete degradation of photoreceptor outer seg- ments [10,11]. Progressive accumulation of lipofuscin with- in RPE cells is involved in the pathogenesis of AMD [12- 14].
FAF is a potentially useful noninvasive tool to distin- guish between classic and occult CNV in AMD. Specifi- cally, characteristics of classic CNV include a significantly decreased FAF, presumably due to their localization above the RPE level, leading to FAF blockage [15].
Although several studies have reported about FAF in pa- tients with acute and chronic CNV, no study has compared FAF of acute onset CNV before and after intravitreal an- ti-VEGF treatment. The purpose of this study was to de- scribe the FAF changes in patients with AMD before and after intravitreal anti-VEGF treatment according to the type of CNV, and to evaluate the correlation of FAF with spectral domain optical coherence tomography (SD-OCT) parameters and vision.
Materials and Methods
Patients
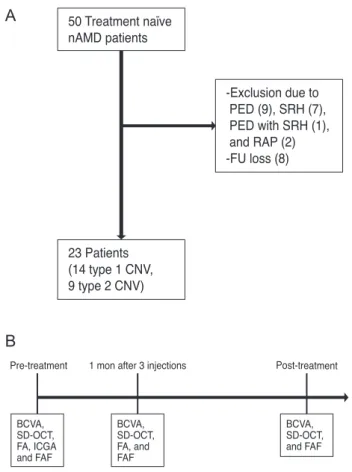
This retrospective study of medical records involved a se- ries of 50 treatment naïve patients with CNV due to neovas- cular AMD who came to the department of ophthalmology, Konkuk University Medical Center from January 2010 to December 2013. Twenty seven patients were excluded due to the presence of large pigment epithelial detachment (n = 9), massive subretinal hemorrhage (n = 7), pigment epithe- lial detachment with subretinal hemorrhage (n = 1), the presence of retinal angiomatous proliferation (n = 2), and loss of follow-up (n = 8) (Fig. 1A and 1B). The remaining 23 patients had a recent onset of symptoms (less than 1 month). The patients were divided into two groups accord- ing to the type of CNV, and were further classified into type 1 (14 eyes) and type 2 (9 eyes) using SD-OCT and flu- orescein angiography (FA). Type 3 CNV or retinal angio- matous proliferation was excluded according to SD-OCT, FA, and indocyanine green angiography at a baseline ex- amination. All patients underwent three consecutive monthly intravitreal anti-VEGF (ranibizumab) injections, followed by as-needed injections. All patients underwent a complete ophthalmologic examination, including an as- sessment of best-corrected visual acuity (BCVA), SD- OCT, FA, indocyanine green angiography, and FAF imag- ing before the first intravitreal anti-VEGF injection (pre-treatment). One month after the three consecutive in- travitreal anti-VEGF injections, the BCVA, SD-OCT, and FA were assessed. Post-treatment gray scale of FAF (%) measured in the test was performed 1 month after the last injection (post-treatment).
Fundus autofluorescence imaging and SD-OCT mea- surement
FAF imaging was obtained with a Spectralis HRA-OCT (HRA2; Heidelberg Engineering, Heidelberg, Germany), which included SD-OCT and confocal scanning laser oph- thalmoscopy to visualize FAF. Confocal scanning laser ophthalmoscopy used blue light at a wavelength of 488 nm and barrier filter at 500 nm to illuminate the fundus and detect fluorescence signals from the retinal and RPE lay- ers.
In FAF images, the CNV area was delineated using FA
and SD-OCT images, and gray scales of the CNV area were measured before and after treatment. Gray scales of the FAF images were analyzed using the ImageJ (Wayne Rasband, Bethesda, MD, USA), which were adjusted by comparison with normal background areas (four random sites of the peripheral area, 200 µm in diameter), with black being “0” and white being “255.” The comparison of the ratio of gray scale (%), calculated as ([gray scale of le- sion] / [average of four background areas] × 100), was made before and after treatment (3 months after the final
intravitreal anti-VEGF injection). Background areas were defined as four vessel-free areas, 200 µm in diameter, which are 4 mm apart from the fovea at superotemporal, superonasal, inferotemporal, and inferonasal locations (Fig.
2A-2C).
OCT imaging was obtained with a spectral domain com- bined scanning laser ophthalmoscopy (Spectralis HRA + OCT; Heidelberg Engineering). SD-OCT parameters, in- cluding CNV thickness, photoreceptor inner and outer segment junction (IS/OS) disruption length, external limit- ing membrane (ELM) disruption length, central macular thickness (CMT), subretinal fluid (SRF), and intraretinal fluid (IRF), were measured. The correlation of changes in SD-OCT parameters and changes in FAF were also ana- lyzed.
Statistical analyses
All data are expressed as the mean ± standard error of the mean. The PASW Statistics ver. 18.0 (SPSS Inc., Chica- go, IL, USA) was used for the analyses. Baseline charac- teristics and SD-OCT parameters between the two groups were compared using the Mann-Whitney test. The mean change in gray scale of FAF was compared between base- line and post-treatment with the Wilcoxon signed ranks test. A p-value of less than 0.05 was considered statistically significant.
Fig. 1. (A) A total of 50 neovascular age-related macular de- generation (nAMD) patients visited our clinic, and 27 patients were excluded. (B) All patients in this study underwent a com- plete ophthalmologic examination, including an assessment of best-corrected visual acuity (BCVA), spectral domain optical coherence tomography (SD-OCT), fluorescein angiography (FA), indocyanine green angiography (ICGA) and fundus autofluores- cence (FAF) imaging before the first intravitreal anti-vascular endothelial growth factor injection (pre-treatment) and BCVA, SD-OCT, and FA 1 month after the initial three intravitreal an- ti-vascular endothelial growth factor injections. Post-treatment gray scale of FAF (%) was measured in the test that was per- formed 1 month after the last injection (post-treatment). PED = pigment epithelial detachment; SRH = subretinal hemorrhage;
RAP = retinal angiomatous proliferation; FU = follow-up; CNV
= choroidal neovascularization.
Pre-treatment 1 mon after 3 injections Post-treatment
BCVA, SD-OCT, FA, ICGA and FAF
BCVA, SD-OCT, FA, and FAF
BCVA, SD-OCT, and FAF
-Exclusion due to PED (9), SRH (7), PED with SRH (1), and RAP (2) -FU loss (8)
23 Patients (14 type 1 CNV, 9 type 2 CNV)
A
B
Fig. 2. Gray scale measurements of fundus autofluorescence (FAF) images for choroidal neovascularization (CNV) areas de- lineated in fluorescein angiography (FA) and spectral domain op- tical coherence tomography (SD-OCT) were analyzed using the ImageJ program. (A) FAF image of CNV. White line indicates the boundary of CNV. (B) FA image of CNV. White line indi- cates the boundary of CNV. (C) SD-OCT image of CNV. White vertical lines indicate the diameter of CNV.
A
C B
Results
Twenty three eyes of 23 patients (14 men and 9 women) were analyzed. The mean age of the subjects was 66.52 ± 9.28 years. There were no significant differences in the mean age, sex, initial BCVA, and the number of injections between the type 1 and type 2 CNV groups. CNV thick- ness was significantly thicker in the type 2 CNV group than in the type 1 CNV group (p < 0.001), while other SD- OCT characteristics were not significantly different be- tween two groups. The patients’ baseline characteristics are summarized in Table 1.
The gray scale data of FAF in background areas are pre-
sented in Table 2. The mean gray scales (%) of FAF in type 1 CNV and type 2 CNV before treatment were 52.20 ± 12.22% and 42.55 ± 11.89%, respectively. After treatment, the mean gray scales of type 1 CNV and type 2 CNV were 57.61 ± 14.27 and 57.93 ± 10.35, respectively. The statistical analyses showed a significant increase in the mean gray scale of both groups after treatment (p = 0.005 and p = 0.008, respectively) (Figs. 3A-3D and 4A-4E).
There were no significant differences in SD-OCT pa- rameters before and after treatment in type 1 CNV. In type 2 CNV, CNV thickness, IS/OS disruption length, and CMT were significantly decreased after treatment (p = 0.004, p = 0.031, p = 0.008, respectively). In terms of visual
Table 1. Baseline characteristics of patients
Type 1 CNV Type 2 CNV p-value
No. of patients (eyes) 14 (14) 9 (9) -
Male : female 11 : 3 3 : 6 0.050*
Age (yr) 68.43 ± 9.77 63.56 ± 8.08 0.283†
Follow-up period (mon) 12.50 ± 18.81 10.37 ± 7.19 0.723†
No. of injections 5.29 ± 2.95 4.95 ± 2.60 0.608†
Visual acuity (logMAR) at baseline 0.53 ± 0.31 0.95 ± 0.61 0.120†
SD-OCT parameters (μm)
CNV thickness 134.79 ± 46.20 349.44 ± 137.97 <0.001†
IS/OS disruption length 1,038.29 ± 1,321.54 2,019.33 ± 1,046.48 0.119†
ELM disruption length 383.86 ± 983.44 1,458.89 ± 1,191.32 0.029†
CMT 346.42 ± 30.49 349.44 ± 137.97 0.032†
Values are presented as the mean ± standard deviation.
CNV = choroidal neovascularization; logMAR = logarithm of the minimum angle of resolution; SD-OCT = spectral domain optical co- herence tomography; IS/OS = photoreceptor inner and outer segment junction; ELM = external limiting membrane; CMT = central mac- ular thickness.
*Chi-square test; †Mann-Whitney test.
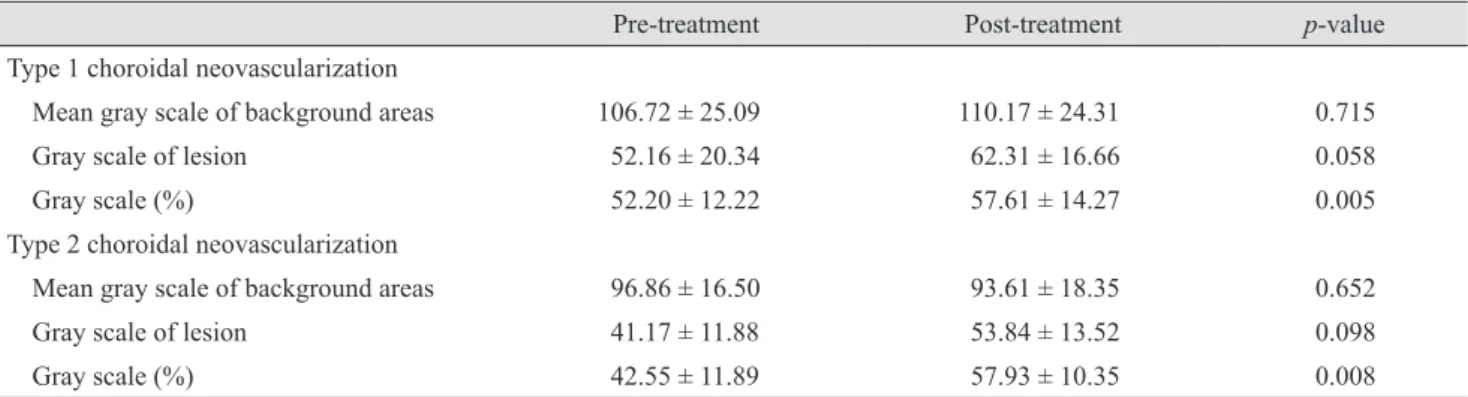
Table 2. Changes in fundus autofluorescence before and after treatment
Pre-treatment Post-treatment p-value
Type 1 choroidal neovascularization
Mean gray scale of background areas 106.72 ± 25.09 110.17 ± 24.31 0.715
Gray scale of lesion 52.16 ± 20.34 62.31 ± 16.66 0.058
Gray scale (%) 52.20 ± 12.22 57.61 ± 14.27 0.005
Type 2 choroidal neovascularization
Mean gray scale of background areas 96.86 ± 16.50 93.61 ± 18.35 0.652
Gray scale of lesion 41.17 ± 11.88 53.84 ± 13.52 0.098
Gray scale (%) 42.55 ± 11.89 57.93 ± 10.35 0.008
Values are presented as the mean ± standard deviation; Gray scale (%) = (gray scale of lesion / average of 4 background areas) × 100;
Mann-Whitney test, p < 0.05.
acuity (VA) (logarithm of the minimum angle of resolution [logMAR]), there was a significant improvement after treatment in type 2 CNV (p = 0.011) (Table 3). Post-treat- ment VA (logMAR) of type 1 CNV correlated with post-treatment IS/OS disruption length, ELM disruption length, CNV thickness, and CMT (p = 0.004, p = 0.005, p
= 0.017, p = 0.013, respectively). In type 2 CNV, pre-treat- ment IS/OS disruption length and ELM disruption length were significantly associated with post-treatment VA (log- MAR) (p = 0.021, p = 0.022) (Table 4).
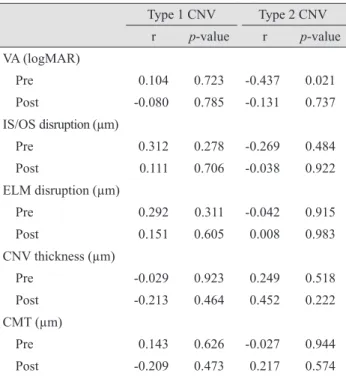
After treatment, there was a significant correlation of FAF gray scale with VA (logMAR) in type 2 CNV (r = -0.437, p = 0.021). Brighter post-treatment FAF was associ- ated with better post-treatment VA (Table 5).
Discussion
FAF is a noninvasive imaging technology that provides information on the lipofuscin within RPE cells [12,15]. Va- clavik et al. [16] reported that the intact FAF at the macula in early CNV correlates with VA, lesion size, and symp- tom length, but not lesion type. In late stage CNV, de- creased FAF indicates the loss of RPE and photoreceptors [17]. Presently, the baseline FAF of CNV was decreased more than the reference area, and the FAF of CNV was in- creased after treatment in both types of CNV.
SD-OCT parameters are known to be associated with visual outcome in patients with AMD. Visual outcome correlates with IS/OS and ELM disruption length [18,19].
In the current study, post-treatment VA correlated with IS/
OS disruption length, ELM disruption length, CNV thick- ness, and CMT in type 1 CNV. In type 2 CNV, a signifi- cant correlation was seen between post-treatment FAF and pre-treatment VA (logMAR).
Post-treatment FAF was increased in eyes with better pre-treatment VA. This result suggests that post-treatment RPE/photoreceptor function was maintained in eyes with good initial VA, and RPE/photoreceptor function was damaged in eyes with worse initial VAs. Initial CMT in type 2 CNV was negatively associated with post-treatment FAF, indicating that the RPE/photoreceptor complex was damaged more in eyes with thicker pre-treatment CMT.
Subretinal or intra-retinal fluid was usually evident in the initial SD-OCT. This SRF or IRF was almost completely absorbed after treatment. We presume that the decreased Fig. 4. Changes in fundus autofluorescence and spectral domain
optical coherence tomography (SD-OCT) after intravitreal an- ti-vascular endothelial growth factor injection in an exudative age-related macular degeneration patient with type 2 choroidal neovascularization (CNV). After treatment, CNV size was de- creased and macular edema disappeared. Also, the brightness of fundus autofluorescence was increased after treatment. (A) Fluorescein angiography of pre-treatment type 2 CNV patient. (B) Fundus autofluorescence of pre-treatment type 2 CNV patient.
(C) SD-OCT image of pre-treatment type 2 CNV patient. CNV, intraretinal fluid, and subretinal fluid were seen. (D) Fundus aut- ofluorescence of post-treatment type 2 CNV patient. The arrow indicates increased fundus autofluorescence in CNV area. (E) SD-OCT image of post-treatment type 2 CNV patient. CNV, in- traretinal fluid, and subretinal fluid were absorbed.
A
C
B D
E
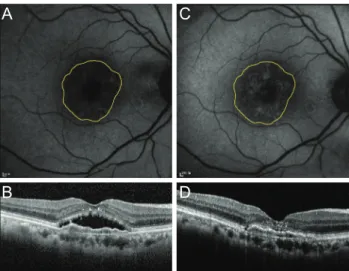
Fig. 3. Changes in fundus autofluorescence and spectral domain optical coherence tomography (SD-OCT) after intravitreal an- ti-vascular endothelial growth factor injection in an exudative age-related macular degeneration patient with type 1 choroidal neovascularization (CNV). After treatment, as subretinal fluid was absorbed as shown on SD-OCT, the brightness of autoflu- orescence in the area of CNV was increased. (A) Fundus auto- fluorescence of pre-treatment CNV. Initial best-corrected visual acuity (BCVA) was 20 / 100. (B) SD-OCT of pre-treatment CNV.
CNV with subretinal fluid was seen. (C) Fundus autofluorescence of post-treatment CNV. Final BCVA was 20 / 60. (D) Post-treat- ment SD-OCT. Subretinal fluid was completely absorbed.
A C
B D
SRF and IRF could result in an increase in post-treatment FAF. After SRF and IRF were absorbed, the increase in FAF suggested that the function of the RPE/photoreceptor complex was preserved. FAF of type 2 CNV was increased more than the FAF of type 1 CNV. In addition, post-treat- ment VA in type 2 CNV showed more improvement than
type 1 CNV. The above findings collectively suggest that the increased post-treatment FAF might be an indicator of preserved RPE/photoreceptor function with possible long- term favorable visual prognosis, although there was no significant correlation between FAF and vision observed in the present study.
Cystoid macular edema located at fovea can brighten the signal of 480 nm FAF [20]. In our study, two patients had cystoid macular edema spanning fovea. The initial FAF of these two patients could be increased by the cystoid macu- lar edema effect. However, the amount of FAF reduction in the two patients was not statistically different from that of the other five patients (p = 0.242). Therefore, the effects of cystoid macular edema on the FAF in this study are not considered to have been significant enough to affect the FAF change by CNV reduction.
The current study has several limitations, including its retrospective nature and the small study population. To ob- tain a clear image of FAF, limited numbers of patients were included in this study. Another limitation was that this study was uncontrolled. Therefore, the initial FAF of CNV lesions could not be compared with normal foveal FAF. The presence of complicating fluid and hemorrhage made the evaluation of CNV lesions difficult in this study.
The cause of this difficulty lies in the fact that these com- ponents basically block FAF. Even if the serious bleeding or swelling can be excluded, a small amount of bleeding can interfere with the interpretation of results. Before the Table 3. Changes in VA and SD-OCT parameters before and after treatment
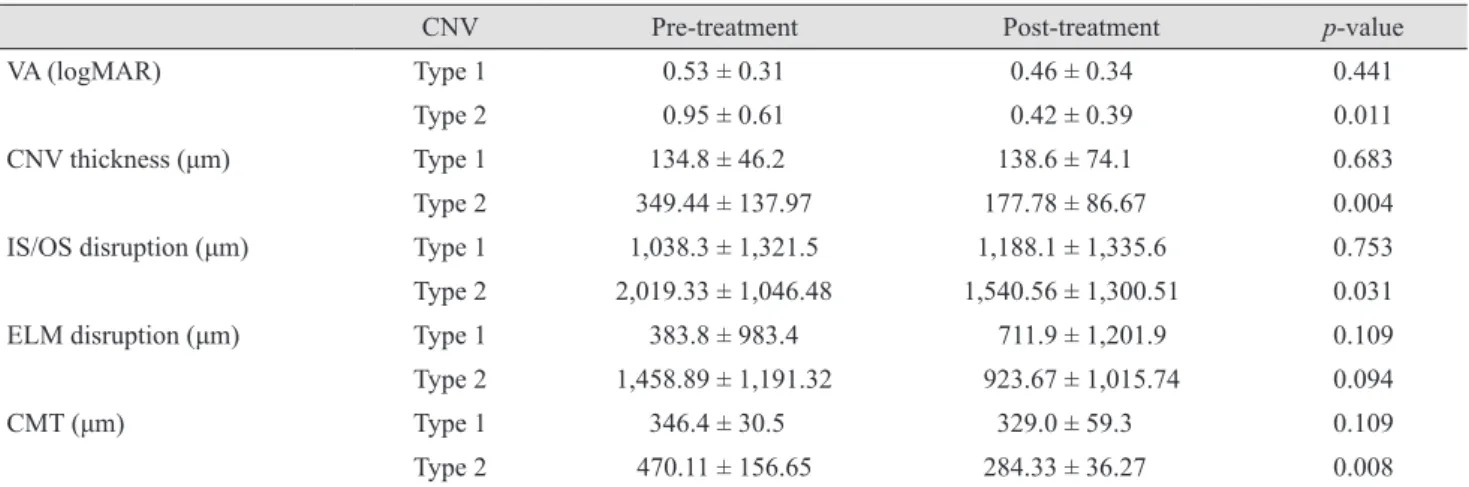
CNV Pre-treatment Post-treatment p-value
VA (logMAR) Type 1 0.53 ± 0.31 0.46 ± 0.34 0.441
Type 2 0.95 ± 0.61 0.42 ± 0.39 0.011
CNV thickness (μm) Type 1 134.8 ± 46.2 138.6 ± 74.1 0.683
Type 2 349.44 ± 137.97 177.78 ± 86.67 0.004
IS/OS disruption (μm) Type 1 1,038.3 ± 1,321.5 1,188.1 ± 1,335.6 0.753
Type 2 2,019.33 ± 1,046.48 1,540.56 ± 1,300.51 0.031
ELM disruption (μm) Type 1 383.8 ± 983.4 711.9 ± 1,201.9 0.109
Type 2 1,458.89 ± 1,191.32 923.67 ± 1,015.74 0.094
CMT (μm) Type 1 346.4 ± 30.5 329.0 ± 59.3 0.109
Type 2 470.11 ± 156.65 284.33 ± 36.27 0.008
Values are presented as the mean ± standard deviation; Wilcoxon signed rank test, p < 0.05.
VA = visual acuity; SD-OCT = spectral domain optical coherence tomography; CNV = choroidal neovascularization; logMAR = loga- rithm of the minimum angle of resolution; IS/OS = photoreceptor inner and outer segment junction; ELM = external limiting membrane;
CMT = central macular thickness.
Table 4. Correlation of post VA (logMAR) with pre and post spectral domain optical coher ence tomography parameters
Type 1 CNV Type 2 CNV
r p-value r p-value
IS/OS disruption (µm)
Pre 0.282 0.328 0.590 0.095
Post 0.717 0.004 0.745 0.021
ELM disruption (µm)
Pre 0.451 0.105 0.861 0.003
Post 0.705 0.005 0.743 0.022
CNV thickness (µm)
Pre 0.409 0.146 -0.457 0.217
Post 0.624 0.017 0.518 0.153
CMT (µm)
Pre 0.517 0.058 0.677 0.045
Post 0.642 0.013 -0.271 0.481
Spearman rank correlation, p < 0.05.
VA = visual acuity; logMAR = logarithm of the minimum an- gle of resolution; CNV = choroidal neovascularization; IS/OS = photoreceptor inner and outer segment junction; ELM = external limiting membrane; CMT = central macular thickness.
treatments began, the lesion was composed of exudation, hemorrhage, and CNV; however, after three monthly doses were given, the lesion had become drier than in the pre-treatment period. In addition, the lesion is generally composed of CNV and fibrosis as a result of treatment.
With the exudation and hemorrhage reduced, which led to a decrease in the “blockage” of FAF, it is predicted that the lesion can be brightened with the treatments.
In conclusion, FAF of both CNV types with SRF were low before treatment. FAF tended to increase with an- ti-VEGF treatment in both types. Considering that most of the patients had the disease for a relatively short period, these results indicate that a decreased FAF before treat- ment does not result in the destruction or dysfunction of the RPE/photoreceptor complex. The increased FAF after treatment is thought to be caused by resolved subretinal and IRFs in most cases. These findings indicate that the function of the RPE/photoreceptor complex in both types of CNV might be preserved if treated promptly.
Conflict of Interest
No potential conflict of interest relevant to this article was reported.
References
1. Klaver CC, Wolfs RC, Vingerling JR, et al. Age-specific prevalence and causes of blindness and visual impairment in an older population: the Rotterdam Study. Arch Oph- thalmol 1998;116:653-8.
2. Attebo K, Mitchell P, Smith W. Visual acuity and the caus- es of visual loss in Australia: the Blue Mountains Eye Study. Ophthalmology 1996;103:357-64.
3. Veritti D, Sarao V, Lanzetta P. Neovascular age-related macular degeneration. Ophthalmologica 2012;227 Suppl 1:11-20.
4. Grossniklaus HE, Green WR. Choroidal neovasculariza- tion. Am J Ophthalmol 2004;137:496-503.
5. Lim JI. Choroidal neovascularization. In: Lim JI, editor.
Age-related macular degeneration. 2nd ed. Boca Raton:
CC Press; 2007. p. 87-96.
6. Rosenfeld PJ, Brown DM, Heier JS, et al. Ranibizumab for neovascular age-related macular degeneration. N Engl J Med 2006;355:1419-31.
7. Abraham P, Yue H, Wilson L. Randomized, double-masked, sham-controlled trial of ranibizumab for neovascular age-related macular degeneration: PIER study year 2. Am J Ophthalmol 2010;150:315-24.e1.
8. Brown DM, Michels M, Kaiser PK, et al. Ranibizumab versus verteporfin photodynamic therapy for neovascular age-related macular degeneration: two-year results of the ANCHOR study. Ophthalmology 2009;116:57-65.e5.
9. Comparison of Age-related Macular Degeneration Treat- ments Trials (CATT) Research Group, Martin DF, Maguire MG, et al. Ranibizumab and bevacizumab for treatment of neovascular age-related macular degeneration: two-year re- sults. Ophthalmology 2012;119:1388-98.
10. Schmitz-Valckenberg S, Fleckenstein M, Scholl HP, Holz FG. Fundus autofluorescence and progression of age-relat- ed macular degeneration. Surv Ophthalmol 2009;54:96-117.
11. Delori FC, Dorey CK, Staurenghi G, et al. In vivo fluores- cence of the ocular fundus exhibits retinal pigment epithe- lium lipofuscin characteristics. Invest Ophthalmol Vis Sci 1995;36:718-29.
Table 5. Correlation of post fundus autofluorescence with pre and post SD-OCT parameters and VA
Type 1 CNV Type 2 CNV
r p-value r p-value
VA (logMAR)
Pre 0.104 0.723 -0.437 0.021
Post -0.080 0.785 -0.131 0.737
IS/OS disruption (µm)
Pre 0.312 0.278 -0.269 0.484
Post 0.111 0.706 -0.038 0.922
ELM disruption (µm)
Pre 0.292 0.311 -0.042 0.915
Post 0.151 0.605 0.008 0.983
CNV thickness (µm)
Pre -0.029 0.923 0.249 0.518
Post -0.213 0.464 0.452 0.222
CMT (µm)
Pre 0.143 0.626 -0.027 0.944
Post -0.209 0.473 0.217 0.574
Spearman rank correlation, p < 0.05.
SD-OCT = spectral domain optical coherence tomography; VA = visual acuity; CNV = choroidal neovascularization; logMAR = logarithm of the minimum angle of resolution; IS/OS = the junc- tion between the inner and outer segments of the photoreceptors;
ELM = external limiting membrane; CMT = central macular thickness.
12. Boulton M, McKechnie NM, Breda J, et al. The formation of autofluorescent granules in cultured human RPE. Invest Ophthalmol Vis Sci 1989;30:82-9.
13. von Ruckmann A, Fitzke FW, Bird AC. In vivo fundus aut- ofluorescence in macular dystrophies. Arch Ophthalmol 1997;115:609-15.
14. Feeney-Burns L, Berman ER, Rothman H. Lipofuscin of human retinal pigment epithelium. Am J Ophthalmol 1980;
90:783-91.
15. Framme C, Bunse A, Sofroni R, et al. Fundus autofluores- cence before and after photodynamic therapy for choroidal neovascularization secondary to age-related macular degen- eration. Ophthalmic Surg Lasers Imaging 2006;37:406-14.
16. Vaclavik V, Vujosevic S, Dandekar SS, et al. Autofluores- cence imaging in age-related macular degeneration compli-
cated by choroidal neovascularization: a prospective study.
Ophthalmology 2008;115:342-6.
17. Dandekar SS, Jenkins SA, Peto T, et al. Autofluorescence imaging of choroidal neovascularization due to age-related macular degeneration. Arch Ophthalmol 2005;123:1507-13.
18. Shin HJ, Chung H, Kim HC. Association between foveal microstructure and visual outcome in age-related macular degeneration. Retina 2011;31:1627-36.
19. Hayashi H, Yamashiro K, Tsujikawa A, et al. Association between foveal photoreceptor integrity and visual outcome in neovascular age-related macular degeneration. Am J Ophthalmol 2009;148:83-9.e1.
20. McBain VA, Forrester JV, Lois N. Fundus autofluorescence in the diagnosis of cystoid macular oedema. Br J Ophthal- mol 2008;92:946-9.