ISSN 1225-6552, eISSN 2287-7630 https://doi.org/10.7853/kjvs.2019.42.2.121
< Short communication >
Veterinary Service
Available online at http://kjves.org
*Corresponding author: Suhee Kim, Tel. +82-63-238-7227, Fax. +82-63-238-7235, E-mail. [email protected] These first two authors contributed equally to this work.
국내 젖소의 혈액 대사인자 프로파일 분석
정숙한ㆍ정영훈ㆍ최창용ㆍ도윤정ㆍ조아라ㆍ오상익ㆍ김은주ㆍ하승민ㆍ정하연ㆍ류재규ㆍ김수희 *
농촌진흥청 국립축산과학원
Reference intervals for blood metabolic profiles of Holstein cows in Korea
Suk-Han Jung, Young-Hun Jung, Changyong Choe, Yoon Jung Do, Ara Cho, Sang-Ik Oh, Eunju Kim, Seungmin Ha, Ha Yeon Jeong, Jae Gyu Yoo, Suhee Kim*
National Institute of Animal Science, Rural Development Administration, Wanju 55365, Korea
(Received 30 November 2018; revised 9 April 2019; accepted 10 April 2019)
Abstract
Metabolic profile test is used to evaluate nutritional imbalance and metabolic disease in dairy cows. The reference intervals of metabolic parameters may change according to nation, region, decades, and main- tenance system. Despite the need to be periodically updated for the reference intervals of metabolic pa- rameters, it has rarely been investigated in Korea. Therefore, this aim of study was to provide the refer- ence intervals of metabolic parameters using dairy cows surveyed in Korea during recent years. A meta- bolic profile test was conducted for 2,976 clinically healthy dairy cows in Korea. Blood samples were collected for the analysis of serum metabolites. This study provided reference intervals of thirteen meta- bolic parameters (-hydroxybutyrate [-HB], non-esterified fatty acids [NEFA], glucose, total cholesterol [T-COL], total protein, albumin, globulin, blood urea nitrogen [BUN], aspartate aminotransferase [AST], gamma-glutamyl transferase [GGT], calcium, phosphorus, and magnesium). BUN and AST values of the current study were higher than those of previous studies. In the present study, the other metabolic pa- rameters showed low or similar value compared to previous results. Moreover, -HB, NEFA, T-COL, ALB, BUN, AST, and GGT values were affected by lactation period. This study provided information on the reference intervals of metabolites in healthy dairy cows in Korea. The reference intervals from the present study would be useful in managing and diagnosing disease of dairy cows. However, careful attention should be given in interpreting disease condition for metabolites affected by lactation.
Key words : Dairy cow, Metabolic profile, Lactation, Reference intervals
서 론
임신과 비유는 체내 대사를 변형시키고 스트레스 를 유발하며, 주로 임신 후반, 비유 첫 주에 급격한 신체 상태의 변화를 야기시키는 것으로 알려져있다 (Quiroz-Rocha 등, 2009). 분만 후 비유초기에는 유량 의 급격한 증가와 더불어 영양소 요구량이 증가하는
시기로, 양질의 사료 섭취가 충분히 이루어지지 못하
는 경우 에너지 불균형이 발생할 수 있다(Esposito 등,
2014). 이는 생체충실지수의 감소, 저 칼슘혈증(유열),
저마그네슘혈증, 케톤증 및 지방간증과 같은 대사성
질환들의 발생 위험을 증가시키는 요인이 된다(Duffield,
2000). 특히, 젖소는 우유 생산을 위해 반복적인 분만
과 비유를 겪으며 다양한 대사성 질환의 위험에 노출
되어 있어, 젖소에서 비유시기 동안 대사질환을 예방
하기 위한 건강 상태의 정기적인 파악은 매우 중요한
부분이라고 할 수 있겠다.
대사 프로파일 검사는 젖소의 영양 및 질병 상태를 평가하는데 유용한 방법으로 알려져 있다(Kayano와 Kida, 2015). 그러나 지역, 품종, 나이, 유기단계, 계절, 성별을 비롯하여 장비, 시약, 실험수행자와 같은 특 수한 실험실 환경 또한 혈액 내 대사인자 농도에 상 당한 영향을 미치므로 건강상태를 평가하는 데 주의 가 필요하다(Brscic 등, 2015). 최근에 이러한 상황을 고려한 표준화된 참고수치를 재설정함으로써 오차를 최소화하고자 하는 필요성이 제기되고 있으며(Quiroz- Rocha 등, 2009), 대사인자들에 대한 혈청생화학 참고 수치가 일부 논문에서 보고되어 왔다(Quiroz-Rocha 등, 2009; Cozzi 등, 2011). 그러나 현재 활용하고 있는 참고수치는 국외 연구를 바탕으로 도출된 결과들이 대부분이거나, 젖소의 일부 유기단계에 한정해서 조 사된 결과들이 주를 이루고 있다. 또한 최근 20년간 일본에서 연구한 결과에 따르면, 고능력 비유우로의 유전능력 향상으로 인해 에너지 및 간 기능과 관련된 대사 프로파일 수치들이 변화하고 있음이 보고되고 있어(Kayano와 Kida, 2015), 이러한 변화된 실정에 맞 는 참고수치의 재설정이 필요할 것으로 보인다.
현재까지 국내 젖소를 대상으로 참고범위를 제공 한 데이터는 보고된 바가 없으며, 따라서, 본 연구에 서는 현재 국내에서 사육중인 젖소의 대사인자 혈청 생화학수치를 분석하여, 혈액 내 대사인자들의 최근 참고범위를 제시함으로써, 국내 젖소의 건강관리를 위한 기초자료로 제공하고자 한다.
재료 및 방법
공시재료
본 연구는 2010년부터 2014년까지 5년에 걸쳐 전 국의 5개 도(경기, 경북, 전북, 충남, 충북), 12개 시 (고창, 김천, 김포, 논산, 상주, 안성, 여주, 영동, 영주, 이천, 천안, 평택)의 82개 목장에서 사육중인 젖소를 대상으로 수행하였다. 도별 참여목장수는 경기 11, 경북 15, 전북 26, 충남 29, 충북 1개 목장이었다. 임 상적으로 건강하다고 판단되는 암컷 젖소 2,976두가 본 연구에 사용되었고, 계절별로 봄(3∼5월) 692두, 여름(6∼8월) 1563두, 가을(9∼11월) 658두, 겨울(12∼
2월) 63두로부터 시료를 수집하였다. 산차별로는 1∼
2산차 1,206두, 3∼5산차 797두, 6산차 이상 973두였
으며, 시료 채취 당일 일평균 유량, 신체충실지수 (Edmonson 등, 1989), 전분만일, 분만예정일이 조사되 었다.
생화학검사
젖소의 경정맥에서 18 게이지가 부착된 10 mL 주 사기를 이용하여 혈액을 채취한 후 혈청분리튜브 (Becton Dicknson, Franklin Lakes, NJ, USA)에 넣어 상 온에서 약 2시간 방치하여 혈액을 응고시켰다. 3,000 rpm에서 15분간 원심분리하여 1.5 mL 튜브에 혈청을 옮겨 담은 후 분석 시까지 −80°C에 보관하였다. 자 동 혈청생화학분석기(HITACHI 7180, Tokyo, Japan)를 이용하여 혈청 내 -hydroxybutyrate (-HB), non-es- terified fatty acid (NEFA), glucose (GLU), total choles- terol (T-COL), total protein (T-PROT), albumin (ALB), globulin (GLOB), blood urea nitrogen (BUN), aspartate aminotransferase (AST), gamma-glutamytransferase (GGT), calcium (Ca), phosphorus (P), magnesium (Mg)을 포함 하는 13개 항목을 측정하였다.
통계
본 연구결과에 대한 통계 분석은 SPSS 24.0 soft- ware (IBM, Armonk, NY)를 사용하였다. 측정된 총 데 이터에서 각 대사인자별로 이상치가 계산되었고, 이 상치를 나타내는 개체를 제외한 2,976두로부터 2.5 (P
2.5)와 97.5 백분위수(P
97.5)에 해당하는 수치를 참고 범위로 설정하였다(Friedrichs 등, 2012). 젖소 유기별 단계 및 산차가 대사인자 수치 변화에 영향을 미치는 지 확인하기 위해, 유기와 산차 모수요인, 계절과 농 장을 변량요인으로 하는 일변량 분석을 수행하였다.
유기에 의해 유의적으로 영향을 받는 대사인자의 경 우, Dunnett test에 의한 유기별 평균비교를 실시하였 고, P<0.05 수준에서 유의성을 평가하였다.
결과 및 고찰
본 연구에서 대상으로 한 젖소는 비유초기 7.1%
(211두), 비유최성기 16.6% (494두), 비유중기 27.7%
(823두), 비유후기 39.9% (1,187두), 건유기 8.8% (261
두)로 총 5개의 다른 시기의 비유기로 구성되어 있으
며, 비유중기와 비유후기가 총 67.6%로 가장 많은 비
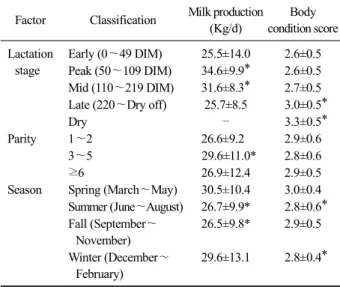
Table 1. Information on dairy cow population surveyed in this study
Factor Classification Milk production (Kg/d)
Body condition score Lactation
stage
Early (0∼49 DIM) 25.5±14.0 2.6±0.5 Peak (50∼109 DIM) 34.6±9.9* 2.6±0.5 Mid (110∼219 DIM) 31.6±8.3* 2.7±0.5 Late (220∼Dry off) 25.7±8.5 3.0±0.5*
Dry – 3.3±0.5*
Parity 1∼2 26.6±9.2 2.9±0.6
3∼5 29.6±11.0* 2.8±0.6
≥6 26.9±12.4 2.9±0.5
Season Spring (March∼May) 30.5±10.4 3.0±0.4 Summer (June∼August) 26.7±9.9* 2.8±0.6*
Fall (September∼
November)
26.5±9.8* 2.9±0.5
Winter (December∼
February)
29.6±13.1 2.8±0.4*
DIM=Days in milk, Data was presented as mean±standard deviation (SD). *P<0.05 vs early in lactation stage, *P<0.05 vs 1∼2 in parity, *P<0.05 vs spring in season factor.
율을 차지하고 있다. 일평균 유량과 신체충실지수는 각각 27.8±10.3 kg과 2.9±0.5의 수치를 나타내고 있으 며, Table 1에 각 유기별, 산차별, 계절별 일평균 유량 과 신체충실지수에 대한 정보를 기재하였다. 기존에 알려진 바와 같이, 일평균 유량 및 신체충실지수는 유기, 산차, 계절과 같은 요소에 의해 유의적인 차이 를 나타내었다(Roche 등, 2007; Mellado 등, 2011;
Liang 등, 2013). 일평균 유량은 1∼2 산차 젖소에 비 해 3∼5 산차 젖소에서 증가하였으며, 봄에 비해 여 름과 가을에 감소하였다(P<0.05). 신체충실지수는 분만 후 비유초기에 감소하기 시작하고 비유후기에 점차 증가하여 건유기에 가장 높은 수치를 나타내고 있다(P<0.05).
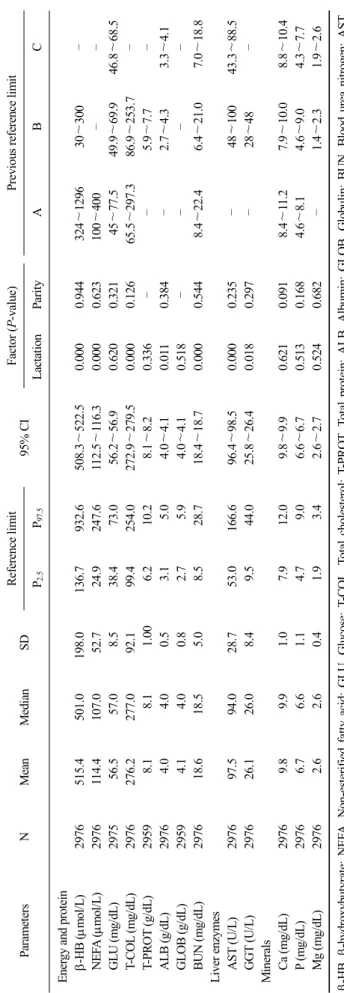
젖소에서 분석된 13개 대사인자 혈청생화학 수치 에 대한 참고범위는 Table 2와 같다. 탄수화물 및 지 방대사이상시 증가하는 주요 케톤체인 -HB, 지방동 원과 에너지 불균형과 관련된 NEFA, 음식 섭취 및 영양 프로그램과 관련된 GLU 및 T-COL과 같은 에너 지 프로파일 평가를 위해 활용되는 인자들(Kida, 2003) 과 더불어 신장 손상, 간 손상, 그리고 영양 건강상태 에 대한 정보에 도움을 주는 T-PROT, 간기능부전을 반영하는 ALB, 염증 반응시 증가하는 GLOB, 에너지 섭취 지표인 BUN와 같은 단백질 프로파일 평가에 필수적인 인자들(Puppel와 Kuczynska, 2016)에 대한 참고범위 정보를 Table 2에 제시하였다. 이 외에도 간 조직 손상 및 간기능 지표인 AST 및 GGT (Gonzalez
등, 2011), 미네랄 프로파일에 대표적인 인자들 중 대 사 반응을 신속히 반영하는 것으로 알려진 Ca, P, Mg (Reinhardt 등, 1988)에 대한 분석 결과와 더불어 기존 문헌에서 보고된 참고범위(Quiroz-Rocha 등, 2009; Cozzi 등, 2011; Brscic 등, 2015; Moretti 등, 2017)도 함께 제 공하여 본 연구결과와 비교 분석하였다.
일반적으로, 기존의 연구들에서는 -HB는 1200
mol/L, NEFA는 분만 전 300 mol/L, 분만 후 600
mol/L을 초과하는 경우 고케톤혈증 또는 에너지 불 균형과 같은 질병 위험성과 관련되어 있다고 알려져 있다(Cameron 등, 1998). 본 연구에서 확인해본 결과,
-HB는 932 mol/L, NEFA는 247 mol/L의 상한치를 보이고 있어 기존의 연구와 비교하였을 때 비슷한 상 한치를 나타내고 있었다. 혈중 Ca 농도의 경우 분만 직후 8.5 mg/dL 미만인 경우 질병 위험 수준 수치로 보고되어 있으나(Quiroz-Rocha 등, 2009), 현재 연구에 서는 Ca의 하한치가 7.9 mg/dL로 다소 낮게 나타났 다. 칼슘농도는 분만시 또는 분만 후 1일째 감소하거 나(Goff, 2004), 나이가 들수록 감소하는 것으로 잘 알 려져 있는데(Horst 등, 2005), 본 연구에서 표본으로 한 젖소의 경우 비유초기(분만에서 비유 49일)의 경 우 다른유기와 유의적인 차이 없이 비슷한 결과를 나 타내고 있으며(Table 2, P>0.05), 6산차 이상의 젖소 에서도 평균 10.0 mg/dL(7.8∼12.2)의 수치를 나타내 고 있어(data not shown), 본 연구에서는 유기와 연령 에 의한 Ca 수치의 감소는 나타나지 않았다.
국외에서 보고된 연구들의 참고수치와 비교해 본 결과, 본 연구의 BUN과 AST 수치는 더 높았고, NEFA와 GLU는 더 낮거나 비슷한 수치를 나타냈으 며, 나머지 대사인자는 대부분 비슷한 수치를 보였다 (Kida, 2003; Quiroz-Rocha 등, 2009; Cozzi 등, 2011;
Brscic 등, 2015; Kayano와 Kida, 2015; Moretti 등, 2017).
일부 대사인자의 참고수치에 차이가 나타나는 것은 국가간 서로 다른 사육 환경, 표본의 크기, 비유기 구 성 등 다양한 영향을 생각해 볼 수 있다. 또한 본 연 구에서 대상으로 한 젖소들의 경우, 농장, 지역, 사육 규모, 관리 시스템이 일정하지 않고 다양성을 띠고 있어 기존의 연구에 비해 대사인자 수치의 표준편차 가 넓은 것으로 보인다. 그러나, 본 수치는 국내의 다 양한 요소들이 적용된 수치로, 국내 사양관리 시스템 및 환경의 다양성을 대표하는 포괄적인 데이터로 활 용될 수 있을 것으로 판단된다.
비유단계는 참고범위 설정에 영향을 줄 수 있는 대
표적인 생리학적 상태로 알려져 있다(Friedrichs 등,
Table 2. Reference intervals for metabolic parameters in dairy cows ParametersNMeanMedianSDReference limit 95% CIFactor (P-value)Previous reference limit P2.5P97.5LactationParityABC Energy and protein -HB (mol/L)2976515.4501.0198.0136.7932.6508.3∼522.50.0000.944324∼129630∼300– NEFA (mol/L)2976114.4107.052.724.9247.6112.5∼116.30.0000.623100∼400–– GLU (mg/dL)297556.557.08.538.473.056.2∼56.90.6200.32145∼77.549.9∼69.946.8∼68.5 T-COL (mg/dL)2976276.2277.092.199.4254.0272.9∼279.50.0000.12665.5∼297.386.9∼253.7– T-PROT (g/dL)29598.18.11.006.210.28.1∼8.20.336––5.9∼7.7– ALB (g/dL)29764.04.00.53.15.04.0∼4.10.0110.384–2.7∼4.33.3∼4.1 GLOB (g/dL)29594.14.00.82.75.94.0∼4.10.518–––– BUN (mg/dL)297618.618.55.08.528.718.4∼18.70.0000.5448.4∼22.46.4∼21.07.0∼18.8 Liver enzymes AST (U/L)297697.594.028.753.0166.696.4∼98.50.0000.235–48∼10043.3∼88.5 GGT (U/L)297626.126.08.49.544.025.8∼26.40.0180.297–28∼48– Minerals Ca (mg/dL)29769.89.91.07.912.09.8∼9.90.6210.0918.4∼11.27.9∼10.08.8∼10.4 P (mg/dL)29766.76.61.14.79.06.6∼6.70.5130.1684.6∼8.14.6∼9.04.3∼7.7 Mg (mg/dL)29762.62.60.41.93.42.6∼2.70.5240.682–1.4∼2.31.9∼2.6 -HB, -hydroxybutyrate; NEFA, Non-esterified fatty acid; GLU, Glucose; T-COL, Total cholesterol; T-PROT, Total protein; ALB, Albumin; GLOB, Globulin; BUN, Blood urea nitrogen; AST, Aspartate aminotransferase; GGT, Gamma-glutamytransferase; Ca, Calcium; P, Pphosphorus; Mg, Magnesium; P2.5, Percentile2.5; 95% CI, 95% confidence interval; A (Ouiroz-Rocha et al, 2009): 90 clinically healthy cows, 30∼150 days in milk, 10 Ontario farms, B (Moretti et al, 2017), C (Cozzi et al, 2011; Brscic et al, 2015).
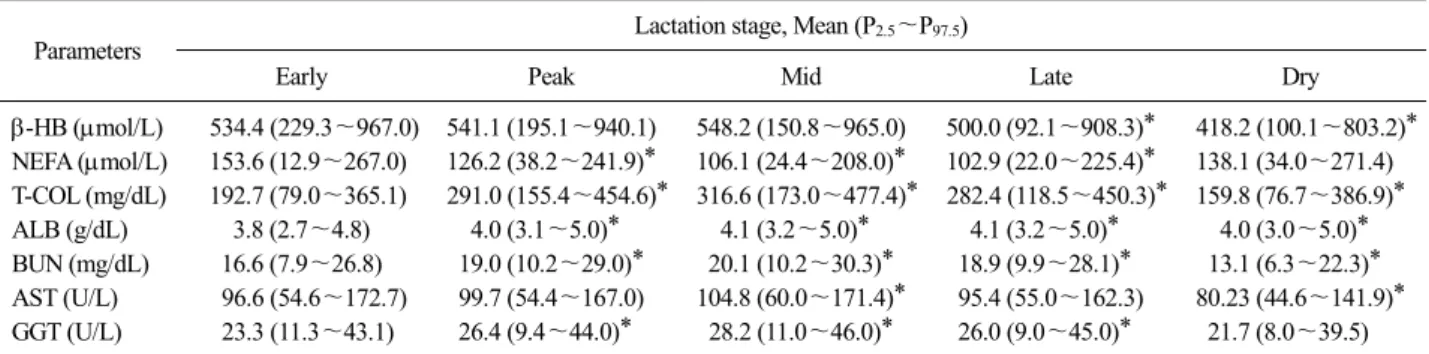
Table 3. Comparison of metabolic parameters among different stages of lactation in dairy cows
Parameters Lactation stage, Mean (P2.5∼P97.5)
Early Peak Mid Late Dry
-HB (mol/L) 534.4 (229.3∼967.0) 541.1 (195.1∼940.1) 548.2 (150.8∼965.0) 500.0 (92.1∼908.3)* 418.2 (100.1∼803.2)*
NEFA (mol/L) 153.6 (12.9∼267.0) 126.2 (38.2∼241.9)* 106.1 (24.4∼208.0)* 102.9 (22.0∼225.4)* 138.1 (34.0∼271.4) T-COL (mg/dL) 192.7 (79.0∼365.1) 291.0 (155.4∼454.6)* 316.6 (173.0∼477.4)* 282.4 (118.5∼450.3)* 159.8 (76.7∼386.9)*
ALB (g/dL) 3.8 (2.7∼4.8) 4.0 (3.1∼5.0)* 4.1 (3.2∼5.0)* 4.1 (3.2∼5.0)* 4.0 (3.0∼5.0)*
BUN (mg/dL) 16.6 (7.9∼26.8) 19.0 (10.2∼29.0)* 20.1 (10.2∼30.3)* 18.9 (9.9∼28.1)* 13.1 (6.3∼22.3)*
AST (U/L) 96.6 (54.6∼172.7) 99.7 (54.4∼167.0) 104.8 (60.0∼171.4)* 95.4 (55.0∼162.3) 80.23 (44.6∼141.9)*
GGT (U/L) 23.3 (11.3∼43.1) 26.4 (9.4∼44.0)* 28.2 (11.0∼46.0)* 26.0 (9.0∼45.0)* 21.7 (8.0∼39.5)
*P<0.05 vs early.
2012). 본 연구에서 조사한 바에 의하면, 미네랄을 제 외한 에너지 및 단백질 프로파일과 간 기능 효소에 속하는 일부 대사인자들의 참고수치가 유기에 의해 유의적인 영향을 받고 있는 것으로 확인이 되었다(P<
0.05, Table 2). 따라서 본 연구에서는 유기에 의해 유 의적으로 영향을 받는 대사인자에 한해서 유기별로 참고범위를 제시하였다(Table 3). 기존의 연구결과와 비슷하게 -HB와 NEFA는 각각 비유후기부터 건유 기까지, 그리고 비유최성기부터 비유후기까지 감소하 는 패턴을 보이며(P<0.05), T-COL, ALB, BUN, AST, GGT는 비유최성기 또는 비유중기에 증가되는 패턴 을 보여, 유기별로 참고범위가 다를 수 있음을 시사 하고 있다(P<0.05). 비유중기의 경우, 에너지 불균형 이 해소되는 시기로 비유초기에 비해 NEFA의 농도 가 상대적으로 감소하며(Walters 등, 2002), T-COL은 비유기동안 지질단백의 변화에 기인하여 비유중기까 지 비유가 진행되는 동안 증가하는 것으로 보고되어 있어(Cozzi 등, 2011), 정상적으로도 유기에 따른 대 사인자들의 수치에 변화가 있음을 뒷받침하고 있다.
결 론
동물의 건강상태를 판단하기 위한 가장 효과적인 방법 중 하나는 혈액 인자들을 모니터링 하는 것으 로, 젖소에서 대사 프로파일 분석은 영양상태 및 사 양관리를 평가하는 중요한 지표로 알려져 있다. 그러 나 이의 활용도와 정확성을 증가시키기 위해서는 최 근 실정에 맞는 참고범위의 재설정이 필요하며, 유기 단계별로 참고범위가 달라질 수 있음을 이해하는 것 은 비유기 동안 젖소 영양 및 사양관리에 도움이 될 수 있을 것으로 판단된다. 본 연구는 국내 젖소의 대
사인자의 혈청생화학수치에 대한 프로파일 분석을 통해 참고범위를 설정하였으며, 이는 젖소의 질병예 방 및 조기치료를 위한 기초자료로 유용하게 활용될 수 있을 것이다.
감사의 글
본 논문은 농촌진흥청 연구사업(세부과제명: 소 주 요 질병예방을 위한 표준 면역 및 생체 지표 활용 매 뉴얼 개발, 세부과제번호: PJ01197806)의 지원에 의해 이루어진 것임.
본 연구는 2018년도 농촌진흥청(국립축산과학원) 전문연구원 과정 지원사업에 의해 이루어진 것임.
REFERENCES
Brscic M, Cozzi G, Lora I, Stefani AL, Contiero B, Ravarotto L, Gottardo F. 2015. Short communication: Reference lim- its for blood analytes in Holstein late-pregnant heifers and dry cows: Effects of parity, days relative to calving, and season. J Dairy Sci 98: 7886-7892.
Cameron RE, Dyk PB, Herdt TH, Kaneene JB, Miller R, Bucholtz HF, Liesman JS, Vandehaar MJ, Emery RS.
1998. Dry cow diet, management, and energy balance as risk factors for displaced abomasum in high producing dairy herds. J Dairy Sci 81: 132-139.
Cozzi G, Ravarotto L, Gottardo F, Stefani AL, Contiero B, Moro L, Brscic M, Dalvit P. 2011. Short communication: ref- erence values for blood parameters in Holstein dairy cows: effects of parity, stage of lactation, and season of production. J Dairy Sci 94: 3895-3901.
Duffield T. 2000. Subclinical ketosis in lactating dairy cattle. Vet Clin North Am Food Anim Pract 16: 231-253, v.
Edmonson A, Lean I, Weaver L, Farver T, Webster G. 1989. A body condition scoring chart for Holstein dairy cows.
Journal of dairy science 72: 68-78.
Esposito G, Irons PC, Webb EC, Chapwanya A. 2014. Interac- tions between negative energy balance, metabolic dis- eases, uterine health and immune response in transition dairy cows. Anim Reprod Sci 144: 60-71.
Friedrichs KR, Harr KE, Freeman KP, Szladovits B, Walton RM, Barnhart KF, Blanco-Chavez J, American Society for Veterinary Clinical P. 2012. ASVCP reference interval guidelines: determination of de novo reference intervals in veterinary species and other related topics. Vet Clin Pathol 41: 441-453.
Goff JP. 2004. Macromineral disorders of the transition cow. Vet Clin North Am Food Anim Pract 20: 471-494, v.
Gonzalez FD, Muino R, Pereira V, Campos R, Benedito JL. 2011.
Relationship among blood indicators of lipomobilization and hepatic function during early lactation in high-yield- ing dairy cows. J Vet Sci 12: 251-255.
Horst RL, Goff JP, Reinhardt TA. 2005. Adapting to the tran- sition between gestation and lactation: differences be- tween rat, human and dairy cow. J Mammary Gland Biol Neoplasia 10: 141-156.
Kayano M, Kida K. 2015. Identifying alterations in metabolic profiles of dairy cows over the past two decades in Japan using principal component analysis. J Dairy Sci 98:
8764-8774.
Kida K. 2003. Relationships of metabolic profiles to milk pro- duction and feeding in dairy cows. J Vet Med Sci 65:
671-677.
Liang D, Wood CL, McQuerry KJ, Ray DL, Clark JD, Bewley
JM. 2013. Influence of breed, milk production, season, and ambient temperature on dairy cow reticulorumen temperature. J Dairy Sci 96: 5072-5081.
Mellado M, Antonio-Chirino E, Meza-Herrera C, Veliz FG, Arevalo JR, Mellado J, de Santiago A. 2011. Effect of lactation number, year, and season of initiation of lacta- tion on milk yield of cows hormonally induced into lac- tation and treated with recombinant bovine somatotropin.
J Dairy Sci 94: 4524-4530.
Moretti P, Paltrinieri S, Trevisi E, Probo M, Ferrari A, Minuti A, Giordano A. 2017. Reference intervals for hematological and biochemical parameters, acute phase proteins and markers of oxidation in Holstein dairy cows around 3 and 30days after calving. Res Vet Sci 114: 322-331.
Puppel K, Kuczynska B. 2016. Metabolic profiles of cow's blood;
a review. J Sci Food Agric 96: 4321-4328.
Quiroz-Rocha GF, LeBlanc SJ, Duffield TF, Wood D, Leslie KE, Jacobs RM. 2009. Reference limits for biochemical and hematological analytes of dairy cows one week before and one week after parturition. Can Vet J 50: 383-388.
Reinhardt TA, Horst RL, Goff JP. 1988. Calcium, phosphorus, and magnesium homeostasis in ruminants. Vet Clin North Am Food Anim Pract 4: 331-350.
Roche JR, Lee JM, Macdonald KA, Berry DP. 2007. Relation- ships among body condition score, body weight, and milk production variables in pasture-based dairy cows. J Dairy Sci 90: 3802-3815.
Walters AH, Pryor AW, Bailey TL, Pearson RE, Gwazdauskas FC. 2002. Milk yield, energy balance, hormone, fol- licular and oocyte measures in early and mid-lactation Holstein cows. Theriogenology 57: 949-961.