• 검색 결과가 없습니다.

Spatial Distribution Pattern of the Populations of Camellia japonica in Busan

N/A
N/A
Protected

Academic year: 2021

Share "Spatial Distribution Pattern of the Populations of Camellia japonica in Busan"

Copied!
7
0
0

로드 중.... (전체 텍스트 보기)

전체 글

(1)

Spatial Distribution Pattern of the Populations of Camellia japonica in Busan

Man Ki Kang

1

and Man Kyu Huh

2

*

1

Department of Data Information Science, College of Natural Sciences & Human Ecology, Dongeui University, Busan 614-714, Korea

2

Department of Molecular Biology, College of Natural Sciences & Human Ecology, Dongeui University, Busan 614-714, Korea Received May 9, 2014 /Revised July 11, 2014 /Accepted July 13, 2014

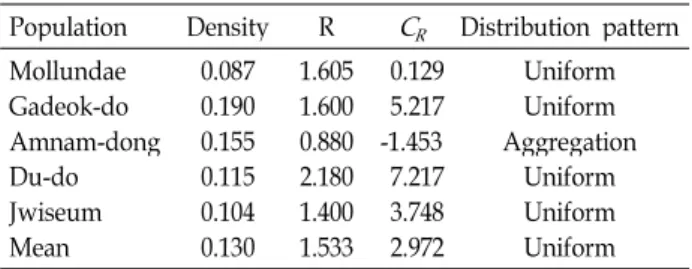
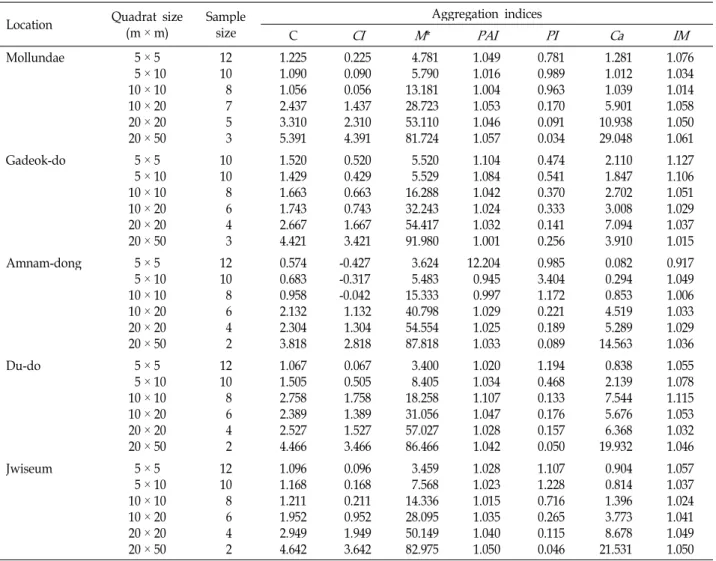
The spatial distribution of geographical distances at five natural populations of Camellia japonica in Busan, Korea was studied. The four plots (Mollundae, Gadeok-do, Du-do, and Jwiseum) of C. japonica were uniformly distributed in the forest community and only one plot (Amnam-dong) was ag- gregately distributed in the forest community. Morisita index is related to the patchiness index showed that the plot 20 m × 50 m had an overly steep slope when the area was larger than 20 m

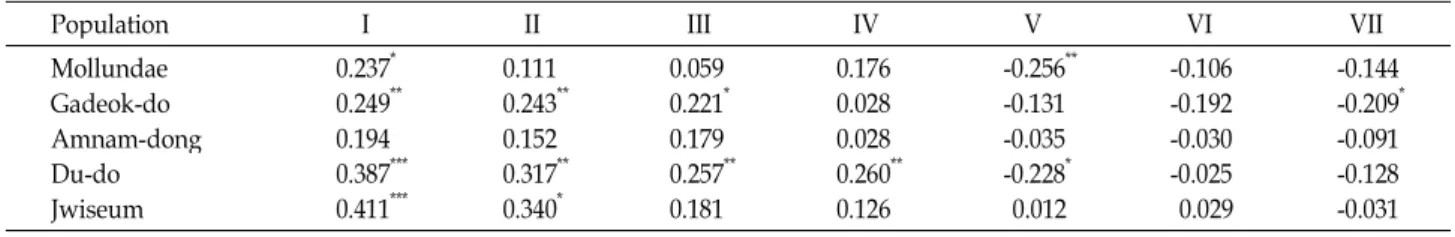
× 20 m, which indicated that the degree of aggregation increased significantly with increasing quadrat sizes, while the patchiness indices did not change from the plot 5 m × 10 m to 10 m × 10 m. The spatial structure was quantified by Moran's I, a coefficient of spatial autocorrelation. Ten of the sig- nificant values (76.9%) were positive, indicating similarity among individuals in the first 4 distance classes (80 m), i.e., pairs of individuals with dissimilarity characteristics can separate by more than 100 m.

Key words : Moran’s I, patchiness index, quadrat, spatial distribution

*Corresponding author

*Tel : +82-51-890-1521, Fax : +82-51-890-1529

*E-mail : [email protected]

This is an Open-Access article distributed under the terms of the Creative Commons Attribution Non-Commercial License (http://creativecommons.org/licenses/by-nc/3.0) which permits unrestricted non-commercial use, distribution, and reproduction in any medium, provided the original work is properly cited.

Journal of Life Science 2014 Vol. 24. No. 8. 813~819 DOI : http://dx.doi.org/10.5352/JLS.2014.24.8.813

Introduction

In recent decades, there was much increase in the stat- istical tools used in spatial ecology [13]. Botanists, ecologists, geographers and plant evolutionary biologists have long rec- ognized that plants are not distributed at random within communities but are rather clustered in distinct patches [8, 20]. Environmental heterogeneity is usually cited as playing a critical role in determining the spatial structure, but colo- nization patterns and stochastic events affecting establish- ment and mortality are also important [18]. More recently, plant evolutionary biologists have demonstrated that genetic variations in plant populations are also nonrandomly dis- tributed [6]. This nonrandom distribution of genetic varia- tion is often referred to as the genetic structure of a pop- ulation [9]. The genetic structure is an integral part of the process of population genetics [5]. Population structure in- teracts with a number of factors: microenvironmental hetero- geneity, mortality due to stochastic events [19], and mating systems that feature limited dispersal of seed or pollen [5].

Of the several methods of describing the spatial dis- tribution of plant community the simplest way is percentage distribution of individuals over the geographical areas.

Another methodology usually adopted is to list the geo- graphical areas of a given class into rank order which en- ables comparison of ranking from individual to individual.

In this report, the several statistical tools of percentage dis- tribution and population structure of the geographical areas are used to study the spatial distribution of Camellia japonica in Busan.

In theory, genetic differentiation over short distances may occur either as a result of spatially variable selection or lo- calized genetic drift, provided that gene flow is sufficiently restricted [14]. Indirect evidence for genetic correlations be- tween neighboring plants has been obtained from data on mating systems [5]. Localized seed and pollen dispersals produce family clusters within these populations [7]. Several studies have revealed decreased seed set and seed survivor- ship from mating between genetically similar near-neigh- bors, which has been interpreted as inbreeding depression [10].

In the wild, C. japonica is found in mainland China

(Shandong, east Zhejiang), Taiwan, southern Korea and

southern Japan. C. japonica is sometimes called the rose of

winter, it belongs to the Theaceae family. An edible oil is

obtained from the seeds of this species. The leaves are a tea

substitute. The dried flowers used as a vegetable or mixed

(2)

Fig. 1. The five studied populations of Camellia japonica in Busan, Korea. ANM: Amnam-dong, DUD: Du=do, JWI: Jwiseum, GAD: Gadeok-do with gelatinous-rice to make a Japanese food called ‘mochi’.

Saha-gu and Gangseo-gu locate in south of the Korean, and at the western part of the North Pacific Ocean. A sample of a large (more than 300 individuals) natural population of wild species C. japonica collected at Saha-gu and Gangseo- gu in Korea was used in this study.

The purpose of this paper was to describe a statistical analysis for detecting a species association, which is valid even when the assumption of within- species spatial ran- domness is violated. The purpose of this study is to find if there a spatial structure within four populations of C. ja- ponica and 2) if so, what is the spatial pattern and if it is the same for all populations?

Materials and Methods Study area

We conducted the spatial analysis in the communities of Camellia japonica at Saha-gu and Gangseo-gu in Busan-si (Fig.

1). This area is on the southern margin of Busan. It has a temperate climate with a little hot and long summer. In this region the mean annual temperature is 14.7℃ with the max- imum temperature being 29.4℃ in August and the minimum -0.6℃ in January. Mean annual precipitation is about 1519.1 mm with most rain falling period between June and August.

Sampling procedure

We established nine plots with an area of 20 m × 160 m

each around four populations at Saha-gu and one population at Gangseo-gu in Busan, 2014. We randomly located quad- rates in each plot which we established populations. The quadrat sizes were 5 m × 5 m, 5 m × 10 m, 10 m × 10 m, 10 m × 20 m, 20 m × 20 m, and 20 m × 50 m. We mapped all plants to estimate population density.

Index calculation and data analysis

The spatial pattern of C. japonica was analyzed according to the Neatest Neighbor Rule [3, 11] with Microsoft Excel 2010.

Average viewing distance ( r

A

) was calculated as follows:

Where r

i

is the distance from the individual to its nearest neighbor. N is the total number of individuals within the quadrat.

The expectation value of mean distance of individuals within a quadrat (r

B

) was calculated as follows:

Where D is population density and D is the number of individuals per plot size.

R = r

A

/ r

B

When R>1, it is a uniform distribution, R=1, it is a random distribution, R<1, it is an aggregated distribution.

The significance index of the deviation of R that departs

from the number of “1” is calculated from the following for-

(3)

Table 1. Spatial patterns of Camellia japonica individuals at five populations in Busan

Population Density R C

R

Distribution pattern Mollundae

Gadeok-do Amnam-dong Du-do Jwiseum Mean

0.087 0.190 0.155 0.115 0.104 0.130

1.605 1.600 0.880 2.180 1.400 1.533

0.129 5.217 -1.453 7.217 3.748 2.972

Uniform Uniform Aggregation

Uniform Uniform Uniform R and C

R

were shown in text.

mula [11].

When C

R

>1.96, the level of the significance index of the deviation of R is 5%, and when C

R

>2.58, the level is 1%.

We calculated the degree of population aggregation under different sizes of plots by dispersion indices: index of clump- ing or the index of dispersion (C), aggregation index (CI), mean crowding (M*), patchiness index (PAI), negative bino- minal distribution index K, Ca indicators (Ca is the name of one index) [12] and Morisita index (IM) were calculated with Microsoft Excel 2010. The formulae are as follows:

Index of dispersion:

Aggregation index

Mean crowding = m+CI=m+C-1-1

Patchiness index Aggregation intensity

Ca indicators

IM =

Where S

2

is variance and m is mean density of C. japonica.

When C, M*, PAI >1, it means aggregately distributed, when C, M*, PAI <1, it means uniformly distributed, when CI, PA, Ca >0, it means aggregately distributed, and when CI, PA, Ca <0 it means uniformly distributed.

We used the mean aggregation number to find the reason for the aggregation of C. japonica [1].

Where r is the value of chi-square when the degree of freedom is 2k and k is the aggregation intensity.

Spatial structure

Numerical simulations of previous analyses were per- formed to investigate the significant differences at various distance scales, i.e., 10.0, 20.0 m, and so on. However, no significant population structure was found within the 20.0 m distance classes by means of Moran's I, and a significant population structure was revealed beyond 20.0-m. Thus, the

distance classes are 0-20.0 m (class I), 20.0-40.0 m (class II), 40.0-60.0 m (class III), 60.0-80.0 m (class IV), 80.0-100.0 m (class V), 100.0-120.0 m (class VI), 120.0-140.0 m (class VII), and 140.0-160.0 m (class VIII). The codes of classes are the same as in the distance classes and are listed Table 1.

The spatial structure was quantified by Moran's I, a co- efficient of spatial autocorrelation (SA) [15, 16]. As applied in this study, Moran's I quantifies the similarity of pairs of spatially adjacent individuals relative to the population sam- ple as a whole. The value of I ranges between +1(completely positive autocorrelation, i.e., paired individuals have identi- cal values) and -1(completely negative autocorrelation). Each plant was assigned a value depending on the presence or absence of a specific individual. If the ith plant was a homo- zygote for the individual of interest, the assigned pi value was 1, while if the individual was absent, the value 0 was assigned.

Pairs of sampled individuals were classified according to the Euclidian distance, dij, so that class k included dij satisfy- ing k - 1 < dij < k + 1, where k ranges from 1 to 7. The interval for each distance class was 20 m. Moran's I statistic for class k was calculated as follows:

I (k) = n∑i∑j(i≠j)WijZiZj/S∑Zi

2

where Zi is pi - p (p is the average of pi); Wij is 1 if the

distance between the ith and jth plants is classified into class

k; otherwise, Wij is 0; n is the number of all samples and

S is the sum of Wij {∑i∑j(i ≠j)Wij} in class k. Under the

randomization hypothesis, I(k) has the expected value u1 =

-1/(n - 1) for all k. Its variance, u2, has been given, for exam-

ple, in Sokal and Oden (1978a). Thus, if an individual is ran-

domly distributed for class k, the normalized I(k) for the

standard normal deviation (SND) for the plant genotype,

g(k) = {I(k) - u1}/u2

1/2

, asymptotically has a standard normal

distribution [3]. Hence, SND g(k) values exceeding 1.96, 2.58,

and 3.27 are significant at the probability levels of 0.05, 0.01,

and 0.001, respectively.

(4)

Table 2. Changes in gathering strength of Camellia japonica at different sampling quadrat sizes Location Quadrat size

(m × m) Sample size

Aggregation indices

C CI M * PAI PI Ca IM

Mollundae 5 × 5

5 × 10 10 × 10 10 × 20 20 × 20 20 × 50

12 10 8 7 5 3

1.225 1.090 1.056 2.437 3.310 5.391

0.225 0.090 0.056 1.437 2.310 4.391

4.781 5.790 13.181 28.723 53.110 81.724

1.049 1.016 1.004 1.053 1.046 1.057

0.781 0.989 0.963 0.170 0.091 0.034

1.281 1.012 1.039 5.901 10.938 29.048

1.076 1.034 1.014 1.058 1.050 1.061

Gadeok-do 5 × 5

5 × 10 10 × 10 10 × 20 20 × 20 20 × 50

10 10 8 6 4 3

1.520 1.429 1.663 1.743 2.667 4.421

0.520 0.429 0.663 0.743 1.667 3.421

5.520 5.529 16.288 32.243 54.417 91.980

1.104 1.084 1.042 1.024 1.032 1.001

0.474 0.541 0.370 0.333 0.141 0.256

2.110 1.847 2.702 3.008 7.094 3.910

1.127 1.106 1.051 1.029 1.037 1.015

Amnam-dong 5 × 5

5 × 10 10 × 10 10 × 20 20 × 20 20 × 50

12 10 8 6 4 2

0.574 0.683 0.958 2.132 2.304 3.818

-0.427 -0.317 -0.042 1.132 1.304 2.818

3.624 5.483 15.333 40.798 54.554 87.818

12.204 0.945 0.997 1.029 1.025 1.033

0.985 3.404 1.172 0.221 0.189 0.089

0.082 0.294 0.853 4.519 5.289 14.563

0.917 1.049 1.006 1.033 1.029 1.036

Du-do 5 × 5

5 × 10 10 × 10 10 × 20 20 × 20 20 × 50

12 10 8 6 4 2

1.067 1.505 2.758 2.389 2.527 4.466

0.067 0.505 1.758 1.389 1.527 3.466

3.400 8.405 18.258 31.056 57.027 86.466

1.020 1.034 1.107 1.047 1.028 1.042

1.194 0.468 0.133 0.176 0.157 0.050

0.838 2.139 7.544 5.676 6.368 19.932

1.055 1.078 1.115 1.053 1.032 1.046

Jwiseum 5 × 5

5 × 10 10 × 10 10 × 20 20 × 20 20 × 50

12 10 8 6 4 2

1.096 1.168 1.211 1.952 2.949 4.642

0.096 0.168 0.211 0.952 1.949 3.642

3.459 7.568 14.336 28.095 50.149 82.975

1.028 1.023 1.015 1.035 1.040 1.050

1.107 1.228 0.716 0.265 0.115 0.046

0.904 0.814 1.396 3.773 8.678 21.531

1.057 1.037 1.024 1.041 1.049 1.050 Aggregation indices were shown in text.

Results The spatial pattern of individuals

Population densities (D) varied from 0.097 to 0.190, with a mean of 0.130 (Table 1). The values of spatial distance (the rete of observed distance-to-expected distance) among the nearest individuals were higher than 1 but Amnam-dong was lower than 1. The four plots (Mollundae, Gadeok-do, Du-do, and Jwiseum) of C. japonica were uniformly dis- tributed in the forest community and only one plot (Amnam-dong) was aggregately distributed in the forest community (Table 1).

The degree of population aggregation

Dispersion index (C) were higher than 1 except for three quadrats (5 m × 5 m, 5 m × 10 m, and 10 m × 10 m) of Amnam-dong (Table 2). As the sizes of quadrat were greater,

the values of C. japonica were high. Thus aggregation indices were positive except for plots which indicate a clumped distribution. The values of PI and Ca were shown greater than zero. The values of PAI except three quadrats of Anman-dong were greater than 1 (Table 2). Thus, the most individuals of C. japonica were clustered and the distribution pattern of the C. japonica was quadrat-sampling dependent.

When the sampling quadrat in Amnam-dong was smaller than 10 m × 10 m, C. japonica were aggregately distributed, and when the sampling quadrat was greater than 10 m x 10 m, the aggregation index showed the trend of being uni- formly distributed for C. japonica. The mean crowding (M*) and aggregation intensity (Ca) indicator were higher with a big quadrat.

Morisita index (IM) related to the patchiness index (PAI)

showed that the plot 20 m × 50 m had an overly steep slope

when the area was larger than 20 m × 20 m, which indicated

(5)

Fig. 2. The curves of patchiness in four populations of Camellia japonica using values of Green index.

Table 3. Spatial autocorrelation coefficients (Moran's I ) among five populations of Camellia japonica for seven distance classes

Population I II III IV V VI VII

Mollundae Gadeok-do Amnam-dong Du-do Jwiseum

0.237

*

0.249

**

0.194 0.387

***

0.411

***

0.111 0.243

**

0.152 0.317

**

0.340

*

0.059 0.221

*

0.179 0.257

**

0.181

0.176 0.028 0.028 0.260

**

0.126

-0.256

**

-0.131 -0.035 -0.228

*

0.012

-0.106 -0.192 -0.030 -0.025 0.029

-0.144 -0.209

*

-0.091 -0.128 -0.031

* p <0.05, ** p <0.01, *** p <0.001.

Fig. 3. The changes in the mean aggregation numbers for five populations.

that the degree of aggregation increased significantly with increasing quadrat sizes, while the patchiness indices did not change from the plot 5 m × 10 m to 10 m × 10 m (Fig.

2).

The mean aggregation number analysis showed that the reasons for aggregation of C. japonica differed in quadrats with different plot sizes (Table 3). The cluster at 5 m × 5 m quadrat was determined by environmental factors. When the sizes were greater than 10 m × 10 m quadrat, the clusters were determined by both species characteristics and envi- ronmental factors.

Analysis of spatial autocorrelation

The spatial autocoefficient, Moran's I is presented in Table 3. Separate counts for each type of joined individuals and for each distance class of separation were tested for sig- nificant deviation from random expectations by calculating the SND. Moran's I of C. japonica significantly differed from the expected value in only 13 of 35 cases (37.1%). Thirteen of these values (37.1%) were negative, indicating a partial dissimilarity among pairs of individuals in the seven dis- tance classes. Ten of the significant values (76.9%) were pos- itive, indicating similarity among individuals in the first four distance classes, i.e., pairs of individuals can separate by

more than 100 m. Namely, significant aggregations were partially observed within IV classes. As a matter of course, the negative SND values at classes IV, V, and VI. Thus, dis- similarity among pairs of individuals could be found by more than 100 m.

The comparison of Moran’s I values to a logistic re- gression indicated that a highly significant percentage of in- dividual dispersion in C. cammelia populations of the Saha-gu and Gangseo-gu could be explained by isolation by distance.

Discussion

When the value of δ is less than 2, the aggregation is

mainly caused by the environmental factors [11]. When δ

is higher than 2, the aggregation is mainly caused by both

species characteristics and environmental factors [11]. We

recognized that the important environmental factors might

be considered competition, growth rate, little decomposition,

light, and below-ground resources. The characteristics of the

C. japonica included primarily their life history, artificial dis-

turbance, and population density. Life history theory seeks

to understand the variation in traits such as growth rate,

number and size of offsprings and life span observed in na-

(6)

ture, and to explain them as evolutionary adaptations to en- vironmental conditions [17]. The cluster was determined by environmental factors when the sampling quadrat was smaller than 10 m × 10 m (<2). Artificial disturbance such as constitutional roads is an important environmental factor affecting C. japonica in Amnam-dong. At the plots which had fewer C. japonica, the cluster was mainly determined by C.

japonica themselves; the mean value of the aggregation index changed irregularly with the variation in plot sizes.

A significant positive value of Moran's I indicated that pairs of individuals separated by distances that fell within distance class IV had similar individuals, whereas a sig- nificant negative value indicated that they had dissimilar individuals. The overall significance of individual correlo- grams was tested using Bonferroni's criteria. The results re- vealed that patchiness similarity was shared among in- dividuals within up to a scale of an 80 m distance. Thus it was looked for the presence of dispersion correlations be- tween neighbors at this scale.

The results from this study are consistent with the suppo- sition that a plant population is subdivided into local demes, or neighborhoods of related individuals [4, 7]. Previous re- ports on the local distribution of genetic variability sug- gested that microenvironmental selection and limited gene flow are the main factors causing substructuring of alleles within a population [5].

The community of C. japonica at Gadeok-do is the Busan Natural Monument No. 38. There are some communities of the Korean Natural Monuments of C. japonica: No. 66 (Daecheon-do, Ungjin-gun, Gyeonggi-do). No. 161 (Baek- ryeonsa, Gangjin-gun, Jeon-nam), No. 169 (Marhang-ri, Seocheon-gun, Chung-nam), No. 184 (Seonsa, Gochang-gun, Jeon-buk), No. 489 (Okrhongsa, Gwangyang-ci, Jeon-nam).

C. japonica is one of very important resource of East Asia.

The camellia in Europe was brought details of over 30 vari- eties back from Asia. Camellias were introduced into Europe during the 18th century and had already been cultivated in the Orient for thousands of years.

In conclusion, C. japonica populations within the Saha-gu and Gangseo-gu were observed a strong spatial structure.

Neighboring patches of C. japonica were predominantly 80 to 100 m apart on average. The present study demonstrates that a spatial structure of C. japonica in the Saha-gu and Gangseo-gu populations could be explained by isolation by distance, limited gene flow, and topography. The results of this study were used as systematic conservation planning

which is an effective way to seek and identify efficient and effective types of reserve design to capture or sustain the highest priority biodiversity values and to work with com- munities in support of local ecosystems.

Acknowledgement

This work was supported by Dong-eui University Grant (2014AA474).

References

1. Arbous, A. G. and Kerrich, J. E. 1951. Accident statistics and the concept of accident proneness. Biometrics 7, 340-342.

2. Clark, P. J. and Evans, F. C. 1954. Distance to nearest neigh- bor as a measure of spatial relationships in populations.

Ecology 35, 445-453.

3. Cliff, A. D. and Ord, J. K. 1971. Spatial autocorrelation . Pion, London.

4. Ehrlich, P. R. and Raven, P. H. 1969. Differentiation of populations. Science 165, 1228-1232.

5. Epperson, B. K., Chung M. G. and Telewski, F. W. 2003.

Spatial pattern variation in a contact zone of Pinus ponderosa and P. arizonica (Pinaceae). Am J Bot 90, 25-31.

6. Evans, K. L., Duncan, R. P., Blackburn, T. M. and Crick, H. Q. P. 2005. Investigating geographic variation in clutch size using a natural experiment. Functional Ecol 19, 616-624.

7. Garnier, L. K. M., Durand, J. and Dajoz, I. 2002. Limited seed dispersal and microspatial population structure of an agamospermous grass of west African savannahs, Hyparrhe- nia diplandra (Poaceae). Am J Bot 89, 1785-1791.

8. Hamrick, J. L., Godt, M. J. W. and Sherman-Broyles, S. L.

1992. Factors influencing levels of genetic diversity in woody plant species. New Forests 6, 95-124.

9. Hayakawa, T., Tomaru, N. and Yamamoto, S. 2004. Stem distribution and clonal structure of Chamaecyparis pisifera growing in an old-growth beech-conifer forest. Ecol Res 19, 411-420.

10. Ishida, T. A. and Kimura, M. T. 2003. Assessment of with- in-population genetic structure in Quercus crispula and Q.

dentate by amplified fragment length polymorphism analysis.

Ecol Res 18, 619-623.

11. Lian, X., Jiang, Z., Ping, X., Tang, S., Bi, J. and Li, C. 2012.

Spatial distribution pattern of the steppe toad-headed lizard ( Phrynocephalus frontalis ) and its influencing factors. Asian Herpet Res 3, 46-51.

12. Lloyd, M. 1967. Mean crowding. J Anim Ecol 36, 1-30.

13. Reiczigel, J., Lang, Z. Rozsa, L. and Tothmeresz, B. 2005.

Properties of crowding indices and statistical tools to ana- lyze parasite crowding data. J Parasitol 91, 245–252 14. Schoen, D. J. and Latta, R. G. 1989. Spatial autocorrelation

of genotypes in populations of Impatiens pallida and Impatiens capensis . Heredity 63, 181-189.

15. Sokal, R. R. and Oden, N. L. 1978a. Spatial autocorrelation

(7)

초록:부산 사하구 동백나무 집단의 공간적 분포 양상 강만기

1

․허만규

2

*

(

1

동의대학교 자연 ·생활과학대학 데이터정보학과,

2

동의대학교 자연 ·생활과학대학 분자생물학과)

부산광역시 사하구 동백나무 네 집단과 강서구 가덕도의 동백나무 한 집단 분포지에 대한 지리적 거리에 의한

공간적 분포 양상을 연구하였다 . 네 프롯(몰운대, 두도, 쥐섬, 가덕도)은 군집에서 균질한 분포 양상을 나타내었으

나 한 플롯 (암남동)은 응진 형태를 나타내었다. 모리시타 지수는 패치 지수와 유관하며 20 m × 20 m 프롯보다

큰 20 m × 50 m 프롯으로 값이 급격한 증가를 나타내었는데 이는 방형구가 커지면 응집의 정도가 유의하게 증가

한다는 것을 의미한다 . 반면 패치지수는 5 m × 10 m에서 10 m x 10 m까지는 큰 변화가 없었다. 공간적 상관관계 계수인 Moran's I에 의해 유의한 공간 구조를 정량화하였다. 유의한 개체간 유사도(76.9%)는 처음 4거리 등급(80 m)에서 유사성을 보였으며 100 m거리를 초과하면 비유사성 특성을 지닌 개체들의 쌍은 분리될 수 있다.

in biology 1. methodology. Biol J Linn Soc 10, 199-228.

16. Sokal, R. R. and Oden, N. L. 1978b. Spatial autocorrelation in biology 2. some biological implications and four applica- tions of evolutionary and ecological interest. Biol Linn Soc 10, 229-249.

17. Souza, A. F. and Martins, F. R. 2004. Microsite specialzation and spatial distribution of Geonoma brevispatha , a clonal palm in south-eastern Brazil. Ecol Res 19, 521-532.

18. Stearns, S. 1992. The Evolution of Life Histories . Oxford Univ.

Press, UK.

19. Walter, R. and Epperson, B. K. 2004. Microsatatellite analy- sis of structure among seedling in populations of Pinus stro- bus (Pinaceae). Am J Bot 91, 549-557.

20. Woodward, F. I. 1987. Climate and plant distribution . Cambridge Univ. Press, Cambridge, UK.

21. Xia, B. and Abbott, D. 1987. Edible seaweeds of China and

their place in the Chinese diet. Econ Bot 41, 341-353.

수치

Fig. 1. The five studied populations of Camellia japonica in Busan, Korea. ANM: Amnam-dong, DUD: Du=do, JWI: Jwiseum, GAD: Gadeok-dowith gelatinous-rice to make a Japanese food called ‘mochi’.
Table 1. Spatial patterns of Camellia japonica individuals at five populations in Busan
Table 2. Changes in gathering strength of Camellia japonica at different sampling quadrat sizes Location Quadrat size
Fig. 3. The changes in the mean aggregation numbers for five populations.

참조

관련 문서

• 이명의 치료에 대한 매커니즘과 디지털 음향 기술에 대한 상업적으로의 급속한 발전으로 인해 치료 옵션은 증가했 지만, 선택 가이드 라인은 거의 없음.. •

The proposal of the cell theory as the birth of contemporary cell biology Microscopic studies of plant tissues by Schleiden and of animal tissues by Microscopic studies of

Current Tokyo is rich in green compared to other metro cities. In some parts, the greenery has been contributed by the many inherited gardens from the Edo era to today which

In a statement to Kuwait News Agency (KUNA) on the sidelines of a meeting of the Arab Parliament's Foreign Affairs Political and National Security

The meeting was attended by Assistant Foreign Minister for GCC Affairs, Ambassador, Nasser Al-Muzayyen, and Deputy Assistant Foreign Minister for the Office of the

“ Sheikh Nasser has a written message from HH the Amir, Sheikh Sabah Al-Ahmad Al-Jaber Al-Sabah to the Chinese President, Chi Gen Beng related to enhancing mutual

On his part, CEO of Express Roads Authority, Saud Al-Naqqi said that the heavy rains of the previous day led to clogging parts of the express

Kuwait will celebrate on Sunday the fourth anniversary of the UN honoring and proclamation of His Highness the Amir, Sheikh Sabah Al-Ahmad Al-Jaber Al-Sabah as