Application of the Modified CA-Markov Technique for Future Prediction of Forest Land Cover in a Mountainous Watershed
미래 산림식생변화 예측을 위한 개선된 CA-Markov 기법의 적용
Park, Min Ji*
․Park, Geun Ae
*․Lee, Yong Jun
*․Kim, Seong Joon
*,†박민지
*․박근애
*․이용준
*․김성준
*,†ABSTRACT
토지피복은 대부분의 수문‧수질 모형의 중요한 매개변수로서, 수자원 변화 예측에 중요한 입력자료로 활용되고 있다. 본 연구 에서는 개선된 CA (Cellular Automata)-Markov 기법을 이용하여 충주댐유역의 미래 산림식생변화에 대한 예측을 시도하였다. 예 측과정으로 과거의 Landsat TM 영상 (1985, 1990, 1995, 2000)을 이용하여 기법의 정확도 검증 및 산림분포의 변화경향을 파악 하고, Landsat 산림은 2000년과 2005년의 NOAA AVHRR NDVI값을 기준으로 침엽수림, 혼효림, 활엽수림의 3종으로 구분한 후, 이를 이용하여 2030년, 2060년, 2090년의 식생변화를 추정하는 방법을 제안하였다. 이 방법의 적용결과, 2000년과 비교하여 2090 년의 활엽수림과 혼효림은 각각 14.3 %, 11.6 % 증가하였으며, 침엽수림은 24.9 % 감소하는 것으로 나타났다. 과거의 경향성에 의해 예측을 시도한 본 연구결과는 미래 토지피복 변화에 따른 수문‧수질 영향 분석시 지표 조건의 불확실성을 줄이는데 활용될 수 있다고 판단된다.
Keywords: Land use change; Markov Chain; Cellular Automata; Prediction; Modified CA-Markov; Forest Type
I. INTRODUCTION*
Land use change in South Korea is becoming an important topic in water resources and environmental areas. It has attracted a lot of scientific interest due to the close correlation between land use change and recent flood disasters and water resources management along with climate change (Fischer and Sun, 2001;
Matthews et al., 1997; Verburg and Veldkamp, 2001).
Thus the potential prediction of land use is an important factor for future healthy watershed hydrology and sustainable water resource management. The change of land use is affected strongly by socioeconomic factors such as land policies, population migration, urbanization, and agricultural product prices (Tong et al., 2003). In South Korea, land policy is the most important factor
* Dept. of Civil and Environmental System Engineering, Konkuk University
† Corresponding author. Tel.: +81-2-450-3749 Fax: +81-444-0186
E-mail address: [email protected] 2009년 12월 22일 투고
2010년 1월 11일 심사완료 2010년 1월 19일 게재확정
affecting land use patterns especially in suburban areas.
South Korea has area of 99,820.8 km2 and about 63.5 % of the total area is forest. Topographic elevations are high in the north and east, and lowlands are developed in the southwest. Most of the rivers and streams flow from east to west. During the past couple of decades, the changes of forest land use have been performed by reclamation for upland and orchard crops cultivation and golf links development, and occurred by forest fires and land slides. The changes directly affect evapotranspiration, infiltration and soil water storage that change the dy- namics of surface and subsurface runoff and groundwater recharge of a watershed.
Recently, many studies have been carried out for evaluating the hydrologic impacts of land use change on urbanizing or wetland watershed (McClintock et al., 1995; Choi et al., 2003; Kim et al., 2005). Usually, the impact assessment is being conducted by preparing series of land use data spatially classified by satellite images for a hydrologic model. Meanwhile, if we are trying to evaluate the future potential land use change impact on watershed hydrological, environmental and
ecological behaviors, we need future land use/cover data for the watershed. The future land use prediction model should be able to match the statistical patterns of past growth and to provide an estimate that matches present reality (Clarke et al., 1997; Clarke and Gaydos, 1998).
Different approaches in land use change have been attempted in spatial modeling such as Cellular Automata (CA), Artificial Neural Network Models (ANN), Agents based modeling, and spatial-statistical (e.g. CA-Markov) models. Among the models, the CA has natural affinity with GIS (Geographic Information System) and remotely sensed data (Torrens and Sullivan, 2001). One of the most significant properties of CA is perhaps its simplicity.
The traditional statistical model, Markov chain analysis, has been very successful in interpreting socio-economic activities of land use change. The CA-Markov is the combined technique of Markov Chain and Cellular Automata. Markov Chain model handles lattice-based GIS data or satellite images, and reflects the changed tendency of present land use. The transition probability is fixed for a given time interval, but is difficult to trace the actual land use change. If we consider the change of fixed interval, the processing of spatial data that have sudden change is difficult to predict. This difficulty can be supplemented using CA, a nonlinear dynamic model which applies the distance direction to the cell and the change state of regional contiguity cell continuously. The changed state of cell can be estimated together by the complex characteristics and conformation because of recursive analysis. Park and Kim (2007) predicted the spatial expansion of urban areas by applying CA-Markov technique considering MCE (multi-criteria evaluation) and MOLA (multi-objective land allocation) of factor analysis.
In applying the CA-Markov technique, Lee and Kim (2007) suggested a prediction method of land use change by modifying the CA-Markov technique. They reflected a logarithmic function for the trend of past land use change of each item and considered data of water quality protection area and green belt area to include systematic factor, and applied the minimal preserved probability that is the percent of upper limit of land use change between land use classes in the process of prediction to prevent unrealistic prediction of future land
use. Their result showed an enhanced prediction by comparing the spatial fit between the original and the modified ones.
In this study, the modified CA-Markov technique is applied to a 6,661.3 km2 forest-dominant watershed, and predicts the future land use change of the watershed by using the series of Landsat TM (Thematic Mapper) satellite images (1985, 1990, 1995, and 2000). Successively, using the future predicted results of forest area, the future prediction of watershed forest types (evergreen, deciduous, and mixed) of the watershed is described using two (2000 and 2005) NOAA AVHRR (National Oceanic and Atmospheric Administration Advanced Very High Resolution Radiometer) NDVI (Normalized Difference Vegetation Index) data.
II. THE STUDY WATERSHED
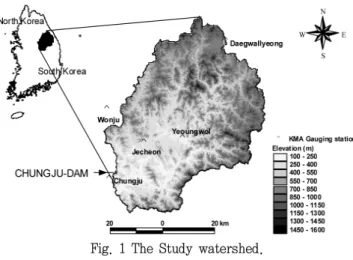
The study watershed has a total area of 6,661.3 km2 located in the northeast of South Korea within the latitude-longitude range of 127.2°E ~ 129.0°E and 36.1°N
~ 37.1°N. (Fig. 1). The elevation ranges from 115 m to 1,559 m with average hillslope of 36.9 % and average elevation of 609 m. The annual average precipitation was 1,359.5 mm, and mean temperature was 9.4 ℃ over the last 30 years. At the outlet of the watershed, Chungju dam that is 97.5 m in height, 447 m in length and has a volume of 9.7 million m3 is located. Forest covers 84.5
%, and 0.8 % and 11.1 % of lowland are upland crop and rice paddy fields respectively.
Fig. 1 The Study watershed.
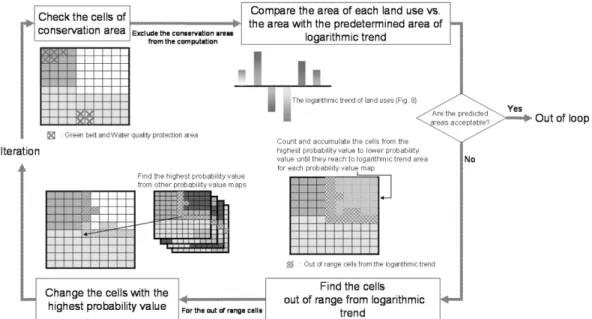
Fig. 2 The schematic diagram of the modified CA-Markov technique (Lee and Kim, 2007).
III. Materials and Method
1. The CA-Markov technique applied in this study
CA-Markov, one of the spatial-statistical model, is a combined Markov Chain and Cellular Automata land cover prediction procedure that adds an element of spatial contiguity as well as knowledge of the likely spatial distribution of transitions to Markov chain analysis. M arkov chain, studied at the discrete time points of 0, 1, 2, ..., is characterized by a set of states S and the transition probabilities ‘pij’ between the states. Here, pij
is the probability that the Markov chain is at the next time point in state j, given that it is at the present time point at state i. The probability matrix P with elements pij is called the transition probability matrix of the Markov chain. The definition of pij implies that the row sums of P are equal to “1” (Adan, 2003). The transition probability determines the likelihood for a cell to change from a land use class to other class, and the matrix is the result of cross tabulation between two land use data adjusted by the proportional error.
The CA first introduced by John von Neumann in 1950s has common place applications in statistical and theoretical physics, and is considered to be linked to the chaos theory and fractal geometry. Recently, cellular automata applications have found their way into 2-D
applications in urban growth models. CA is nonlinear dynamic mathematical systems based on discrete time and space (Gutowitz, 1991). A cellular automaton evolves in discrete time-steps by updating its states according to a transition rule that is applied universally and synchronously to each cell at each time-step. The value of each cell is determined based on a geometric configuration of neighboring cells, which is specified as part of the transition rule. Updated values of individual cells then become the inputs for the next iteration. As iteration is progressed, an initial cellular configuration, which is a kind of cellular map containing an initial state of each cell, evolves based on the rules defined. The transition rules adopted in this study is a probabilistic function of the neighborhood. Fig. 2 shows the schematic diagram of the modified CA-Markov technique adopted in this study (Lee and Kim, 2007).
As the first step for the application of the CA-Markov technique (Fig. 2), the conservation areas such as water quality protection area and greenbelt zone are excluded in the calculation process (upper left part of Fig. 2). By the government policy, the areas are preserved by legislation. This condition is included as social and political factors.
Originally, the CA-Markov process uses two time step data of past year and present year, for example, 1985 and 2000, to predict the next future land uses, 2020 or
(a) (b)
(c) (d)
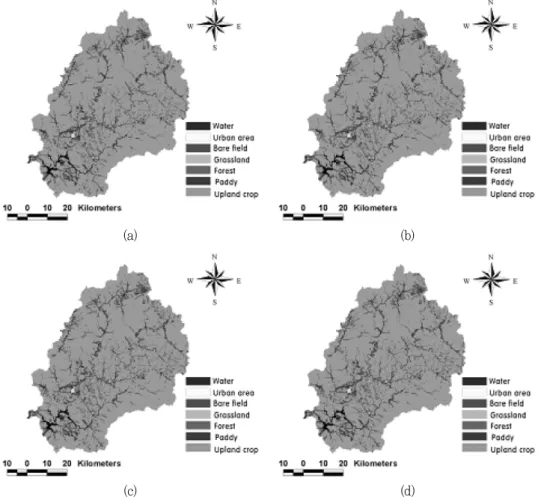
Fig. 3 The Landsat land uses of the study watershed; (a) 1985, (b) 1990, (c) 1995, and (d) 2000.
2030. However, the land use change pattern shows a nonlinear increase or decrease during a given time interval. Thus, the application of two land use data can give an unrealistic or divergent prediction for a certain land use class. Therefore, as the second step (upper right part of Fig. 2), the land uses are predicted by the pre-determined nonlinear functions of each class, which were derived from the multiple land use data more than two land uses.
Next, the predicted areas of each class are calculated whether all of them are acceptable. For the classes out of range from the pre-determined trend, the predicted cells of out of range class are counted and accumulated from the highest probability value of the class to lower probability value by using the probability value map of the class until the cell counts are within the acceptable range, and change the cells of low probability value into another class of having high probability value while
satisfying the trend of all classes (bottom right and left of Fig. 2). This process is iterated until all the classes satisfy the acceptable range of each pre-determined trend.
2. The land use data
Fig. 3 shows the Landsat land use data (1985, 1990, 1995, and 2000) for the study watershed and Table 1 shows the statistical summary of land use change during the periods. The data were obtained from Ministry of Land, Transport and Maritime Affairs (http://www.wamis.
go.kr/).
As the Landsat data in Fig. 3 do not include the forest class, the forest was tried to reclassify by using vegetation information. In this study, the NOAA AVHRR NDVI was adopted to classify the forest into 3 types viz. evergreen, mixed, and deciduous. The daily data of NOAA-14 AVHRR for 2000 and 2005 were obtained
(a) (b)
Fig. 4 The forest type classified by using NOAA NDVI; (a) 2000, (b) 2005.
from the Korea Meteorological Administration (KMA). The NDVI value of each cell is computed with Eq. (1).
(1)
where IR is the cell value of channel 2 (infrared: 0.73 - 1.0 μm) and R is the cell value of channel 1 (visible:
0.58 - 0.68 μm). The year value of NDVI was calculated through the Maximum Value Composite (MVC) method of each cell.
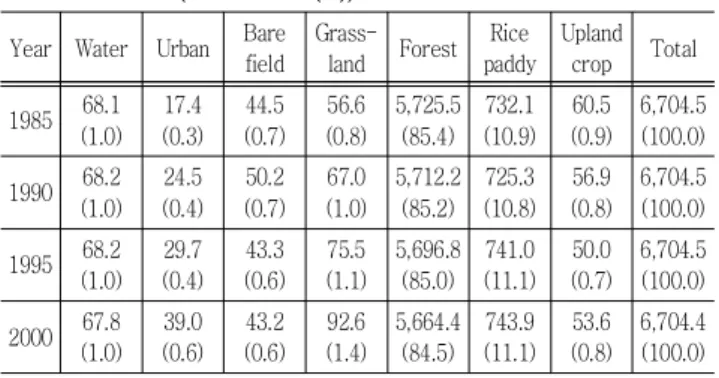
Table 1 Statistical summary of land uses from 1985 to 2000 (Unit: km2 (%))
Year Water Urban Bare field
Grass-
land Forest Rice paddy
Upland crop Total
1985 68.1 (1.0)
17.4 (0.3)
44.5 (0.7)
56.6 (0.8)
5,725.5 (85.4)
732.1 (10.9)
60.5 (0.9)
6,704.5 (100.0)
1990 68.2 (1.0)
24.5 (0.4)
50.2 (0.7)
67.0 (1.0)
5,712.2 (85.2)
725.3 (10.8)
56.9 (0.8)
6,704.5 (100.0)
1995 68.2 (1.0)
29.7 (0.4)
43.3 (0.6)
75.5 (1.1)
5,696.8 (85.0)
741.0 (11.1)
50.0 (0.7)
6,704.5 (100.0)
2000 67.8 (1.0)
39.0 (0.6)
43.2 (0.6)
92.6 (1.4)
5,664.4 (84.5)
743.9 (11.1)
53.6 (0.8)
6,704.4 (100.0)
Table 2 Statistical summary of forest classes in 2000 and 2005 (Unit: km2 (%))
Forest class 2000 2005
Evergreen 3,140.8 (55.5) 2,850.9 (50.4)
Mixed 1,458.9 (25.8) 1,622.0 (28.6)
Deciduous 1,062.5 (18.8) 1,189.3 (21.0)
Total 5,662.2 (100.0) 5,662.2 (100.0)
VI. RESULTS AND DISCUSSION
1. The application results of CA-Markov technique for Landsat land use
By using the values of Landsat land use change from 1985 to 2000, the rates of change of each class were applied as the bound of land use change in calculating the transition probability between land use classes. Table 3 shows the transition probability matrix from 1985 to 2000. To reflect the trend of land use change of each class, the linear or logarithmic fittings were performed using the data.
The modified CA-Markov technique was evaluated using three indices which compare the spatial fit between the known and the predicted. The first index is the ratio of matched cell number of the predicted to the total cell number of the known (α). It ranges from 0 to 1. The second one is the ratio of matched cell number of the predicted to the total cell number as sum of sets of the
Table 3 Transition probability matrix from 1985 to 2000 Land use Water Urban Bare field Grassland Forest Paddy Upland crop
Water 1.00 0.00 0.00 0.00 0.00 0.00 0.00
Urban 0.00 1.00 0.00 0.00 0.00 0.00 0.00
Bare field 0.00 0.00 1.00 0.00 0.00 0.00 0.00
Grassland 0.00 0.00 0.00 0.86 0.09 0.05 0.01
Forest 0.00 0.00 0.00 0.00 0.99 0.01 0.00
Paddy 0.00 0.00 0.01 0.01 0.03 0.94 0.01
Upland crop 0.00 0.14 0.01 0.00 0.05 0.05 0.75
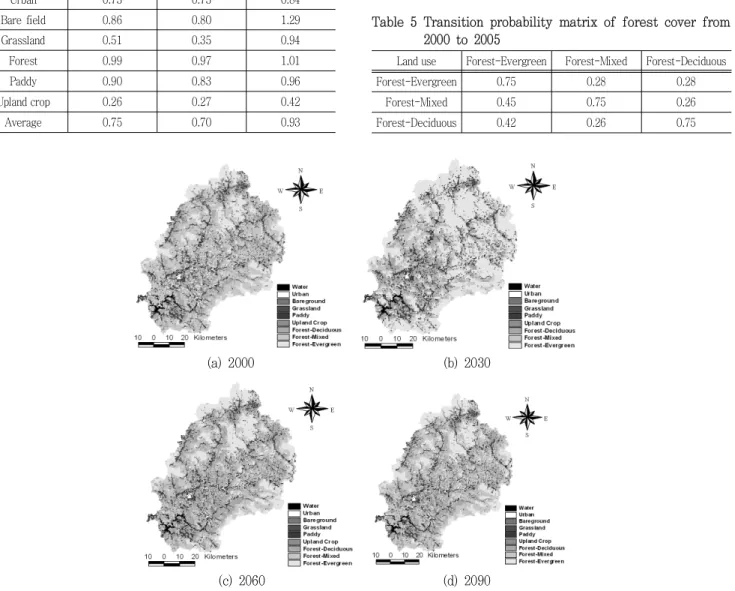
(a) 2000 (b) 2030
(c) 2060 (d) 2090
Fig. 5 The predicted land uses by the modified CA-Markov techniques: (a) 2000, (b) 2030, (c) 2060, and (d) 2090 predicted land uses respectively.
known and the predicted (β) (Lee and Sallee, 1970). It ranges from 0 to 1. Finally, the third one is the ratio of cell number of the predicted to the cell number of the known (γ). It ranges from 0 to 2. For all the indices, the prediction accuracy of spatial fit is perfect when the value of each index is 1.0. For α and β, the prediction accuracy decreases as the value approaches to 0. For γ, the prediction accuracy decreases as the value goes away from 1 to 0 or 2. Table 4 shows the evaluated three (α,
Table 4 Summary of the three evaluated index values (α, β and γ) for each land use class
Land use α (0∼1) β (0∼1) γ (0∼2)
Water 0.97 0.95 1.08
Urban 0.73 0.73 0.84
Bare field 0.86 0.80 1.29
Grassland 0.51 0.35 0.94
Forest 0.99 0.97 1.01
Paddy 0.90 0.83 0.96
Upland crop 0.26 0.27 0.42
Average 0.75 0.70 0.93
β and γ) index values for the 2000 predicted land use using three land use data of 1985, 1990 and 1995. The average values of α, β and γ were 0.75, 0.70, and 0.93 respectively. The errors may come from the spatial resolution of Landsat image which cannot discriminate the precise land uses within 30 m by 30 m pixel and the classification error for each land use is the obstacle for the improvement of prediction accuracy.
2. The future prediction of forest land cover
By using the values of NOAA forest land cover change from 2000 to 2005, the rates of change of each class were applied as the bound of land use change in calculating
Table 5 Transition probability matrix of forest cover from 2000 to 2005
Land use Forest-Evergreen Forest-Mixed Forest-Deciduous
Forest-Evergreen 0.75 0.28 0.28
Forest-Mixed 0.45 0.75 0.26
Forest-Deciduous 0.42 0.26 0.75
Table 6 The CA-Markov predicted land uses for 2030, 2060 and 2090 (Unit: km2 (%))
Year Water Urban Bare field Grass land Forest-Deciduous Forest-Mixed Forest-Evergreen Paddy Upland crop Total 1985 68.1 (1.0) 17.4 (0.3) 44.5 (0.7) 56.6 (0.8) 5,725.5 (85.4) 732.1 (10.9) 60.5 (0.9) 6,704.5 (100.0) 1990 68.2 (1.0) 24.5 (0.4) 50.2 (0.7) 67.0 (1.0) 5,712.2 (85.2) 725.3 (10.8) 56.9 (0.8) 6,704.5 (100.0) 1995 68.2 (1.0) 29.7 (0.4) 43.3 (0.6) 75.5 (1.1) 5,696.8 (85.0) 741.0 (11.1) 50.0 (0.7) 6,704.5 (100.0) 2000 67.8 (1.0) 39.0 (0.6) 43.2 (0.6) 92.6 (1.4) 1,062.5 (15.8) 1,458.9 (21.8) 3,140.8 (46.8) 705.3 (10.5) 22.3 (0.3) 6,704.5 100.0) 2030 72.4 (1.1) 41.2 (0.6) 67.4 (1.0) 90.0 (1.3) 2,241.4 (33.5) 1,786.8 (26.7) 1,668.2 (24.9) 704.6 (10.5) 18.5 (0.3) 6,704.5 100.0) 2060 73.5 (1.1) 43.0 (0.6) 71.4 (1.1) 94.1 (1.4) 2,104.3 (31.5) 2,035.7 (30.4) 1,559.2 (23.5) 692.0 (10.3) 8.2 (0.1) 6,704.5 100.0) 2090 74.3 (1.1) 42.3 (0.6) 75.2 (1.1) 98.1 (1.5) 2,011.0 (30.1) 2,235.4 (33.4) 1,464.3 (21.9) 681.6 (10.2) 8.3 (0.1) 6,704.5 100.0)
the transition probability between forest land cover classes. Table 5 shows the transition probability matrix from 2000 to 2005.
The extended long-term future forest land cover change was conducted within the Landsat forest area distributions. Fig. 5 shows the CA-Markov prediction results for the year of 2030, 2060 and 2090 respectively.
Table 6 shows the statistical summary of the future predicted land use changes including forest type. The predicted results showed that there were 14.3 % and 11.6 % increases in 2090 deciduous and mixed forests based on 2000 condition. On the other hand, the 2090 evergreen forest decreased 24.9 % based on 2000.
V. CONCLUSIONS
The modified CA-Markov technique developed by Lee and Kim (2007) was applied to a 6,661.3 km2 forest- dominant watershed to predict the future land use change of the watershed by using 1985, 1990, 1995, and 2000 Landsat TM images and 2000 and 2005 NOAA AVHRR data. Firstly, by using the three Landsat land use data of 1985, 1990 and 1995, the 2000 land use was predicted and the result was evaluated using the indices suggested by Lee and Kim (2007). The average values of α, β and γ were 0.75, 0.70, and 0.93 respectively. After that, the 2030, 2060 and 2090 forest land cover prediction was conducted using the 2000 and 2005 NOAA classified forest covers (deciduous, mixed, and evergreen) within the 2000 Landsat forest area distributions. The predicted results showed that there were 14.3 % and 11.6 % increases in 2090 deciduous and mixed forests based on 2000 condition. On the other hand, the 2090 evergreen forest decreased 24.9 % based on 2000.
The future land use changes showed the prediction stability of the modified CA-Markov technique, and the predicted results showed a reasonable land use change for each land use class reflecting the past trend of land use change. The results can be applied to future climate change impacts on hydrology and water quality of the watershed considering future land use changes, which reduces the uncertainty of future land surface condition.
Even the method suggested in this study gives some information of the future land use, there are many things to improve the prediction accuracy. Firstly, the land use classification accuracy of input data should be improved to decrease the spatial discrepancy of land use between data. Secondly, the longer data of land use should be prepared to get more stable trend of land use change.
Thirdly, the government land use plans as a political factor, if available, are also necessary to include for more reliable prediction results.
This research was supported by a grant (code # 1-9-3) from Sustainable Water Resources Research Center of 21st Century Frontier Research Program and by Basic Science Research Program through the National Research Foundation of Korea (NRF) funded by the Ministry of Education, Science and Technology (2009-0080745).
REFERENCES
1. Adan I., 2003. Markov chains and Markov processes.
http://www.win.tue.nl/~iadan/sdp/h3.pdf.
2. Choi, J. Y., B.A. Engel, S. Muthukrishnan and J.
Harbor, 2003. GIS based long term hydrologic impact
evaluation for watershed urbanization.
Journal of American Water Resources Association
39(3): 623- 635.3. Clarke, K. C. and L. J. Gaydos, 1998. Loose-coupling a cellular automata model and GIS: long-term urban growth prediction for San Francisco and Washington/
Baltimore.
International Journal of Geographical Information Science
12(7): 699-714.4. Clarke, K. C., S. Hoppen, and L. Gaydos, 1997. A self-modifying cellular automaton model of historical urbanization in the San Francisco Bay area. Environment
and Planning
24(2): 247-261.5. Fischer, G. and L. Sun, 2001. Model-based analysis of future land-use development in China. Agriculture,
Ecosystems & Environment
85(11): 163-176.6. Gutowitz, H., 1991.
Cellular automata theory and experiment.
1st MIT Press edition, Boston, MA.7. Kim, S. J., H. J. Kwon, G. A. Park, and M. S. Lee, 2005. Assessment of land-use impact on streamflow via a gridbased modelling approach including paddy fields.
Hydrol. Process.
19: 3801-3817.8. Matthews, R. B., M. J. Kropff, T. Horie, and D.
Bachelet, 1997. Simulating the impact of climate change on rice production in Asia and evaluating options for adaptation.
Agricultural Systems
54(3):399-425.
9. McClintock, K., J. Harbor, and T. Wilson, 1995.
Assessing the hydrologic impact of land use change in wetland watershed: a case study from northern Ohio, USA. In
Geomorphology and Land Management in a Changing Environment
, McGregor D, Thompson D (eds). Wiley: New York; 107-119.10. Lee, D. R., and G.T. Sallee, 1970. A method of measuring shape.
Geographical Review
60(4): 555- 563.11. Lee, Y. J., and S. J. Kim, 2007. A modified Ca-Markov technique for prediction of future land use change.
Journal of the Korean Society of Civil Engineers
27(6D): 809-817 (in Korean).12. Park, G. A., and S. J. Kim, 2007. Prediction of the urbanization progress using factor analysis and CA- Markov technique.
Journal of the Korean Society of Agricultural Engineers
49(6): 105-114 (in Korean).13. Tong, C., C. A. S. Hall, and H. Wang, 2003. Landuse change in rice wheat and maize production in China (1961-1998). Agriculture.
Ecosystems & Environment
95(3): 523-536.14. Torrens, P. M. and D. O. Sullivan, 2001. Editorial:
Cellular automata and urban simulation: Where do we go from here?
Environment and Planning
28(2): 163- 168.15. Verburg, P. H. and A. Veldkamp, 2001. The role of spatially explicit models in land-use change research:
a case study for cropping patterns in China. Agriculture.